[Preprint]. 2025 Mar 24:2025.03.23.644831.
doi: 10.1101/2025.03.23.644831.

Distinct Roles of Somatostatin and Parvalbumin Interneurons in Regulating Predictive Actions and Emotional Responses During Trace Eyeblink Conditioning

Affiliations

Distinct Roles of Somatostatin and Parvalbumin Interneurons in Regulating Predictive Actions and Emotional Responses During Trace Eyeblink Conditioning

Jiaman Dai et al. bioRxiv. .

Abstract

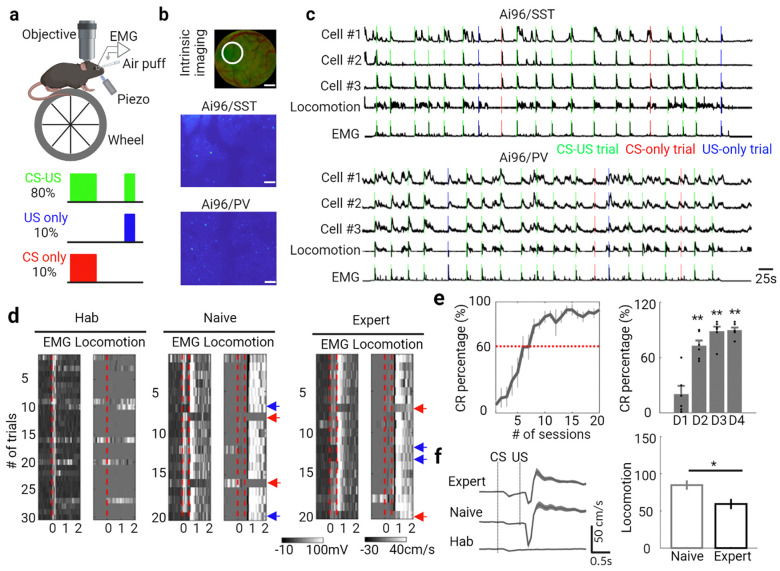
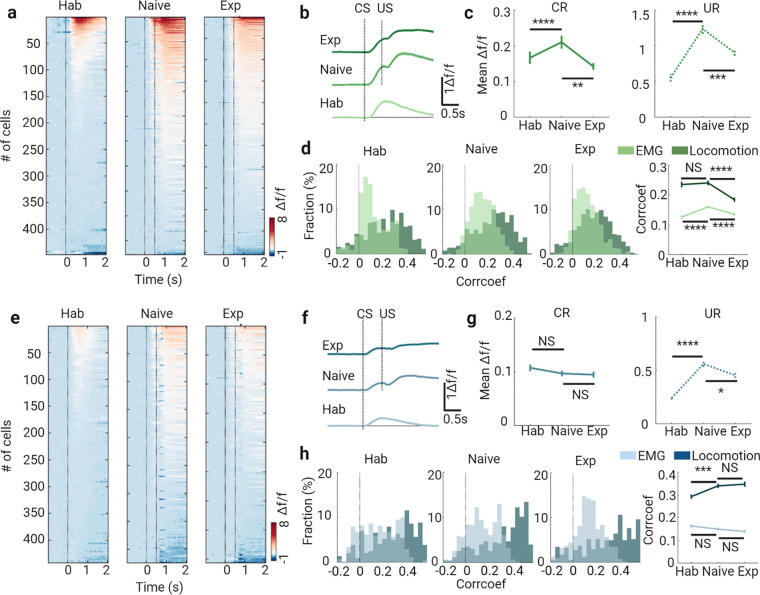
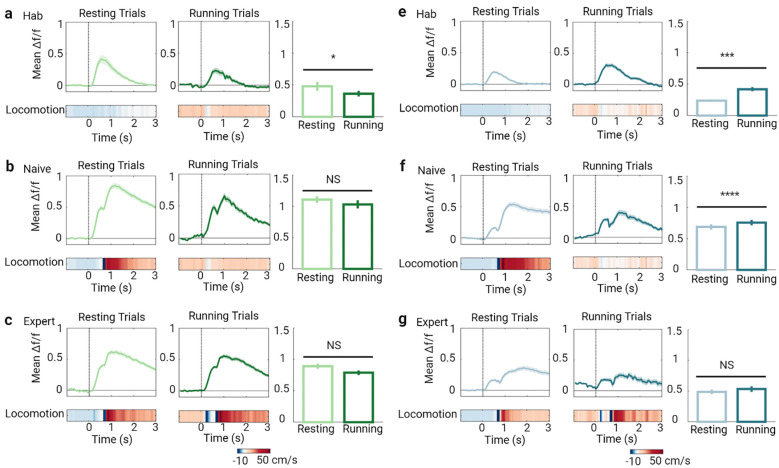
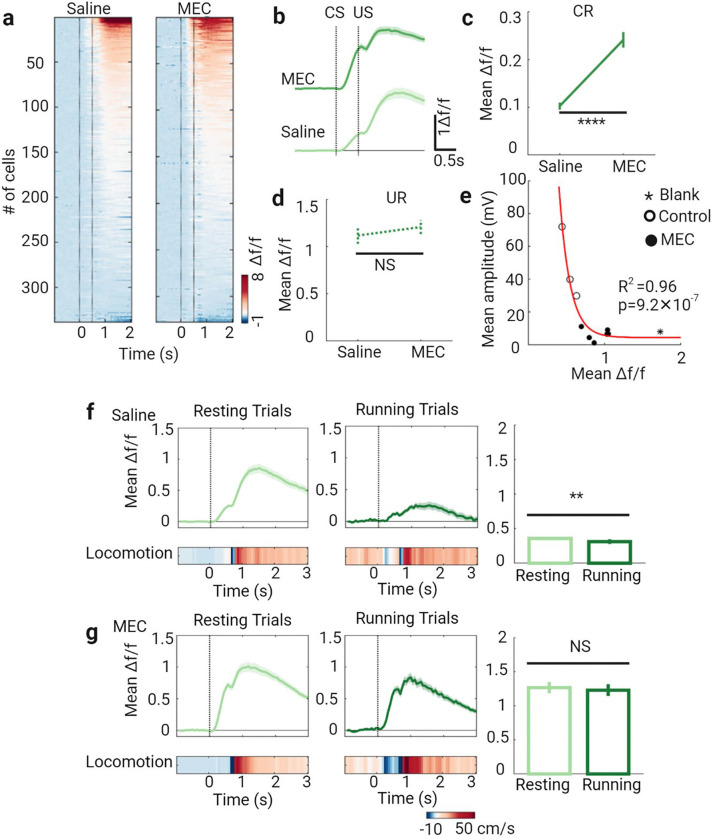
Learning involves evaluating multiple dimensions of information and generating appropriate actions, yet how the brain assigns value to this information remains unclear. In this study, we show that two types of interneurons (INs) in the primary somatosensory cortex-somatostatin-expressing (SST-INs) and parvalbumin-expressing (PV-INs) neurons-differentially contribute to information evaluation during trace eyeblink conditioning (TEC). An air puff (unconditioned stimulus, US) delivered after a whisker stimulus (conditioned stimulus, CS) elicited both reflexive eye closure and stress-related locomotion. However, only self-initiated, anticipatory eye closure during the CS window, measured via electromyography (EMG), was directly relevant to learning performance. We found that SST-IN activity changes aligned with the learning induced changes of the anticipatory eye blinks during the CS period, correlated with the EMG changes across learning. In contrast, PV-IN activity was positively correlated with stress-related locomotion following the US and showed no learning related changes, suggesting a role in processing the emotional or aversive component of the task. Furthermore, cholinergic signaling via nicotinic receptors modulated both SST- and PV-IN activities, in a manner consistent with their distinctive roles, linking these interneurons to the regulation of learning-related actions and emotional responses, respectively. These findings demonstrate that distinct interneuron populations evaluate different dimensions of information-SST-INs for predictive, adaptive actions and PV-INs for stress-related emotional responses-to guide learning and behavior.


Conflict of interest statement

Declaration of interests The authors declare no competing interests.

Figures

Figure 1.
Figure 1.. TEC learning task.
a. Schematic representation of the experimental setup (top) and session structure (bottom), created with BioRender.com. b. Intrinsic imaging signals used to identify the whisker-evoked area in the barrel cortex (top, indicated by the white circle; scale bar, 500 μm). Example fields of calcium imaging for SST- and PV-INs in S1 are shown below (scale bar, 50 μm). c. GCaMP6s signal (Δf/f) traces from four example neurons, along with locomotion and EMG traces during the first session of TEC training (green: CS-US; red: CS-only; blue: US-only). d. EMG and locomotion activity during each trial at each training stage, with vertical dashed lines indicating the onset of CS or US. Orange arrows denote CS-only trials, blue arrows indicate US-only trials, while all other trials are CS-US. e. Evolution of the conditioned response percentage (CR %) across 20 sessions (top). Changes in CR percentage during training are shown below (n=12 mice; Day 1 vs. Day 2, **P=0.0087; Day 1 vs. Day 3, **P=0.0022; Day 1 vs. Day 4, **P=0.0022; Wilcoxon test). Data are expressed as mean ± s.e.m., with shaded areas representing s.e.m. f. Locomotion traces at different training stages, with the vertical dashed line indicating the onset of stimuli (first: whisker stimulation, CS; second: air puff, US). Notable changes in locomotion following US at both the naive and expert stages are observed (n=12 mice; *P=0.012; Wilcoxon test).
Figure 2.
Figure 2.. Changes in Population Activities of Interneurons during TEC Learning.
a. Heat maps of GCaMP6s signals (Δf/f) for all somatostatin interneurons (SST) at different learning stages, aligned to the CS onset. b. Mean signal traces of SST at each learning stage, presented as mean ± s.e.m., with shaded areas representing s.e.m. c. Responses following CS delivery (conditioned response, CR; solid line, activity in CS window) and US delivery (unconditioned response, UR; dashed line, activity in US window) of SST at each learning stage (CR: ****P=1.12 × 10⁻⁷, **P=0.0064; UR: ****P=5.23 × 10−46, ***P=4.10 × 10−46; Wilcoxon test). d. Distribution and changes in correlation coefficients between calcium signals and locomotion (dark green) / EMG (light green) at the three training stages (Locomotion: NS P=0.75, ****P=2.04 × 10⁻⁸; EMG: ****P=3.06 × 10⁻⁶, ****P=9.85 × 10⁻⁶; Wilcoxon test). e. Heat maps of GCaMP6s signals (Δf/f) for all parvalbumin interneurons (PV) at different learning stages, aligned to the CS onset. f. Mean signal traces of PV at each learning stage, shown as mean ± s.e.m., with shaded areas representing s.e.m. g. Responses after CS delivery (CR; solid line, activity in CS window) and US delivery (UR; dashed line, activity in US window) of PV at each learning stage (CR: NS P=0.94, NS P=0.99; UR: ****P=3.14 × 10−²², *P=0.011; Wilcoxon test). h. Distribution and changes in correlation coefficients between calcium signals and locomotion (dark green) / EMG (light green) at the three training stages (Locomotion: ***P=1.44 × 10⁻⁴, NS P=0.30; EMG: NS P=0.15, NS P=0.36; Wilcoxon test).
Figure 3.
Figure 3.. Locomotion-Dependent Activity in SST and PV Interneurons During TEC Learning.
a. Mean signal traces of somatostatin interneurons (SST) during resting and running trials (left and middle top). The corresponding heatmap of mean locomotion is presented below (left and middle bottom), along with comparisons on the right at the habituation stage. Data are expressed as mean ± s.e.m., with shaded areas indicating s.e.m. b. Same as (a) but at the naive stage. c. Same as (a) but at the expert stage. e. Mean signal traces of parvalbumin interneurons (PV) during resting and running trials (left and middle top), with the corresponding heatmap of mean locomotion presented below (left and middle bottom) and comparisons on the right at the habituation stage. Data are shown as mean ± s.e.m., with shaded areas indicating s.e.m. f. Same as (e) but at the naive stage. g. Same as (e) but at the expert stage.
Figure 4.
Figure 4.. Blocking nAChRs Increases EMG- and Locomotion-Related Activity in SST Interneurons.
a. Heat maps of GCaMP6s signals (Δf/f) for somatostatin interneurons (SST) during training sessions 1–5 in control (saline) and mecamylamine (MEC)-treated conditions. b. Mean signal traces of SST in saline and MEC sessions. Data are shown as mean ± s.e.m., with shaded areas indicating s.e.m. c & d. Response after conditioned stimulus (CS) delivery (CR, solid line, activity in CS-window) and response after unconditioned stimulus (US) delivery (UR, dashed line, activity in US-window) of SST in saline and MEC-treated sessions. f. Mean signal traces of SST during resting and running trials (left and middle top) in saline-treated sessions, with corresponding heatmaps of mean locomotion (left and middle bottom) and comparisons (right). Data are shown as mean ± s.e.m., with shaded areas indicating s.e.m. g. Same as (f) but for MEC-treated sessions.
Figure 5.
Figure 5.. Blocking nAChRs Increases Locomotion-Modulated Activity in PV Interneurons.
a. Heat maps of GCaMP6s signals (Δf/f) for parvalbumin interneurons (PV) during training sessions 1–5 in control (saline) and mecamylamine (MEC)-treated conditions. b. Mean signal traces of PV in saline and MEC sessions. Data are shown as mean ± s.e.m., with shaded areas indicating s.e.m. c & d. Response after conditioned stimulus (CS) delivery (CR, solid line, activity in CS-window) and response after unconditioned stimulus (US) delivery (UR, dashed line, activity in US-window) of PV in saline and MEC-treated sessions. f. Mean signal traces of PV during resting and running trials (left and middle top) in saline-treated sessions, with corresponding heatmaps of mean locomotion (left and middle bottom) and comparisons (right). Data are shown as mean ± s.e.m., with shaded areas indicating s.e.m. g. Same as (f) but for MEC-treated sessions.

Similar articles

References

    1. Ayaz A., Stauble A., Hamada M., Wulf M. A., Saleem A. B. and Helmchen F. (2019). Layer-specific integration of locomotion and sensory information in mouse barrel cortex. Nat Commun, 10, 2585. - PMC - PubMed
    1. Cheng D. T., Disterhoft J. F., Power J. M., Ellis D. A. and Desmond J. E. (2008). Neural substrates underlying human delay and trace eyeblink conditioning. Proc Natl Acad Sci U S A, 105, 8108–8113. - PMC - PubMed
    1. Christian K. M. and Thompson R. F. (2005). Long-term storage of an associative memory trace in the cerebellum. Behav Neurosci, 119, 526–537. - PubMed
    1. Dai J. and Sun Q. Q. (2024). Modulation of cortical representations of sensory and contextual information underlies aversive associative learning. Cell Rep, 43, 114672. - PMC - PubMed
    1. Del Rosario J., Coletta S., Kim S. H., Mobille Z., Peelman K., Williams B., Otsuki A. J., Del Castillo Valerio A., Worden K., Blanpain L. T., Lovell L., Choi H. and Haider B. (2025). Lateral inhibition in V1 controls neural and perceptual contrast sensitivity. Nat Neurosci. - PubMed

Publication types

LinkOut - more resources