[Preprint]. 2025 Mar 24:2025.03.23.644697.
doi: 10.1101/2025.03.23.644697.

Human Body Single-Cell Atlas of 3D Genome Organization and DNA Methylation

Affiliations

Human Body Single-Cell Atlas of 3D Genome Organization and DNA Methylation

Jingtian Zhou et al. bioRxiv. .

Abstract

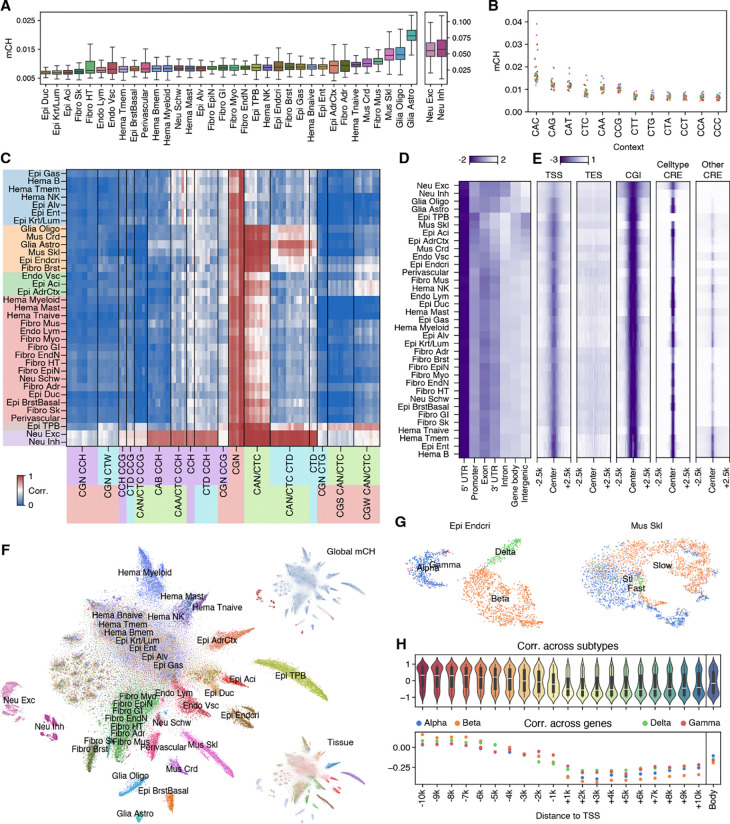
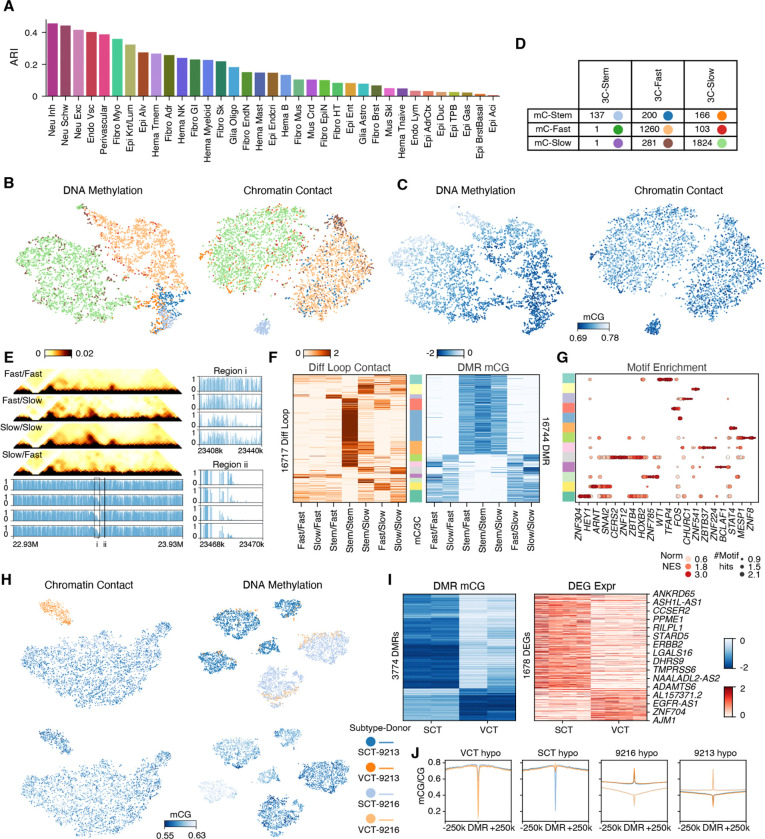
Higher-order chromatin structure and DNA methylation are critical for gene regulation, but how these vary across the human body remains unclear. We performed multi-omic profiling of 3D genome structure and DNA methylation for 86,689 single nuclei across 16 human tissues, identifying 35 major and 206 cell subtypes. We revealed extensive changes in CG and non-CG methylation across almost all cell types and characterized 3D chromatin structure at an unprecedented cellular resolution. Intriguingly, extensive discrepancies exist between cell types delineated by DNA methylation and genome structure, indicating that the role of distinct epigenomic features in maintaining cell identity may vary by lineage. This study expands our understanding of the diversity of DNA methylation and chromatin structure and offers an extensive reference for exploring gene regulation in human health and disease.


Conflict of interest statement

Competing interests: J.R.E. is a scientific adviser for Zymo Research Inc., Ionis Pharmaceuticals, and Guardant Health. B.R. is a cofounder and consultant for Arima Genomics Inc. and cofounder of Epigenome Technologies. M.P.S. is a co-founder and the scientific advisory board member of Personalis, SensOmics, Qbio, January AI, Fodsel, Filtricine, Protos, RTHM, Iollo, Marble Therapeutics, Crosshair Therapeutics, NextThought and Mirvie. He is a scientific advisor of Jupiter, Neuvivo, Swaza, Mitrix, Yuvan, TranscribeGlass, Applied Cognition.

Figures

Fig. 1.
Fig. 1.. Single-cell atlas of human DNA methylation and 3D genome structure.
(A) Schematic showing 16 human tissues profiled by the snm3C-seq assay. Below each tissue are the number of single cells passing quality control filters. Each tissue is assigned a specific color that is used throughout the manuscript. (B) Workflow diagram of the snm3C-seq assay. (C) Browser shot of DNA methylation and chromatin contacts in Myeloid (Hema Myeloid) or T-memory cells (Hema Tmem) after clustering and merging single cells into pseudobulk cell types. (D) t-distributed Stochastic Neighbor Embedding (t-SNE) of all single cells (n=86,689) using either CpG cytosine methylation (mCG, left) or chromatin contact (right) data colored by major types. The same color palette is used for major types throughout the manuscript. (E) The proportion of cells derived from each tissue for the 35 major cell types. The colors for each tissue are labeled in panel A. (F) Dendrogram of major cell types (top) and subtypes (bottom). The x-axis coordinate of each major type is manually aligned to the center of the highest branch in the subtype dendrogram of the major type.
Fig. 2.
Fig. 2.. CpG methylation across cell types.
(A) Boxplot showing the distribution of average genome wide mCG of single cells grouped by major types. For all box plots throughout the manuscript, the center line denotes the median; box limits denote first and third quartiles; and whiskers denote 1.5 × the interquartile range. (B) The distribution of mCG of individual CpGs in each major type. (C) Genome browser views of mCG at chr2:70,000,000–88,000,000 showing the presence of partially methylated domains (PMDs). (D) Distribution of mCG in trophoblast epithelial cells (Epi TPB, top) or memory B-cells (Hema Bmem, bottom) throughout the genome using varying bin sizes over all CpGs (left), CpGs within regions called as PMDs (middle), and CpGs in non-PMD regions (right) based on assigning regions into DNA methylation compartments. (E) Distribution of mCG over CpGs for 10kb bins (row) ordered by methylation compartments. Color bars from top to bottom: fully unmethylated, bimodal, partially methylated, and fully methylated. The same color palette is used for methylation compartments throughout the manuscript. (F) Fraction of the genome associated with each methylation compartment for all 10kb bins (top), transcription start sites (TSS - middle), or candidate cis-regulatory elements (cCREs - bottom). (G-J) Fraction of genes associated with each methylation compartment (G and I) or gene body mCG (H and J) in memory (Hema Bmem) or naive (Hema Bnaive) B cells stratified by gene expression level (G and H) or fold-change between Naive and Memory B cells (I and J). (K) Overlap between all DMRs from this study and DMRs from Schultz et al. 2015. (L) Overlap between DMRs identified in this study and previous scATAC-seq peaks from matching cell types. Of note, this DMR set excludes trophoblast and Naive B cells because of a lack of matching ATAC-seq. (M) Enrichment of selected transcription factor (TF) binding motifs in major cell types for non-peak DMRs (left) and peak DMRs (right). Normalized enrichment scores (NES) are row-wise Z-scored. (N) t-SNE of downsampled cells (n=26,423) using mCG at DNA transposon (left) and long terminal repeats (LTR, right) colored by major types.
Fig. 3.
Fig. 3.. Non-CpG methylation across cell types.
(A) Distribution of the average non-CG methylation (mCH) level in single cells grouped by major type. The plot is split to allow for the scale to show both neuronal (far right panels) and non-neuronal cell types. (B) Average mCH of major cell types excluding neuronal cells grouped by trinucleotide context. (C) Correlation of mC between pairwise trinucleotide contexts across 50kb bins in each cell type. Colors show major type grouping (y-axis) or category of trinucleotide contexts (x-axis). (D) mCH at different genomic features across major cell types. Values are row-wise Z-scored. (E) mCH surrounding different elements. Values are row-wise Z-scored across all five plots together. The last two columns show ATAC-seq defined cCREs present in the given cell type or cCREs remaining after excluding the cCREs of the cell type from cCREs of all cell types. (F) t-SNE of all cells (n=86,689) using mCH colored by major types (center), global mCH (top right), or tissue source (bottom right). (G) t-SNE of endocrine pancreas epithelial cells (Epi Endocri; n=2,324; left) or skeletal muscle cells (Mus Skl; n=3,973; right) using mCH colored by subtypes. (H) Correlations between mCH and expression of differentially expressed genes (DEGs) in Epi Endcri across subtypes for all DEGs (top) or across all DEGs for each cell subtype (bottom). The correlations are calculated using mCH of regions from TSS to different distances on each side of TSS (x-axis) or across the entire gene body (right).
Fig. 4.
Fig. 4.. Chromatin contacts across cell types.
(A) Distribution of contact distances (y-axis) across single cells (n=86,689; x-axis) grouped by major types. (B) Ratio of short (200kb-2Mb) to long (10–100Mb) range chromatin contacts among major cell types. Order and labels are the same between (A) and (B). (C) Proportion of short (top) or long (bottom) range contacts stratified by the differences (left) or sums (right) of compartment scores at the two interacting regions. (D) Distribution of loop lengths by major cell type. (E) Interaction strength of differential loops between major types (left) and the compartment scores of loop anchors (right) across major types. Both values are row-wise Z-scored. Colorbar (middle) shows k-means clusters of differential loops. (F) Browser shot showing subtype specific chromatin loops in breast epithelial cells (Luminal hormone sensitive - LHS; Luminal secretory precursor - LSP; Basal myoepithelial - Basal) at chr3:7,800,000–9,800,000 surrounding basal cell marker OXTR. (G) Expression level of DEGs whose TSSs are within 2kb of either anchor of the differential loops (left) and interaction strength of differential loops between breast epithelial subtypes (right) across cell types-samples. Values are row-wise Z-scored. Left and right heatmaps share the row orders. When a loop overlaps multiple genes, the loop is repeated in the left heatmap, and vice versa for a gene overlapping multiple loops.
Fig. 5.
Fig. 5.. Comparison of DNA methylation and 3D genome structure across cell types.
(A,B) Correlation between chromatin compartments and mCG (A) or mCH (B) across 100kb bins for all major cell types. (C,D) From top to bottom: correlation matrix of distance normalized contact maps of Hema Tmem, compartment score at 100kb resolution, distribution of mCG of individual CpG, methylation compartment, and mCG at 10kb resolution for whole chr2 (C) or chr2:167,000,000–177,000,000 (D). (E) Chromatin compartment score (left) and proportion of partially methylated compartment (right; materials and methods) at 100kb resolution across major types. Neurons and glia in the cortex show weak correlations between the two scores and are not shown. (F,G) mCG (F) or mCH (G) surrounding chromatin domain boundaries that separates A/B compartments (left) or not (right). (H) Enrichment of motifs at loop DMRs versus non-loop DMRs for each major type. The hue represents log2 fold change of proportion of motif-containing DMRs. (I) Distribution of correlations between DMRs and differential loops across cell clusters within each major type.
Fig. 6.
Fig. 6.. Differences between DNA methylation and 3D genome architecture defined cell types.
(A) Adjusted Rand Index (ARI) quantifying the consistency between mCG and chromatin contact based clustering of each major type into cell subtypes. Higher ARI corresponds to greater agreement in clusters. (B,C) t-SNE of Mus Skl (n=3,973) using mCG (left) or chromatin contact (right) colored by cell groups (B) or global mCG (C). (D) Confusion matrix of subtypes defined with mCG (mC-) versus chromatin contacts (3C-). Cell group colors are shared in (C) and (D). (E) Browser shot of chromatin contacts and mCG with the same cell group orders at chr14:22,930,000–23,930,000 (left) surrounding slow twitch fiber marker MYH7 and zoomed-in view of DMRs (right) of the regions in the boxes. (F) Interaction strength of differential loops between cell groups (left) and mCG of DMRs at either anchor of the differential loops (right) across cell groups. Values are Z-score normalized within each row. Colorbar (middle) shows k-means clusters of loop-DMR pairs. (G) Motif enrichment of DMRs in each group of loop-DMR pairs in (F). (H) t-SNE of Epi-TPB (n=5,228) using chromatin contact (left) or DNA methylation (right) colored by subtypes-donors (Villous cytotrophoblast - VCT; syncytiotrophoblast - SCT; top) or global mCG (bottom). (I) mCG of DMRs between subtypes (left) and expression of DEGs whose TSSs are within 2kb of DMRs (right) across subtypes-donors. Values are row-wise Z-scored. (J) mCG in subtypes-donors at flanking regions of subtype DMRs (left) or donor DMRs (right). Colors are shared between (H) and (J).

Similar articles

  • Single-cell DNA Methylome and 3D Multi-omic Atlas of the Adult Mouse Brain.
    Liu H, Zeng Q, Zhou J, Bartlett A, Wang BA, Berube P, Tian W, Kenworthy M, Altshul J, Nery JR, Chen H, Castanon RG, Zu S, Li YE, Lucero J, Osteen JK, Pinto-Duarte A, Lee J, Rink J, Cho S, Emerson N, Nunn M, O'Connor C, Yao Z, Smith KA, Tasic B, Zeng H, Luo C, Dixon JR, Ren B, Behrens MM, Ecker JR. Liu H, et al. bioRxiv [Preprint]. 2023 Apr 18:2023.04.16.536509. doi: 10.1101/2023.04.16.536509. bioRxiv. 2023. Update in: Nature. 2023 Dec;624(7991):366-377. doi: 10.1038/s41586-023-06805-y. PMID: 37131654 Free PMC article. Updated. Preprint.
  • DNA methylation atlas of the mouse brain at single-cell resolution.
    Liu H, Zhou J, Tian W, Luo C, Bartlett A, Aldridge A, Lucero J, Osteen JK, Nery JR, Chen H, Rivkin A, Castanon RG, Clock B, Li YE, Hou X, Poirion OB, Preissl S, Pinto-Duarte A, O'Connor C, Boggeman L, Fitzpatrick C, Nunn M, Mukamel EA, Zhang Z, Callaway EM, Ren B, Dixon JR, Behrens MM, Ecker JR. Liu H, et al. Nature. 2021 Oct;598(7879):120-128. doi: 10.1038/s41586-020-03182-8. Epub 2021 Oct 6. Nature. 2021. PMID: 34616061 Free PMC article.
  • Single-cell DNA methylome and 3D multi-omic atlas of the adult mouse brain.
    Liu H, Zeng Q, Zhou J, Bartlett A, Wang BA, Berube P, Tian W, Kenworthy M, Altshul J, Nery JR, Chen H, Castanon RG, Zu S, Li YE, Lucero J, Osteen JK, Pinto-Duarte A, Lee J, Rink J, Cho S, Emerson N, Nunn M, O'Connor C, Wu Z, Stoica I, Yao Z, Smith KA, Tasic B, Luo C, Dixon JR, Zeng H, Ren B, Behrens MM, Ecker JR. Liu H, et al. Nature. 2023 Dec;624(7991):366-377. doi: 10.1038/s41586-023-06805-y. Epub 2023 Dec 13. Nature. 2023. PMID: 38092913 Free PMC article.
  • Epigenomic and enhancer dysregulation in uterine leiomyomas.
    Mlodawska OW, Saini P, Parker JB, Wei JJ, Bulun SE, Simon MA, Chakravarti D. Mlodawska OW, et al. Hum Reprod Update. 2022 Jun 30;28(4):518-547. doi: 10.1093/humupd/dmac008. Hum Reprod Update. 2022. PMID: 35199155 Free PMC article. Review.
  • Genome-wide epigenomic profiling for biomarker discovery.
    Dirks RA, Stunnenberg HG, Marks H. Dirks RA, et al. Clin Epigenetics. 2016 Nov 21;8:122. doi: 10.1186/s13148-016-0284-4. eCollection 2016. Clin Epigenetics. 2016. PMID: 27895806 Free PMC article. Review.

References

    1. Allis C. D., Jenuwein T., The molecular hallmarks of epigenetic control. Nat. Rev. Genet. 17, 487–500 (2016). - PubMed
    1. Tang F., Barbacioru C., Wang Y., Nordman E., Lee C., Xu N., Wang X., Bodeau J., Tuch B. B., Siddiqui A., Lao K., Surani M. A., mRNA-Seq whole-transcriptome analysis of a single cell. Nat. Methods 6, 377–382 (2009). - PubMed
    1. Buenrostro J. D., Wu B., Litzenburger U. M., Ruff D., Gonzales M. L., Snyder M. P., Chang H. Y., Greenleaf W. J., Single-cell chromatin accessibility reveals principles of regulatory variation. Nature 523, 486–490 (2015). - PMC - PubMed
    1. Cusanovich D. A., Daza R., Adey A., Pliner H. A., Christiansen L., Gunderson K. L., Steemers F. J., Trapnell C., Shendure J., Multiplex single cell profiling of chromatin accessibility by combinatorial cellular indexing. Science 348, 910–914 (2015). - PMC - PubMed
    1. Kaya-Okur H. S., Wu S. J., Codomo C. A., Pledger E. S., Bryson T. D., Henikoff J. G., Ahmad K., Henikoff S., CUT&Tag for efficient epigenomic profiling of small samples and single cells. Nat. Commun. 10, 1–10 (2019). - PMC - PubMed

Publication types

LinkOut - more resources