[Preprint]. 2025 Mar 24:2025.03.22.644756.
doi: 10.1101/2025.03.22.644756.

Rewired m6A methylation of promoter antisense RNAs in Alzheimer's disease regulates global gene transcription in the 3D nucleome

Affiliations

Rewired m6A methylation of promoter antisense RNAs in Alzheimer's disease regulates global gene transcription in the 3D nucleome

Benxia Hu et al. bioRxiv. .

Update in

Abstract

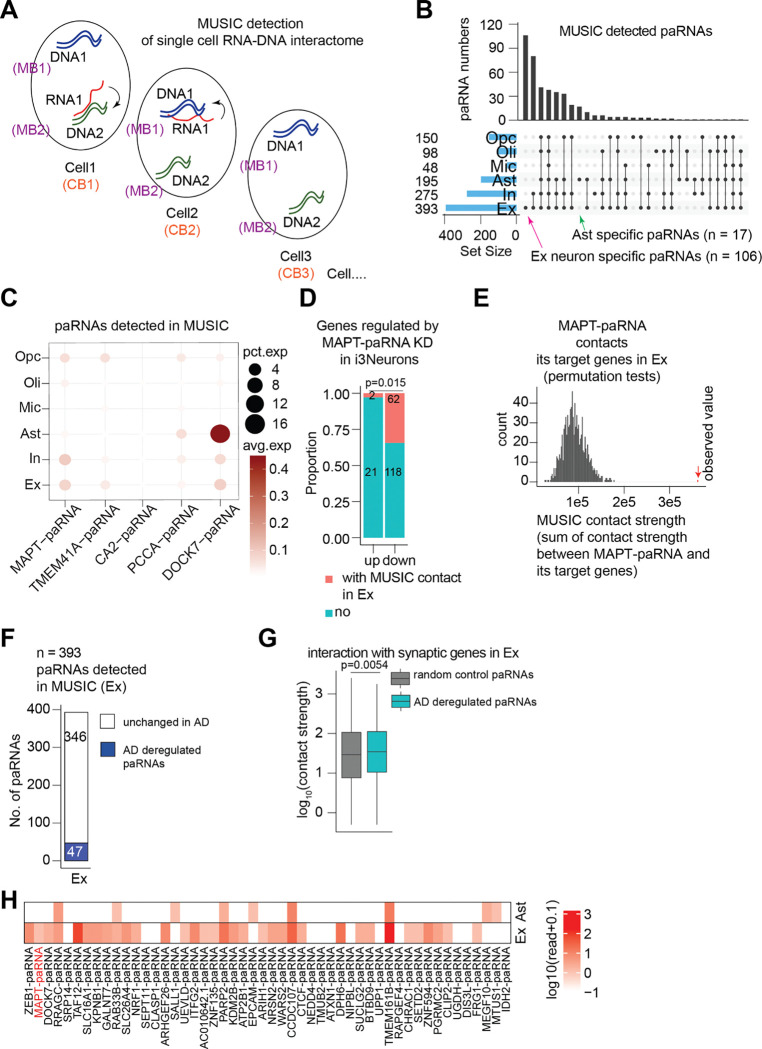
N6-methyladenosine (m6A) is the most prevalent internal RNA modification that can impact mRNA expression post-transcriptionally. Recent progress indicates that m6A also acts on nuclear or chromatin-associated RNAs to impact transcriptional and epigenetic processes. However, the landscapes and functional roles of m6A in human brains and neurodegenerative diseases, including Alzheimer's disease (AD), have been under-explored. Here, we examined RNA m6A methylome using total RNA-seq and meRIP-seq in middle frontal cortex tissues of post-mortem human brains from individuals with AD and age-matched counterparts. Our results revealed AD-associated alteration of m6A methylation on both mRNAs and various noncoding RNAs. Notably, a series of promoter antisense RNAs (paRNAs) displayed cell-type-specific expression and changes in AD, including one produced adjacent to the MAPT locus that encodes the Tau protein. We found that MAPT-paRNA is enriched in neurons, and m6A positively controls its expression. In iPSC-derived human excitatory neurons, MAPT-paRNA promotes expression of hundreds of genes related to neuronal and synaptic functions, including a key AD resilience gene MEF2C, and plays a neuroprotective role against excitotoxicity. By examining RNA-DNA interactome in the three-dimensional (3D) nuclei of human brains, we demonstrated that brain paRNAs can interact with both cis- and trans-chromosomal target genes to impact their transcription. These data together reveal previously unexplored landscapes and functions of noncoding RNAs and m6A methylome in brain gene regulation, neuronal survival and AD pathogenesis.


Conflict of interest statement

Declaration of interests The authors declare no competing interests.

Figures

Figure 1.
Figure 1.. m6A methylome on coding and noncoding RNAs in the mFC regions of human brains.
A. Piecharts showing the m6A peak distribution based on genomic locations in post-mortem human mFC tissues from Normal and AD donors, respectively. B. A model illustrating major categories of de novo identified transcripts, including pre-mRNAs and ncRNAs. C. A piechart showing the numbers of transcripts identified by the de novo calling. D. A barplot showing the assignment of m6A peaks to various de novo called transcripts. E. Genome browser tracks showing an example of ncRNA (a promoter antisense RNA from the SOX1 locus) having m6A peaks in human Normal and AD brains. Input and m6A represent the average signals of RNA-seq and meRIP-seq datasets in this work, respectively. The arrows indicate m6A peaks. F. Similar to E, example tracks showing intronic L1 elements overlap m6A peaks in the intron of GPHN gene. (+) and (−) indicate the Watson and Crick strands, respectively. G. A volcano plot showing differential m6A peaks between Normal and AD brains. Red and blue dots represent hyper- and hypo-methylated m6A sites in AD. H. Metaplots showing the aggregated m6A ratios of hyper- and hypo-methylated m6A sites.
Figure 2.
Figure 2.. The m6A methylation and expression of paRNAs in Normal and AD human brains.
A,B. Genome browser tracks showing the RNA-seq and m6A signals of two paRNAs (GRIN2A-paRNA and MAPT-paRNA) in the human mFC. Red arrows indicate m6A peaks. C,D. GO analyses for genes neighboring and sharing promoters with paRNAs. The red lines represent adjusted p values (p-adj) at 0.05. E. A volcano plot showing differentially expressed paRNAs between Normal and AD brains. Red and blue dots represent up-regulated and down-regulated paRNAs in AD, respectively. F. A heatmap showing z-score-transformed expression levels of differentially expressed paRNAs between Normal and AD brains from our samples, and from Nativio et al.. G,H. Cumulative distribution and boxplots of paRNA expression changes with or without hyper- and hypo-m6A. P values were calculated by a two-tailed non-parametric Wilcoxon–Mann–Whitney test. Boxplots indicate the interquartile range with the central line representing the median, and the vertical lines extending to the extreme values in the group.
Figure 3.
Figure 3.. Comparing paRNA changes in human AD versus mouse AD models or other human neurodegenerative diseases.
A. A venn diagram showing the numbers of human-mice common and species-specific paRNAs in human and mouse brains, respectively. The human data is from our current work. The mouse data is calculated from RNA-seq datasets generated in brains of a 5xFAD mouse model. Common paRNAs were defined by their production from promoters of homologous genes. B-D. Venn diagrams showing dysregulated paRNAs from human-mouse common paRNAs in either human brains or mouse models as indicated. E. An UpSet plot showing common and unique paRNAs detected in human brain RNA-seq data generated in donors bearing several neurodegenerative diseases. The datasets information and brain regions are indicated. Blue arrows point to paRNAs uniquely seen in FTD and AD. F. Venn diagrams showing the limited overlaps of upregulated and downregulated paRNAs across different neurodegenerative diseases, respectively. G. Boxplots showing the expression levels of MAPT-paRNA across different neurodegenerative diseases. FDR values were calculated by DESeq2. H. Boxplots showing the length of upregulated and downregulated paRNAs across different neurodegenerative diseases. Red and blue boxplots represent upregulated and downregulated paRNAs in each disease, respectively. P values were calculated by a two-tailed non-parametric Wilcoxon–Mann–Whitney test. In all panels, boxplots indicate the interquartile range with the central line representing the median, and the vertical lines extending to the extreme values in the group.
Figure 4.
Figure 4.. Neuron-enriched MAPT-paRNA stability control by m6A and its global regulatory functions.
A. (Left) Cartoon diagrams illustrating the differentiation of iPSC-derived brain cells (created with BioRender.com). (Right) A barplot showing the expression levels of MAPT-paRNA in various cell types. P value was calculated by a two-tailed student’s t-test. B,C. MeRIP-qPCR and RT-qPCR data showing m6A methylation and MAPT-paRNA expression with and without STM2457 treatment, respectively. D. Time course stability of MAPT-paRNA measured by RT-qPCR after transcriptional inhibition, with and without STM2457 pre-treatment for 24hr. P value was calculated by a two-tailed student’s t-test. E. A barplot showing the relative RNA expression of MAPT-paRNA quantified by RT–qPCR after scramble or targeting ASO treatment. F. A volcano plot showing differentially expressed genes after MAPT-paRNA knockdown using a targeting ASO versus the scramble ASO treatment. Red and blue dots represent upregulated and downregulated genes, respectively. G. GO analysis for the downregulated genes after MAPT-paRNA knockdown. The red line represents adjusted p values (padj) at 0.05. H. Barplots showing relative RNA expression of MEF2C, SYNGAP1, and HDAC4 quantified by RT–qPCR. P values were calculated by a two-tailed student’s t-test. I. Protein levels of MEF2C, SYNGAP1, and HDAC4 showing triplicates of Western blotting (WB) after MAPT-paRNA knockdown.
Figure 5.
Figure 5.. paRNA-DNA interaction in human brain cells revealed by MUSIC data.
A. A diagram showing RNA-DNA interaction at single-cell level in MUSIC data using cell barcodes (CB) and molecular barcodes (MB). CB is shared by all molecules in one cell, and MB is shared by all molecules in one molecular complex. B. An UpSet plot showing paRNAs and their numbers (to the left) in different cell types detected by MUSIC from Normal brain. C. A dotplot showing the average expression of the top five AD-upregulated paRNAs in MUSIC data. Ex: Excitatory neurons. In: Inhibitory neurons. Ast: Astrocyte. Mic: Microglia. Oli: Oligodendrocyte. Opc: Oligodendrocyte progenitor cell. D. A barplot showing the numbers of differentially expressed genes seen after MAPT-paRNA KD that form RNA-DNA interactions with MAPT-paRNA in the Ex neurons. P value: Fisher’s exact test. E. A barplot from permutation test showing the observed contact strength between MAPT-paRNA and its true 62 target genes (red arrow to the right) versus contact strength between MAPT-paRNA and 1000 sets of randomly selected 62 genes. F. A barplot showing the number of paRNAs detected by MUSIC data in Ex neurons and the subset that show AD-deregulation in bulk RNA-seq data in Fig.2. G. A boxplot showing the RNA-DNA contact strength between the two groups of paRNAs and synaptic genes in Ex: AD-deregulated paRNAs (n = 47 in panel F), and non-AD-deregulated paRNAs (n = 346). P value: two-tailed non-parametric Wilcoxon–Mann–Whitney test. Boxplots indicate the interquartile range with the central line representing the median, and the vertical lines extending to the extreme values in the group. H. A heatmap showing the RNA-DNA contact strength between AD-deregulated paRNAs and a single MEF2C gene detected in Ex and Ast, respectively.
Figure 6.
Figure 6.. The neuroprotective role of MATP-paRNA against excitotoxicity.
A. Schematic representation of glutamate toxicity in WTC11-derived i3Neurons. 8-week-old i3Neurons with/without MAPT-paRNA knockdown were treated with 10μM glutamate for 2 hours. PI (propidium iodide) and Hoechst 33342 were introduced to the medium to visualize dead (PI+) and total (Hochest+) cells, respectively. B. Representative images showing glutamate-induced i3Neuron cell death after MAPT-paRNA knockdown. Scale bar, 50μm. C. Quantification of apoptotic i3Neurons from panel B. D. Triplicates of western blot analysis of synaptic markers (Synapsin1 and PSD95) and glutamate receptors (GLUN1 and GLUA2) in i3Neurons after MAPT-paRNA knockdown. E. Representative images showing immunofluorescent signals of PSD95 and GluN1 at the dendrites of i3Neurons after MAPT-paRNA knockdown, showing their accumulation. Scale bar, 10μm. F. Quantitative analysis of signals in panel E. For each group, at least 15 neurons from 3 different experiments were quantified and analyzed. G. Representative NMDA current traces (left panel) and current density comparison (right panel) from i3Neurons treated with scramble control and MAPT-paRNA ASO1 (n = 23 neurons per group). H. Representative AMPA current traces (left panel) and current density comparison (right panel) from i3Neurons treated with scramble control and MAPT-paRNA ASO1 (n = 20 neurons per group). I. A model of MAPT-paRNA function, as a representative m6A-modified ncRNA in AD, in neuronal gene regulation and survival (generated by Biorender). P values: two-tailed unpaired student’s t-tests were used for C, F, G, and H.

References

    1. 2023 Alzheimer’s disease facts and figures. (2023). Alzheimers Dement 19, 1598–1695. 10.1002/alz.13016. - DOI - PubMed
    1. Knopman D.S., Amieva H., Petersen R.C., Chetelat G., Holtzman D.M., Hyman B.T., Nixon R.A., and Jones D.T. (2021). Alzheimer disease. Nat Rev Dis Primers 7, 33. 10.1038/s41572-021-00269-y. - DOI - PMC - PubMed
    1. DeTure M.A., and Dickson D.W. (2019). The neuropathological diagnosis of Alzheimer’s disease. Mol Neurodegener 14, 32. 10.1186/s13024-019-0333-5. - DOI - PMC - PubMed
    1. Nachtergaele S., and He C. (2018). Chemical Modifications in the Life of an mRNA Transcript. Annu Rev Genet 52, 349–372. 10.1146/annurev-genet-120417-031522. - DOI - PMC - PubMed
    1. Zaccara S., Ries R.J., and Jaffrey S.R. (2019). Reading, writing and erasing mRNA methylation. Nat Rev Mol Cell Biol 20, 608–624. 10.1038/s41580-019-0168-5. - DOI - PubMed

Publication types

LinkOut - more resources