[Preprint]. 2025 Mar 25:2025.03.22.644466.
doi: 10.1101/2025.03.22.644466.

Optoretinography reveals rapid rod photoreceptor movement upon photoisomerization

Affiliations

Optoretinography reveals rapid rod photoreceptor movement upon photoisomerization

Huakun Li et al. bioRxiv. .

Abstract

Rod photoreceptors are essential for vision under dim light conditions. The onset of rod-mediated vision is marked by the isomerization of rhodopsin. Here we demonstrate that human and rodent rods undergo a minute and rapid contraction of their outer segments immediately upon photoisomerization. The contraction is explained as an electro-mechanical manifestation of the rod early receptor potential generated in the disk membranes, which is challenging to access in electrophysiology. The bleach-strength dependence of the contraction was accounted by a voltage-dependent membrane tension model, developed earlier to explain a similar behavior in cones. The in vivo optical imaging of light-evoked electrical activity in rodent rods was facilitated by an ultrahigh-resolution point-scan optical coherence tomography (OCT) system coupled with unsupervised learning, while in humans, an adaptive optics line-scan OCT facilitated high-speed recordings in individual rods. The non-invasive in vivo optical imaging of rhodopsin activation will have a significant impact on diagnostics and treatment of retinal disease, especially given the vulnerability of rods in inherited and age-related macular degeneration.


Figures

Figure 1.
Figure 1.
Multilayered outer retinal dynamics in response to a strong bleaching stimulus (5 ms, wavelength 505 nm, 34.0% bleach) recorded using phase-resolved OCT. (A) A representative structural image of a wild-type rat retina captured by the ultrahigh-resolution OCT. Scale bar: 100 μm. ELM: external limiting membrane; IS/OS: inner segment/outer segment junction; OS: outer segment; RPE: retinal pigment epithelium; BrM: Bruch’s membrane. Inset illustrates the isolation of OS tips and the RPE-BrM complex based on two decision boundaries (red and blue lines). (B) The distribution density of phase traces extracted from the composite layer that consists of OS tips, RPE and BrM, by taking IS/OS as the reference. The stimulus was delivered at t = 0 s. (C) Multilayered outer retinal dynamics in response to the visual stimulus. IS dynamics: ΔOPL between ELM and IS/OS; OS dynamics: ΔOPL between IS/OS and OS tips; SRS dynamics: ΔOPL between ELM and the RPE-BrM complex. (D) Top: An enlarged view of the initial rapid contractile response. Bottom: Time derivatives of the rapid responses. The green block represents the 5-ms visual stimulus.
Figure 2.
Figure 2.
Rapid ΔOPL in the major outer retinal layers at varying bleach levels. (A) ΔOPL measured from the ELM to the IS/OS (green), OS tips (red), and the RPE-BrM complex (blue) immediately after the 5-ms flash offset. Data points and error bars represent the mean and standard deviation respectively at a specific bleach level. (B) The rapid movement of rod IS (green stars) and OS (red dots) in response to serial flashes (5 or 7 flashes, each yielding a 47% or 34% bleach level per flash of the remaining photopigment). The flash duration and inter-flash interval were 5 ms each. Data points (5 or 7) represent the successive OS & IS movement under the two conditions. OPL: optical path length; ELM: external limiting membrane; IS/OS: inner segment/outer segment junction; IS: inner segment; OS: outer segment; RPE: retinal pigment epithelium; BrM: Bruch’s membrane.
Figure 3.
Figure 3.
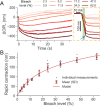
Dependence of the light-evoked rod OS dynamics on the stimulus strength. (A) Representative traces of the OS dynamics in response to flashes ranging from 2.3% to 62.6% bleach levels, with the enlarged view on the right showing an elbow point at t = 7.5 ms after the flash onset. (B) The rapid OS contraction amplitude at varying bleach levels. Black dots represent individual measurements. The red circles and error bars denote the mean values and corresponding standard deviation (SD) ranges at each bleach level, respectively. The red curve represents the prediction from the voltage-dependent membrane tension model.
Figure 4.
Figure 4.
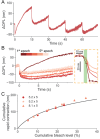
Rod OS responses evoked by 5 flashes with an inter-flash interval of 15 s. (A) Prolonged ORG recording of the rod OS responses to five flashes over 75 s, with each flash bleaching 5.2% of the remaining rhodopsins. (B) The rod OS responses extracted from each epoch were aligned to the flash onsets, with an enlarged view of the rapid OS responses shown in the dashed rectangle. (C) The cumulative rapid contraction, calculated as the sum of the rapid OS response amplitudes elicited by all flashes, was plotted against the cumulated bleach level, which represents the total percentage of rhodopsins bleached by the consecutive flashes. Dots correspond to the measurement in Fig. 4A–B, and star markers were extracted from the measurement conducted in another animal following the same protocol. Triangle markers correspond to the measurement in Supplementary Fig. 4. The black curve represents the same modeled curve in Fig. 3B.
Figure 5.
Figure 5.
ORG responses in human rod and cone OS evoked by visual stimuli at varying strengths. (A) Maximum intensity projection at rod OS tips at 10° temporal eccentricity. Scale bar: 50 µm. (B) Enlarged view of the rod OS tips (enclosed white region in Fig. 5A). The colored dots denote manually selected individual rods, with color grading indicating the ΔOPL along the rod OS. (B1) ΔOPL extracted from the volume right before the visual stimulus, (B2) ΔOPL extracted from the volume immediately post the stimulus, indicating rapid contraction, and (B3) ΔOPL averaged over a period 1.7–1.9 s after the visual stimulus, indicating late elongation. (C) Rod OS signals in response to stimuli bleaching 0.6%−39.4% rhodopsins. (D) The enlarged view of the rod OS contraction. (E) Corresponding rod OS responses extracted using an ultrafast analysis method, where temporally sub-sampling each volume into five sub-volumes along the slow scan dimension increases the sampling rate to ~200 Hz. (F) Amplitude of rapid rod OS contraction showed a logarithmic dependence on the bleach level (black curve). The individual data points were extracted from ORG signals shown in Supplementary Fig. 5. Small jitters were introduced to the horizontal axis to reduce overlap between data points. (G) Maximum intensity projection at cone OS tips from the same region as in Fig. 5A. Scale bar: 50 µm. (H) Cone OS responses extracted from the same experiment. Stimulus strengths ranged from 2.8 × 10⁵ – 2.7 × 10⁷ photons⁄µm2 , corresponding to 0.6% (light green) to 39.4% (deep green) rhodopsin bleach (see legend in Fig. 5C and Supplementary Table 4).
Figure 6.
Figure 6.
System setup and the timing diagrams for data acquisition and visual stimulation. (A) A spectral-domain point-scan OCT system (red path) was integrated with a visual stimulation channel (green path). L1-L6: doublet lenses. CL: condenser lens. GS: galvo scanner. M: mirror. (B) Protocol I: a 5-ms flash was delivered 1 s after the start of the OCT recording. (C) Protocol II: multiple 5-ms flashes were delivered at time points of 0, 10 ms, …, 10(n-1) ms, where n is the total number of flashes. (D) Protocol III: five epochs, each consisting of a 15-s recording, were captured consecutively. A 5-ms visual stimulus was delivered 1 s after the start of each epoch.

References

    1. Hofmann K. P. & Lamb T. D. Rhodopsin, light-sensor of vision. Prog. Retin. Eye Res. 93, 101116 (2023). 10.1016/j.preteyeres.2022.101116 - DOI - PubMed
    1. Arshavsky V. Y., Lamb T. D. & Edward N. Pugh J. G Proteins and Phototransduction. Annu. Rev. Physiol. 64, 153–187 (2002). 10.1146/annurev.physiol.64.082701.102229 - DOI - PubMed
    1. Hecht S., Shlaer S. & Pirenne M. H. ENERGY, QUANTA, AND VISION. J. Gen. Physiol. 25, 819–840 (1942). 10.1085/jgp.25.6.819 - DOI - PMC - PubMed
    1. Baylor D. A., Lamb T. D. & Yau K. W. Responses of retinal rods to single photons. The Journal of Physiology 288, 613–634 (1979). 10.1113/jphysiol.1979.sp012716 - DOI - PMC - PubMed
    1. Jackson G. R., Owsley C. & Curcio C. A. Photoreceptor degeneration and dysfunction in aging and age-related maculopathy. Ageing Research Reviews 1, 381–396 (2002). 10.1016/S1568-1637(02)00007-7 - DOI - PubMed

Publication types

LinkOut - more resources