[Preprint]. 2025 Mar 28:2025.03.27.645809.
doi: 10.1101/2025.03.27.645809.

Genome-wide dynamic nascent transcript profiles reveal that most paused RNA polymerases terminate

Affiliations

Genome-wide dynamic nascent transcript profiles reveal that most paused RNA polymerases terminate

Rudradeep Mukherjee et al. bioRxiv. .

Abstract

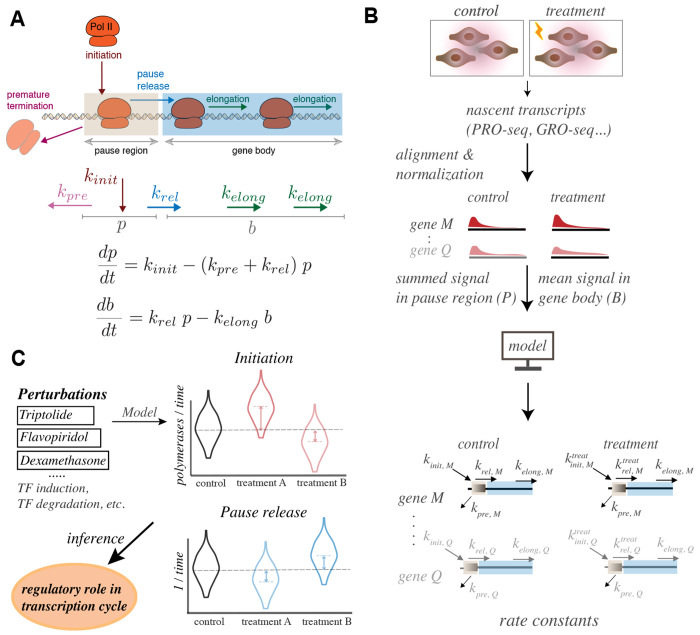
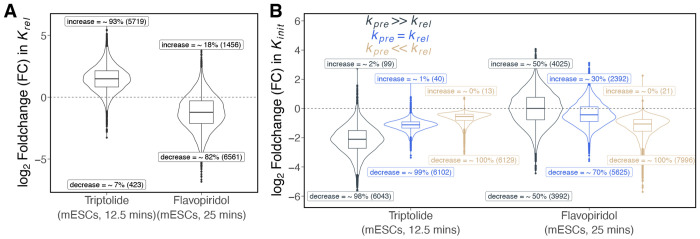
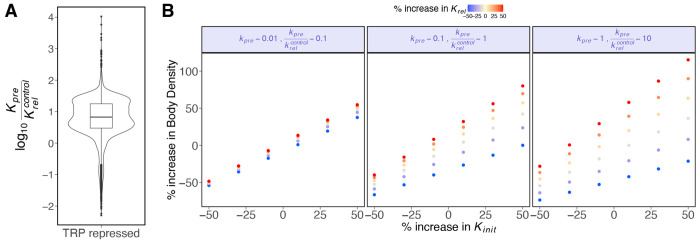
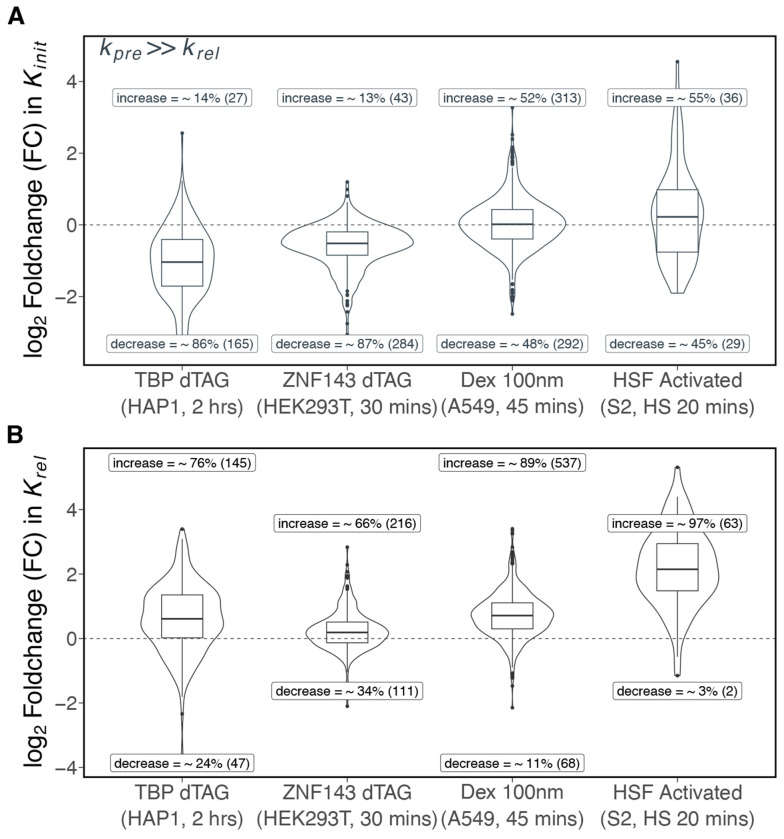
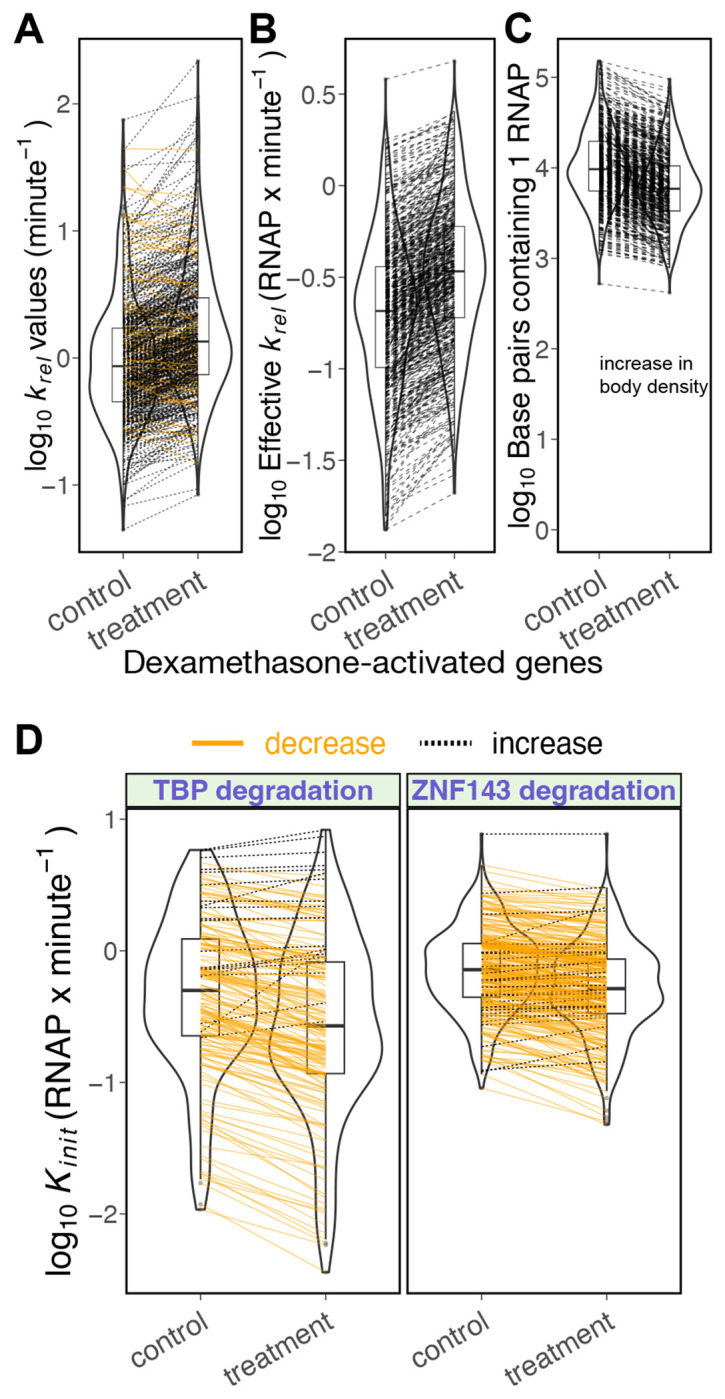
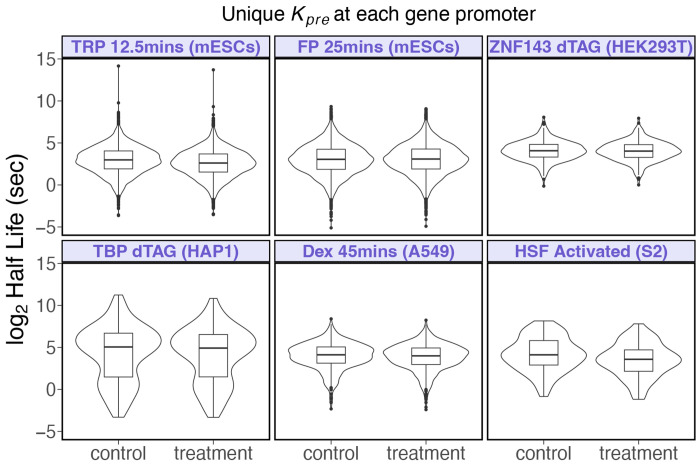
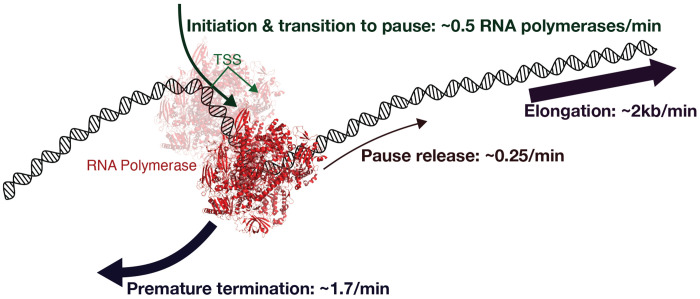
We present a simple model for analyzing and interpreting data from kinetic experiments that measure engaged RNA polymerase occupancy. The framework represents the densities of nascent transcripts within the pause region and the gene body as steady-state values determined by four key transcriptional processes: initiation, pause release, premature termination, and elongation. We validate the model's predictions using data from experiments that rapidly inhibit initiation and pause release. The model successfully classified factors based on the steps in early transcription that they regulate, confirming TBP and ZNF143 as initiation factors and HSF and GR as pause release factors. We found that most paused polymerases terminate and paused polymerases are short-lived with half lives less than a minute. We make this model available as software to serve as a quantitative tool for determining the kinetic mechanisms of transcriptional regulation.

Keywords: Compartment Model; Initiation; PRO-seq; Premature termination; Promoter-proximal pausing; Transcription regulation.


Figures

Fig. 1.
Fig. 1.. Kinetic modeling of transcription data determines the effect of treatments and perturbations.
A) A gene has two compartments in the model–the pause window (p) and the gene body (b). RNA polymerase enters the pause region with an initiation rate constant kinit, prematurely terminates with a rate constant kpre, escapes from pause region with a release rate krel, and proceeds through the gene body based on the elongation rate kelong. Herein, we assume that kpre and kelong remain constant for a gene between conditions. B) The ideal input data for the model is generated from genome-wide nascent transcriptome (PRO-seq) experiments upon acute treatment with a perturbation or stimulus. Standard methods identify differentially expressed genes and the normalized data provides densities of reads in pause and gene body compartments. The model uses these densities to infer initiation and pause release rates for input genes. C) The regulatory effects on pause release and initiation, induced by general perturbations or the acute activation/inhibition of specific transcription factors, are determined by the rate changes explained by the model.
Fig. 2.
Fig. 2.. Inhibition of initiation and pause release validate the model.
A) Flavopiridol treatment decreases pause release for ~82% of repressed genes, consistent with its known inhibitory effect on CDK9. Inspection of genes with increased pause release reveal a decrease in pause density for all genes (Fig. S3A–C). This unexpected reduction in pause density is attributed to spiky signals in the pause region or insufficient reads to accurately define the pause window (Fig. S3D–I). Triptolide increases pause release at most genes. Although this was not expected, this phenomenon could be a result of a general compensatory mechanism to increase transcription when initiation is inhibited. B) The bounds on changes in initiation rate are estimated with distinct relative values of pause release (krel) and premature termination rate (kpre) (Materials & Methods). As expected, nearly all repressed genes (>99%) decrease their initiation rate upon triptolide treatment. Flavopiridol does not show any clear effect on initiation if kprekrel, but appears inhibitory if kprekrel or kpre=krel.
Fig. 3.
Fig. 3.. Experimental data and the model equations indicate that premature termination is faster than pause release.
A) We set all TRP-repressed genes to have fold change (FC) in initiation rate (kinit) close to 0.25 (61). We calculated ratio of premature termination and pause release rates (Eq. 14). The median value of kprekrelcontrol was 6.7 with an inter-decile range of 1.2 - 30. B) Changes in pause release affect changes in body density (transcription output) when premature termination kpre is faster (kprekrel). When kpre is relatively slower than krel, change in body density is closely dependent upon changes in kinit and is minimally affected by changes in krel. As termination kpre becomes faster than pause release krel, the body density becomes dependent on changes in krel and approaches the product of changes in initiation kinit and pause release krel rates. Pausing is regulated to control expression output in metazoans (62), so these results support premature termination being faster than pause release at most genes.
Fig. 4.
Fig. 4.. Modeling kinetic PRO-seq data determines the regulatory roles of activated and degraded transcription factors.
A) Degradation of ZNF143 (44) and TBP (43) reduces initiation for approximately 90% of repressed genes in each dataset. Dexamethasone-activated genes (45) and Heat Shock Factor (HSF)-activated genes in S2 cells (33) do not show a clear direction of change in initiation rate, suggesting that Drosophila HSF and human glucocorticoid receptor (GR) may not regulate initiation. Fig. S8 contains the estimated fold change in initiation rates if premature termination is less than pause release. B) Dexamethasone (45) enhances pause release in approximately 89% of activated genes, indicating that GR’s role is to regulate pause release. In Drosophila S2 cells, HSF activates target genes by facilitating pause release. Degradation of TBP and ZNF143 tends to increase pause release for repressed genes, similar to the effect seen in repressed genes after triptolide treatment (Fig. 2.)
Fig. 5.
Fig. 5.. Rates of initiation and pause release can be estimated using steady-state densities of pause and gene body regions.
A) Assuming an elongation rate of kelong=2000bp/min, the median pause release rates of Dex-activated genes increase from 0.86 events/min (control) to 1.35 events/min. 89% of the Dex-activated genes (537 out of 605) increase their pause release rate. B) The effective pause release rate represents the release of RNA polymerase into the gene body and is calculated as the product of the pause release rate constant and the scaled pause density. The pause and body densities was transformed into occupancy levels of RNA polymerase (Fig. S1E). The median effective pause release rate for Dex-activated genes increases 1.6-fold, from 0.21 RNAP/min to 0.34 RNAP/min under treatment. All Dex-activated genes increase their effective pause release rate. C) The density in gene body increased after dexamethasone treatment with median density increasing from 1 RNAP every 9.6kb to 1 RNAP every 5.8kb. The inter-decile ranges were 1 RNAP every 3.1 kb - 36.3 kb in untreated conditions, increasing to 1 RNAP every 1.8 kb - 20.3 kb after dexamethasone treatment. D) Degradation of TBP in HAP1 cells and ZNF143 in HEK293T cells decreases the median initiation rate from 0.5 RNAP/min to 0.27 RNAP/min and 0.71 RNAP/min to 0.51 RNAP/min respectively.
Fig. 6.
Fig. 6.. Most paused polymerases turn over rapidly.
Assuming premature termination rates at each gene promoter as 6.7 times faster than pause release rates (Fig. 3A), the median half-life of paused polymerases across all datasets and treatments is 8.2 seconds, with an inter-decile range of 1.6 to 36.2 seconds. For repressed genes under triptolide treatment, the median half-life decreased from 7.9 seconds to 6.1 seconds. For HSF-activated genes, the median half-life decreased from 17.4 seconds to 12 seconds. The half-lives in other datasets showed only minor changes after treatment.
Fig. 7.
Fig. 7.. A kinetic model of initiation, termination, and early elongation.
The cartoon represents the conclusions from our modeling of kinetic nascent transcriptome data. The initiation rate of 0.5 RNA polymerases per minute assumes a non-limiting amount of RNA polymerase available to initiate. The translucent RNA polymerase represents pre-initiation or abortive initiation complexes; so the term initiation rate within our model refers to the series of events that have to occur for an RNA polymerase to successfully proceed into the pause region. The average pause release rate constant is 0.25/minute and the average termination rate of pause RNA polymerases is approximate 7 time faster at 1.7/minute. These rates are derived from well established rates of elongation (~2 kilobases/minute) averaged over a gene body, experimental triptolide efficacy data, and empirical estimates of fully occupied pause sites.

Similar articles

References

    1. Saunders A, Core LJ, Lis JT. Breaking barriers to transcription elongation. Nature reviews Molecular cell biology. 2006;7(8):557–567. - PubMed
    1. Rougvie AE, Lis JT. The RNA polymerase II molecule at the 5 end of the uninduced hsp70 gene of D. melanogaster is transcriptionally engaged. Cell. 1988;54(6):795–804. - PubMed
    1. Core LJ, Lis JT. Transcription regulation through promoter-proximal pausing of RNA polymerase II. Science. 2008;319(5871):1791–1792. - PMC - PubMed
    1. Price DH. P-TEFb, a cyclin-dependent kinase controlling elongation by RNA polymerase II. Molecular and cellular biology. 2000;. - PMC - PubMed
    1. Stein CB, Field AR, Mimoso CA, Zhao C, Huang KL, Wagner EJ, et al. Integrator endonuclease drives promoter-proximal termination at all RNA polymerase II-transcribed loci. Molecular Cell. 2022;82(22):4232–4245.e11. doi:10.1016/j.molcel.2022.10.004. - DOI - PMC - PubMed

Publication types

LinkOut - more resources