. 2025 Mar 24:13:1563353.
doi: 10.3389/fcell.2025.1563353. eCollection 2025.

Estrogen-induced FXR1 promotes endocrine resistance and bone metastasis in breast cancer via BCL2 and GPX4

Affiliations

Estrogen-induced FXR1 promotes endocrine resistance and bone metastasis in breast cancer via BCL2 and GPX4

Yinzhong Shang et al. Front Cell Dev Biol. .

Abstract

Estrogen signaling dysregulation plays a critical role in the development of anti-estrogen resistance and bone metastasis of ER+ mammary carcinoma. Using quantitative proteomic screening, we identified FXR1 as an estrogen-regulated RNA-binding protein associated with anti-estrogen resistance. Mechanistically, estrogen and IGF1 facilitate FXR1 protein translation via the PI3K/AKT/mTOR/EIF4E pathway. FXR1 enhances cellular resistance to apoptosis and ferroptosis by facilitating the maturation of BCL2 pre-mRNA and stabilizing GPX4 mRNA, respectively. Anti-estrogen resistant cells exhibit elevated FXR1 expression, and FXR1 depletion restores their sensitivity to tamoxifen. Moreover, combining FXR1 depletion with a ferroptosis inducer induces synergistic lethal in anti-estrogen resistant cells. Finally, we provide proof-of-concept evidence supporting FXR1 antagonism as a potential treatment for bone metastases in ER+ breast cancer. Our findings highlight FXR1 as a promising therapeutic target to improve existing therapeutic regimes for ER+ breast cancer patients.

Keywords: FXR1; anti-estrogen resistance; apoptosis; estrogen; ferroptosis.


Conflict of interest statement

The authors declare that the research was conducted in the absence of any commercial or financial relationships that could be construed as a potential conflict of interest.

Figures

FIGURE 1
FIGURE 1
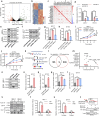
Screening of estrogen-regulated mRBPs in ER+ breast cancer. (a), The schematic of iTRAQ quantitative proteomics. MCF-7 cells were treated with 10 nM estrogen for 48 h after 6 days of estrogen deprivation. (b), Heat map representation of the 302 mRBP gene ratios (Treat/Control) in the iTRAQ quantitative proteomics. Each group represents three independent experiments. (c), The heatmap plotted the relative expression levels of 612 mRBPs in tamoxifen-resistant(R) and parental(S) MCF-7 cells. (d), Schematic diagram of 11 potential mRBPs in breast cancer. The left circle shows 100 proteins upregulated in quantitative proteomics. The right circle shows 100 genes upregulated in tamoxifen-resistant cells. (e), Kaplan–Meier plots of RFS in breast cancer patients with different levels of FXR1 expression. (f), Correlation analysis of FXR1 and ESR1 in TCGA ER+ breast cancer samples by GEPIA 2. (g, h), Kaplan–Meier plots of RFS in ER+ (g) and ER- (h) patients with different levels of FXR1 expression. (i), Expression levels of FXR1, FMR1, and FXR2 in normal tissue (n = 291) and tumor tissue (n = 1,085) were analyzed by GEPIA 2. (j), Protein levels of FXR1 in different cancers (tumor and normal samples). (k), IHC staining of FXR1 of the representative patients in breast cancer tissue microarray. Scale bar: 500 μm (5✕), 100 μm (20✕). (l), IHC H-scores of FXR1 in breast normal and tumor sections. (m), IHC H-scores of FXR1 in ER+ and ER- breast tumor sections. Results are shown as mean ± S.D. *P < 0.05; **P < 0.01; ***P < 0.001; ns not significant (Unpaired two-tailed Student’s t test).
FIGURE 2
FIGURE 2
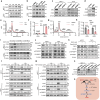
Estrogen induces FXR1 translation via eIF4E and eIF4EBP1. (a), Immunoblot assessment of FXR1 levels. Cells were treated with 10 nM estrogen for 0h, 12h, 24h and 48h. (b), Immunoblot assessment of FXR1 levels. Cells were treated with estrogen (10 nM) in combination with tamoxifen (1 μM) and fulvestrant (1 μM) for 48 h. (c), Immunoblot assessment of FXR1 and ERα levels in ESR1 depleted MCF-7 and T47D cells. (d), Immunoblot assessment of FXR1 and ERα levels in MDA-MB-231 cells with forced expression of ESR1 and control cells. (e), Representative polysome traces of MCF-7 cells in estrogen-deprived and stimulated (10 nM) conditions. Distance (mm) 10-30: mRNA ribonucleo protein (mRNP)/monosome; distance (mm) 30-50: light polysome (LMW); distance (mm) 50-70: heavy polysome (HMW). (f), Relative abundance of FXR1 mRNA in LMW or HMW shown in (e). (g), Representative polysome traces of MCF-7 cells after DMSO or fulvestrant (1 μM) treatment 48h. (h), Relative abundance of FXR1 mRNA in LMW or HMW shown in (g). (i), Immunoblot assessment of FXR1 and eIF4E levels. MCF-7 and T47D sh-Control or sh-eIF4E cell lines were treated with estrogen (10 nM) for 48 h. (j, k), Immunoblot assessment of FXR1, eIF4E, eIF4EBP1 and phosphorylated eIF4EBP1 levels. MCF-7 and T47D cells were treated with different concentrations of rapamycin (j) or combined with estrogen (k). (l, m), Immunoblot assessment of FXR1, eIF4E, eIF4EBP1 and phosphorylated eIF4EBP1 protein levels. In the presence or absence of estrogen, MCF-7, and T47D cells were treated with different concentrations of ZSTK474 (l) or AKT inhibitors (m). (n), Immunoblot assessment of FXR1 and IGF1R levels in IGF1R depleted MCF-7, T47D, and control cells. (o), Schematic diagram of the pathway that estrogen and IGF1 regulate FXR1 translation. Results are shown as mean ± S.D. *P < 0.05; **P < 0.01; ***P < 0.001; ns not significant (Unpaired two-tailed Student’s t test).
FIGURE 3
FIGURE 3
FXR1 enhances oncogenicity of breast cancer cells. (a), qPCR (n = 3 biological replicates) and immunoblot analysis of FXR1 expression in FXR1 depleted MCF-7 and control cells. (b), Foci formation assay was performed in FXR1 depleted MCF-7 and control cells. Representative images (left) and statistical analyses (right) of the colonies were shown. (c), MTT assay showing relative cell viability in FXR1 depleted MCF-7 and control cells. (d), Statistical analyses of the FXR1 depleted MCF-7 cell colonies in 3D culture and soft agar colony formation assays. (e), Early apoptotic population (FITC+/PerCP-Cy5.5-) in FXR1 depleted MCF-7 cells was determined by flow cytometry. (f), Statistical analyses of the apoptotic FXR1 depleted MCF-7, T47D, and BT474 cells by flow cytometry. (g), Immunoblot assessment of apoptosis-associated marker levels in FXR1 depleted MCF-7, T47D, and control cells. (h–k), FXR1 depleted MCF-7 and T47D cells rescued with empty vector or R-FXR1 plasmid. Immunoblot assessment of FXR1 levels (h), MTT assay showing relative cell viability (i, j), and cell apoptosis determined by flow cytometry (k). (l), Immunoblot assessment of FXR1 levels after forced expression of FXR1 MCF-7 and T47D cells. (m, n), Foci formation assay was performed in MCF-7 (m) and T47D (n) cells with forced expression of FXR1. (o, p), MTT assay showing relative cell viability in MCF-7 (o) and T47D (p) cells with forced expression of FXR1. (q), Early apoptotic population in FXR1-deleted MCF-7 and T47D cells was determined by flow cytometry. (r), MTT assay showing relative cell viability in FXR1-deletion MCF-7 and control cells. (s–u), MCF-7 cells stably expressing pLKO1 or shFXR1 plasmid were injected into nude mice (n = 8/group). Tumor size was measured starting at 7 days after injection. The tumor picture (s), tumor growth curves (t), and tumor weight (u) was shown. Results are shown as mean ± S.D. *P < 0.05; **P < 0.01; ***P < 0.001; ns not significant (Unpaired two-tailed Student’s t test in (m, n, q, u), one-way ANOVA test in (a, b, d, f, k) others two-way ANOVA test.).
FIGURE 4
FIGURE 4
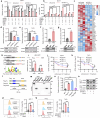
FXR1 regulates apoptosis by promoting BCL2 mRNA maturation. (a), Volcano map showing all gene expression changes in MCF-7 cells expressing shControl or shFXR1 plasmids. (b), Differential gene clustering diagram. Red indicates highly expressed genes, and blue indicates low expressed genes. (c), Heat map plots the Pearson correlation coefficient between candidate genes and ESR1 from breast cancer TCGA data. (d), qPCR analysis of BCL2 expression in FXR1 depleted cells. (e), Immunoblot assessment of FXR1 and BCL2 expression levels in FXR1 depleted cells. (f), Immunoblot assessment of BCL2 expression level in FXR1 depleted cells rescued with forced expression of BCL2. (g, h), Early apoptotic (FITC+/PerCP-Cy5.5-) population in FXR1 depleted MCF-7 (g) and BT474 (h) cells rescued with forced expression of BCL2. (i, j), MTT assay showing relative cell viability in FXR1 depleted MCF-7 (i) and BT474 (j) cells rescued with forced expression of BCL2. (k), A schematic of RNA immunoprecipitation experiment for identifying genes associated with FXR1. (l), Venn diagram of RNA-seq and RIP–seq showing that the mRNA of nine genes was bound to and upregulated by FXR1. (m), Fold enrichment of FXR1 binding peaks among nine genes in RIP experiment. (n), Immunoblot assessment of enriched FXR1 in RIP experiments performed in the cells. (o, p), qPCR analyzed the association of FXR1 with BCL2 mRNA by RIP assays in MCF-7 (o) and BT474 (p) cells. (q, r), qPCR analyzed the ratio between pre-mRNA and mature mRNA of BCL2 in FXR1 depleted MCF-7 (q) and BT474 (r) cells. (s), Immunoblot assessment of enriched FXR1 in RIP experiments performed in cytoplasmic and nuclear fractions of the cells. (t, u), qPCR analyzed the association of FXR1 with BCL2 by RIP assays in cytoplasmic and nuclear fractions of MCF-7 (t) and BT474 (u) cells. (v), Purified recombinant His–FXR1 (10 μg) was incubated with biotin–GT repeat (200 nM) for 4 h. Pull-down assays were performed with streptavidin agarose beads. Results are shown as mean ± S.D. *P < 0.05; **P < 0.01; ***P < 0.001; ns not significant (Unpaired two-tailed Student’s t test in (o, p, t, u), two-way ANOVA test in (i, j) others one-way ANOVA test).
FIGURE 5
FIGURE 5
FXR1 depletion promotes ferroptosis. (a, b), Viability of FXR1 depleted MCF-7 (a) and BT474 (b) cells treated with 5 µM Z-VAD-FMK, 1 mM 3-MA, 1 µM NEC1 or 2 µM FER1 was determined. (c–e), Lipid peroxidation was assessed by flow cytometry after C11-BODIPY staining in FXR1 depleted MCF-7 (c), BT474 (d) and T47D (e) cells. Representative flow cytometry images (left) and statistical analyses (right) were shown. (f–h), Relative GSH and GSSH levels were measured in FXR1 depleted MCF-7 (f), T47D (g) and BT474 (h) cells. (i, j), Transmission electron microscopy images show mitochondrial morphology in FXR1 depleted MCF-7 (i), BT474 (j), and control cells. White arrows indicate the mitochondria. (k–n), MTT assays detect the sensitivity of FXR1 depleted MCF-7, T47D, and control cells to erastin or RSL3. Results are shown as mean ± S.D. *P < 0.05; **P < 0.01; ***P < 0.001; ns not significant (Two-way ANOVA test in (k–n) others one-way ANOVA test.).
FIGURE 6
FIGURE 6
FXR1 interacts with the GPX4 mRNA to regulate ferroptosis. (a, b), Viability (a) and death (b) of FXR1 depleted MCF-7 cells were detected, treated with 10 µM erastin or 1 µM RSL3 combined with 2 µM FER1, 1 µM LIP1 or 5 µM DFO. (c), Heat map analysis of RNA-seq data showing mRNA expression of ferroptosis-related genes in FXR1 depleted cells compared to control cells. (d, e), qPCR (n = 3 biological replicates) and immunoblot analysis of GPX4 expression in FXR1 depleted MCF-7 (d) and T47D (e) cells. (f, g), qPCR (n = 3 biological replicates) analyzed the interaction of FXR1 with GPX4 mRNA by RIP assays in MCF-7 (f) and T47D (g) cells. (h), Schematic representation of luciferase reporter plasmids containing full-length and mutated GPX4-3′UTR (up). FXR1 recognition motif predicted by RBPsuite was shown (down). (i), Luciferase reporter plasmids were co-transfected with FXR1 expression plasmid or vector control in HEK-293T cells, and luciferase activities were determined. (j, k), FXR1 depleted MCF-7 (j) and T47D (k) cells were treated with actinomycin (d). GPX4 mRNA were examined at the indicated time points. (l), Schematic diagram of full-length and domain mutated of FXR1. (m, n), Flag-FL, Flag-KH, or Flag-RGG were transfected in HEK-293T cells for RIP assays using Flag antibody. Immunoblot (m) and qPCR (n = 3 biological replicates) (n) were performed to analyze the association of different FXR1 domains with GPX4 mRNA. (o), Immunoblot assessment of GPX4 levels in FXR1-depletion MCF-7 and T47D cells rescued with empty vector or GPX4 plasmid. (p, q), Lipid peroxidation was assessed in FXR1 depleted MCF-7 (p) and T47D (q) cells rescued with empty vector or GPX4 plasmid. Results are shown as mean ± S.D. *P < 0.05; **P < 0.01; ***P < 0.001; ns not significant (Unpaired two-tailed Student’s t test in (f, g, i), two-way ANOVA test in (j, k) others one-way ANOVA test.).
FIGURE 7
FIGURE 7
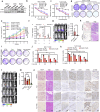
FXR1 promotes anti-estrogen resistance and bone metastasis. (a), Immunoblot assessment of FXR1 levels in TAMR, LTED and cognate parental cells. (b, c), The sensitivity of FXR1 depleted MCF-7 TAMR (b) and T47D TAMR (c) cells to tamoxifen was evaluated by MTT assays. (d), FXR1 depleted MCF-7 TAMR cells were treated with 5 µM tamoxifen, 10 µM erastin, or both, and foci formation assays were performed. (e, f), MCF-7 TAMR cells stably expressing pLKO1 or sh-FXR1 vector were injected into nude mice (n = 8/group). After the tumor size reached 150 mm3, the mice were treated with tamoxifen and IKE. Tumor growth curves (e) and tumor weight (f) are shown. (g), Representative images of bioluminescence (BLI) and micro-CT of bone metastasis through caudal artery injection of 1.5 × 10⁶ MCF-7 TAMR-shControl or -shFXR1 cells into nude mice (n = 5/group). BLI quantification of bone metastases in nude mice is shown on the right. (h), Representative immunohistochemical images of TRAP and H&E staining were taken in each group. Scale bars: 50 μm. (i), Foci formation assay was performed by using FXR1 depleted MCF-7 TAMR and T47D TAMR cells treated with 1 µM fulvestrant, 10 µM erastin, or both. (j, k), Cell viability was measured by MTT assay by using FXR1 depleted MCF-7 TAMR (j) and T47D TAMR cells (k) treated with fulvestrant and erastin. (l), Representative images of BLI and micro-CT of bone metastasis through caudal artery injection of 2 × 10⁶ MCF-7 TAMR cells into nude mice. The mice were treated with vehicle, fulvestrant, IKE, or fulvestrant + IKE. (m), BLI quantification of bone metastases in nude mice from (l). (n), Representative TRAP, H&E, and immunostaining images of FXR1, BCL2, GPX4, Ki67, TUNEL, and 4-HNE were shown from sections of (l). Scale bars: 50 µm. Results are shown as mean ± S.D. *P < 0.05; **P < 0.01; ***P < 0.001; ns not significant (Unpaired two-tailed Student’s t test in (g), two-way ANOVA test in (b, c and e) others one-way ANOVA test.).

References

    1. Barone I., Caruso A., Gelsomino L., Giordano C., Bonofiglio D., Catalano S., et al. (2022). Obesity and endocrine therapy resistance in breast cancer: mechanistic insights and perspectives. Obes. Rev. 23 (2), e13358. 10.1111/obr.13358 - DOI - PMC - PubMed
    1. Bartha Á., Győrffy B. (2021). TNMplot.com: a web Tool for the comparison of gene expression in normal, tumor and Metastatic tissues. Int. J. Mol. Sci. 22 (5), 2622. 10.3390/ijms22052622 - DOI - PMC - PubMed
    1. Chandrashekar D. S., Karthikeyan S. K., Korla P. K., Patel H., Shovon A. R., Athar M., et al. (2022). UALCAN: an update to the integrated cancer data analysis platform. Neoplasia 25, 18–27. 10.1016/j.neo.2022.01.001 - DOI - PMC - PubMed
    1. Chen F., Kang R., Tang D., Liu J. (2024). Ferroptosis: principles and significance in health and disease. J. Hematol. Oncol. 17 (1), 41. 10.1186/s13045-024-01564-3 - DOI - PMC - PubMed
    1. Chen F., Zhang Y., Chandrashekar D. S., Varambally S., Creighton C. J. (2023). Global impact of somatic structural variation on the cancer proteome. Nat. Commun. 14 (1), 5637. 10.1038/s41467-023-41374-8 - DOI - PMC - PubMed

LinkOut - more resources