. 2025 May 20;10(5):e0124824.
doi: 10.1128/msystems.01248-24. Epub 2025 Apr 8.

Altered precipitation and nighttime warming reshape the vertical distribution of soil microbial communities

Affiliations

Altered precipitation and nighttime warming reshape the vertical distribution of soil microbial communities

Suo Liu et al. mSystems. .

Abstract

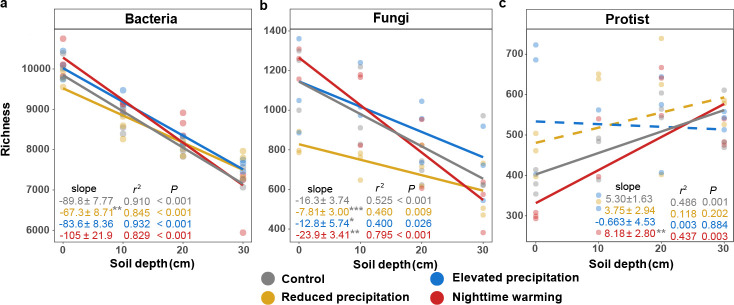
Soil depth determines microbial community composition. Yet, it remains largely unexplored how climate changes affect the vertical distribution of soil microbial communities. Here, we investigated the effects of altered precipitation and nighttime warming on microbial communities in the topsoils (0-20 cm) and subsoils (20-50 cm) of a temperate grassland in Inner Mongolia, China. As commonly observed under nutrient scarcity conditions, bacterial and fungal α-diversity and network complexity decreased with soil depth. However, protistan α-diversity and network complexity increased, which was attributed to less niche overlap and smaller body size. Strikingly, the slopes of linear regressions of microbial α-diversity/network complexity and soil depth were all reduced by altered precipitation. Microbial community composition was significantly influenced by both depth and reduced precipitation, and to a lesser extent by nighttime warming and elevated precipitation. The ribosomal RNA gene operon (rrn) copy number, a genomic proxy of bacterial nutrient demand, decreased with soil depth, and the percentages of positive network links were higher in the subsoil, supporting the "hunger game" hypothesis. Both reduced precipitation and nighttime warming decreased the rrn copy number in the subsoils while increasing the percentages of positive links, enhancing potential niche sharing among bacterial species. The stochasticity level of bacterial and fungal community assemblies decreased with soil depth, showing that depth acted as a selection force. Altered precipitation increased stochasticity, attenuating the depth's filtering effect and diminishing its linear relationship with microbial diversity. Collectively, we unveiled the predominant influence of altered precipitation in affecting the vertical distribution of soil microbial communities.IMPORTANCEUnderstanding how climate change impacts the vertical distribution of soil microbial communities is critical for predicting ecosystem responses to global environmental shifts. Soil microbial communities exhibit strong depth-related stratification, yet the effects of climate change variables, such as altered precipitation and nighttime warming, on these vertical patterns have been inadequately studied. Our research uncovers that altered precipitation disrupts the previously observed relationships between soil depth and microbial diversity, a finding that challenges traditional models of soil microbial ecology. Furthermore, our study provides experimental support for the hunger game hypothesis, highlighting that oligotrophic microbes, characterized by lower ribosomal RNA gene operon (rrn) copy numbers, are selectively favored in nutrient-poor subsoils, fostering increased microbial cooperation for resource exchange. By unraveling these complexities in soil microbial communities, our findings offer crucial insights for predicting ecosystem responses to climate change and for developing strategies to mitigate its adverse impacts.

Keywords: climate change; microbial diversity; microbial network; protistan community; vertical spatial distribution.


Conflict of interest statement

The authors declare no conflict of interest.

Figures

Fig 1
Fig 1
Changes in soil microbial richness with soil depth. (a–c) Changes in bacterial (a), fungal (b), and protistan (c) richness with soil depth under treatments or control. The slopes were determined using the linear mixed-effect model (LMM) accounting for the repeated-measure design, and r2 values were calculated, reflecting variance explained by the whole LMM model. Statistical significance was determined using Wald type II χ2 tests (n = 12). The lines show the fixed effects in the LMM, where solid lines represent the significant fixed effects, while dashed lines represent non-significant fixed effects. The slopes are presented as a coefficient in fixed effect ± standard error in random effect. The gray star or hash symbol of the slope represents the significance of the slope difference between the control and treatments, based on the standardized major axis test. The upper depth of soil layers was used for calculation. ***P < 0.001, **0.001 < P < 0.010, *0.010 < P < 0.050, #0.050 < P < 0.100.
Fig 2
Fig 2
The microbial community composition in different soil layers. (a–c) Non-metric multidimensional scaling (NMDS) ordination of changes in microbial communities with soil depth under treatments or control. The analyses were conducted based on Sorensen dissimilarity metrics for bacterial (a), fungal (b), and protistan (c) communities. All stress values associated with these ordinations are below 0.200, indicating robust ordination outputs.
Fig 3
Fig 3
Changes in microbial network with soil depth. (a–f) The linear relationship between soil depth and the network node and link number of bacterial (a and d), fungal (b and e), and protistan (c and f) under treatments or control. The slopes were determined using the linear mixed-effect model (LMM) accounting for the repeated-measure design, and r2 values were calculated, reflecting variance explained by the whole LMM model. Statistical significance was determined using Wald type II χ2 tests (n = 12). The lines show the fixed effects in the LMM, where solid lines represent the significant fixed effects, while dashed lines represent non-significant fixed effects. The slopes are presented as a coefficient in fixed effect ± standard error in random effect. The gray star or hash symbol of the slope represents the significance of the slope difference between the control and treatments, based on the standardized major axis test. The upper depth of soil layers was used for calculation. ***P < 0.001, **0.001 < P < 0.010, *0.010 < P < 0.050, #0.050 < P < 0.100.
Fig 4
Fig 4
Changes in community-level ribosomal RNA gene operon (rrn) copy number with soil depth. (a and b) Community-level rrn copy number weighted by taxon abundance (a) and unweighted by taxon abundance (b). The slopes were determined using the linear mixed-effect model (LMM) accounting for the repeated-measure design, and r2 values were calculated, reflecting variance explained by the whole LMM model. Statistical significance was determined using Wald type II χ2 tests (n = 12). The lines show the fixed effects in the LMM, where solid lines represent the significant fixed effects, while dashed lines represent non-significant fixed effects. The slopes are presented as a coefficient in fixed effect ± standard error in random effect. The gray star or hash symbol of the slope represents the significance of the slope difference between the control and treatments, based on the standardized major axis test. The slope and the standard error are multiplied by one thousand for visualization. The upper depth of soil layers was used for calculation. ***P < 0.001, **0.001 < P < 0.010, *0.010 < P < 0.050, #0.050 < P < 0.100.
Fig 5
Fig 5
Microbial community assembly. The bacterial, fungal, and protistan community assembly was based on Sorensen dissimilarity metrics. (a–c) The change of stochasticity in bacterial (a), fungal (b), and protistan (c) community assembly with soil depth based on Sorensen dissimilarity metrics under treatments and control. The slopes were determined using the linear mixed-effect model (LMM) accounting for the repeated-measure design, and r2 values were calculated, reflecting variance explained by the whole LMM model. Statistical significance was determined using Wald type II χ2 tests (n = 12). The lines show the fixed effects in the LMM, where solid lines represent the significant fixed effects, while dashed lines represent non-significant fixed effects. The slopes are presented as a coefficient in fixed effect ± standard error in random effect. The gray star or hash symbol of the slope represents the significance of the slope difference between the control and treatments, based on the standardized major axis test. The upper depth of soil layers was used for calculation. For visualization, the slope and standard error are multiplied by 1,000 for bacteria and protists and 10,000 for fungi. ***P < 0.001, **0.001 < P < 0.010, *0.010 < P < 0.050, #0.050 < P < 0.100.

Similar articles

References

    1. Stocker T, Plattner G-K, Dahe Q. The physical science basis - findings and lessons learned, p 17003
    1. Jansson JK, Hofmockel KS. 2020. Soil microbiomes and climate change. Nat Rev Microbiol 18:35–46. doi:10.1038/s41579-019-0265-7 - DOI - PubMed
    1. Cardinale BJ, Duffy JE, Gonzalez A, Hooper DU, Perrings C, Venail P, Narwani A, Mace GM, Tilman D, Wardle DA, Kinzig AP, Daily GC, Loreau M, Grace JB, Larigauderie A, Srivastava DS, Naeem S. 2012. Biodiversity loss and its impact on humanity. Nature 486:59–67. doi:10.1038/nature11148 - DOI - PubMed
    1. Bardgett RD, van der Putten WH. 2014. Belowground biodiversity and ecosystem functioning. Nature 515:505–511. doi:10.1038/nature13855 - DOI - PubMed
    1. Impa SM, Raju B, Hein NT, Sandhu J, Prasad PVV, Walia H, Jagadish SVK. 2021. High night temperature effects on wheat and rice: current status and way forward. Plant Cell Environ 44:2049–2065. doi:10.1111/pce.14028 - DOI - PubMed

LinkOut - more resources