Review
. 2025 Dec;16(1):2480633.
doi: 10.1080/21505594.2025.2480633. Epub 2025 Apr 8.

SARS-CoV-2 epidemiology, kinetics, and evolution: A narrative review

Affiliations
Review

SARS-CoV-2 epidemiology, kinetics, and evolution: A narrative review

Samuel Alizon et al. Virulence. 2025 Dec.

Abstract

Since winter 2019, SARS-CoV-2 has emerged, spread, and evolved all around the globe. We explore 4 y of evolutionary epidemiology of this virus, ranging from the applied public health challenges to the more conceptual evolutionary biology perspectives. Through this review, we first present the spread and lethality of the infections it causes, starting from its emergence in Wuhan (China) from the initial epidemics all around the world, compare the virus to other betacoronaviruses, focus on its airborne transmission, compare containment strategies ("zero-COVID" vs. "herd immunity"), explain its phylogeographical tracking, underline the importance of natural selection on the epidemics, mention its within-host population dynamics. Finally, we discuss how the pandemic has transformed (or should transform) the surveillance and prevention of viral respiratory infections and identify perspectives for the research on epidemiology of COVID-19.

Keywords: COVID-19; modelling; surveillance; variants; virulence; zoonosis.


Conflict of interest statement

No potential conflict of interest was reported by the author(s).

Figures

Figure 1.
Figure 1.
Location of the first-reported COVID-19 cases. a) Map of China and neighbouring countries. The city of Wuhan is shown within the dashed circle. b) Map of the city of Wuhan showing the huanan seafood wholesale market (pink dot) and the approximate locations of the first confirmed cases (in blue) and clinical diagnostic cases (in red). Data from page 44 of the who-convened Global Study of Origins of SARS-CoV-2 [8] and maps from OpenStreetMap® under the Open Database License.
Figure 2.
Figure 2.
Key outbreak metrics. a) Exponential growth rate (r) and doubling time (td) for new SARS-CoV-2 cases (in blue) and new deaths (in red) in France, b) Generation interval (g) and serial interval (w), and c) Individual reproduction numbers (R). d) Euler-Lotka formula to compute the R0 from the exponential growth rate r and the distribution of generation times g(a). This can be approximated to compute a temporal reproduction number R from discrete incidence data (It) and the serial intervals’ distribution w(a).
Figure 3.
Figure 3.
SARS-CoV-2 and related coronaviruses. a) Amino acid alignment of the region between the S1 and S2 subunits of the spike protein of eight coronavirus sequences. b) Maximum likelihood phylogeny using the same (whole) genomes and the first 31 sequences for SARS-CoV-2 in 2020. c) Maximum likelihood phylogeny excluding recombining regions. In panel A, all SARS-CoV-2 genomes are difficult to distinguish but all bear a polybasic cleavage site in the S gene (the “RRAR” pattern in panel A, with R and A standing for arginine and alanine respectively). A similar pattern was found only once in the wild (RmYN02 in green [33]). New coronaviruses similar to SARS-CoV-2 found in bats in Laos are in pink [34] and the RaTG13 sampled in 2013 is in red. Phylogenies in panels B and C should be interpreted with care because of the polytomies and low bootstrap values (in gray). The alignment was generated with MAFFT [35], the phylogenies with RDP4 [36], and the structure of panel a with the NCBI MSA viewer 1.25.0 at https://www.Ncbi.nlm.nih.gov/projects/msaviewer.
Figure 4.
Figure 4.
Modeling airborne transmission. Schematic of the ‘box model of infection’ developed in ref [79]. The approach considers an infected individual, I, emitting infectious particles (scaled with respect to an arbitrary quantum to be related to epidemiological data), at a basal rate E0. The viral particles spontaneously decay at a rate λd and fall on the ground at a rate λf. They can also be removed from the room through ventilation at a rate λv, or purification, at a rate λp. A susceptible individual, S, who is assumed to stand away enough from I so that only long-range transmission is possible, breathes at a basal rate B0, a concentration c of infection quanta from the room air, which is assumed to be well-mixed. The probability of infection PSI, which is equal to the expected secondary attack rate of the encounter, is given by the Wells-Riley equation (1). In the Poissonian expected value, the basal breathing and emission rates are multiplied by a relative risk factor h that depends on the circumstances of the encounter. h is proportional to the encounter duration t, filtering reduction factors induced by facemasks, fe and fi, an amplifying emission factor κe (e.g. background music or singing raise voice intensity), and an amplifying breathing factor κb (e.g. physical effort) shown in equation (2).
Figure 5.
Figure 5.
Early epidemic dynamics and excess mortality in six countries on different continents. a) Temporal dynamics of new cases and new deaths up to 20 June 2020. Note the log scale and the circular patterns: epidemic waves first generate cases and then deaths. Some countries exerted stronger control of the epidemic (bottom left corner) than others. The first wave had different timing in each country, and on the panel, some had just reached their epidemic peak. b) Excess mortality in five countries showing the difference between the reported and the expected number of deaths. For both panels, the data originates from https://ourworldindata.Org/coronavirus [32] and is smoothed over 21 d.
Figure 6.
Figure 6.
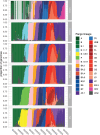
SARS-CoV-2 lineage dynamics in six key countries. Data from GISAID (https://gisaid.Org/). Colors show the main pango lineages [43].
Figure 7.
Figure 7.
Transmissibility advantage estimation the estimation of the relative transmissibility advantage (in pink) of an emerging (sub-)variant with respect to the current majority (resident) variant can be summarised by the depicted formula. Its derivation is based on nesting the replicator equation (arising e.g. From a simple dimorphic SI 2R model, without co/super-infection, i.e. only prior infection [149] within the Euler-Lotka formula. The key quantifies involved are indicated in light blue. The data required for their computation are indicated in dark blue. Hats denote estimates.
Figure 8.
Figure 8.
Genealogy of some SARS-CoV-2 lineages. Dashed lines indicate recombination events between two lineages. Figure built from the Nextstrain SVG file available at https://ncov-clades-schema.vercel.app/. For a full list of variants and interactive graph, see https://mdu-phl.Github.io/pango-watch/.

References

    1. Mayr E. Cause and effect in biology: kinds of causes, predictability, and teleology are viewed by a practicing biologist. Science. 1961;134(3489):1501–33. doi: 10.1126/science.134.3489.1501 - DOI - PubMed
    1. Otto SP, Day T, Arino J, et al. The origins and potential future of SARS-CoV-2 variants of concern in the evolving COVID-19 pandemic. Curr Biol. 2021;31(14):R918–R929. doi: 10.1016/j.cub.2021.06.049 - DOI - PMC - PubMed
    1. Koelle K, Martin MA, Antia R, et al. The changing epidemiology of SARS-CoV-2. Science. 2022;375(6585):1116–1121. doi: 10.1126/science.abm4915 - DOI - PMC - PubMed
    1. Markov PV, Ghafari M, Beer M, et al. The evolution of SARS-CoV-2. Nat Rev Microbiol. 2023;21(6):361–379. doi: 10.1038/s41579-023-00878-2 - DOI - PubMed
    1. Holmes EC. The emergence and evolution of SARS-CoV-2. Ann Rev Virol. 2024;11(1):21–42. doi: 10.1146/annurev-virology-093022-013037 - DOI - PubMed

Associated data

LinkOut - more resources