. 2025 Apr 7;23(1):283.
doi: 10.1186/s12951-025-03358-2.

An injectable multifunctional nanocomposite hydrogel promotes vascularized bone regeneration by regulating macrophages

Affiliations

An injectable multifunctional nanocomposite hydrogel promotes vascularized bone regeneration by regulating macrophages

Huaiyuan Zhang et al. J Nanobiotechnology. .

Abstract

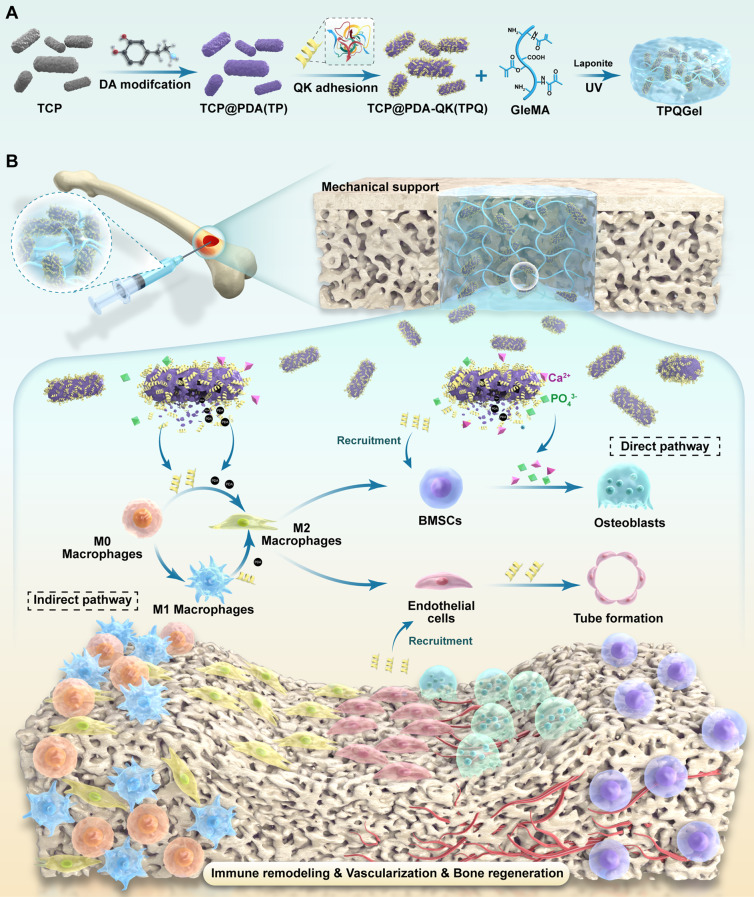
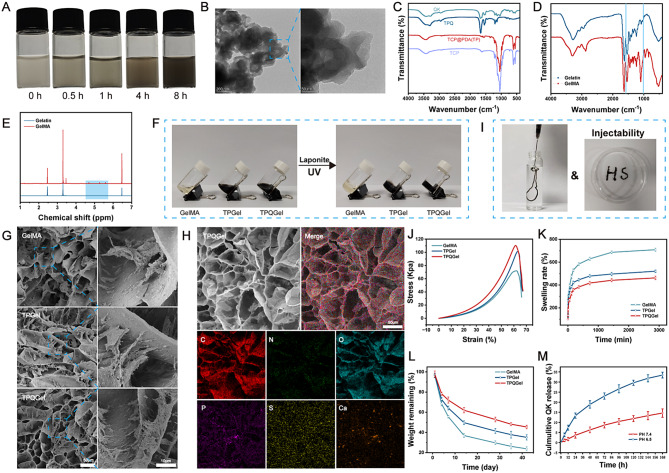
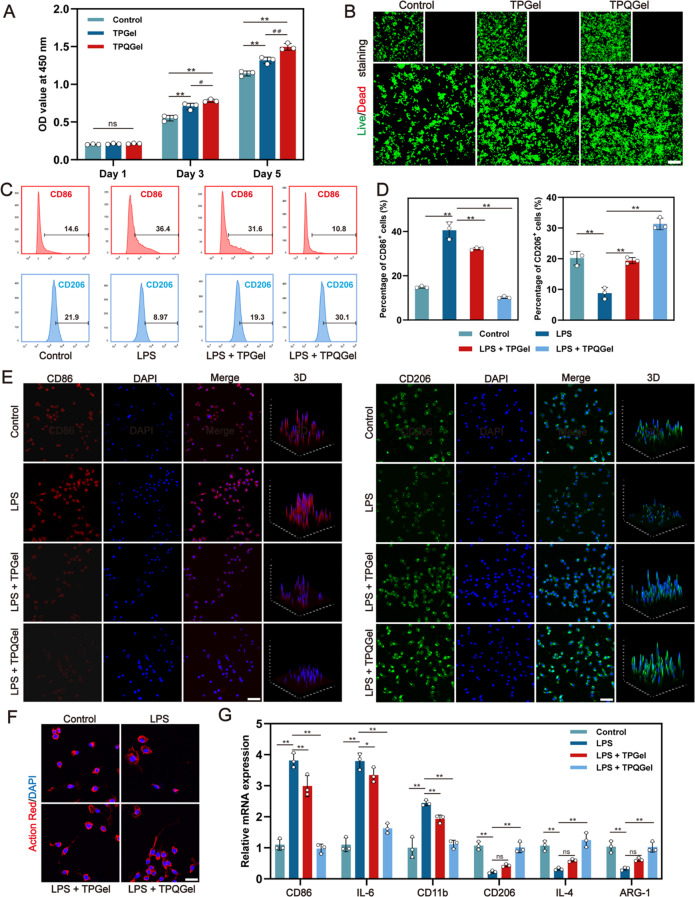
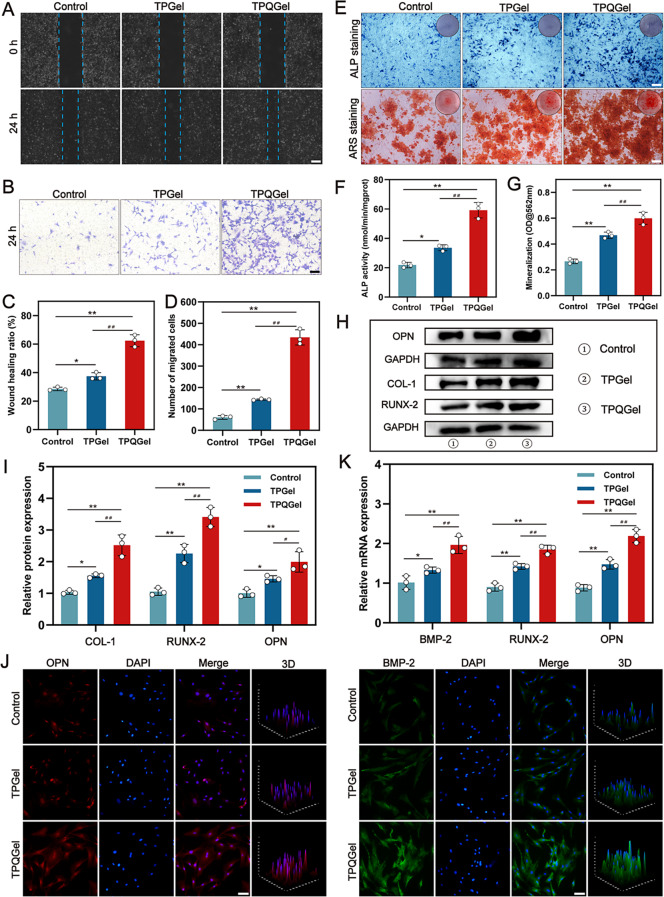
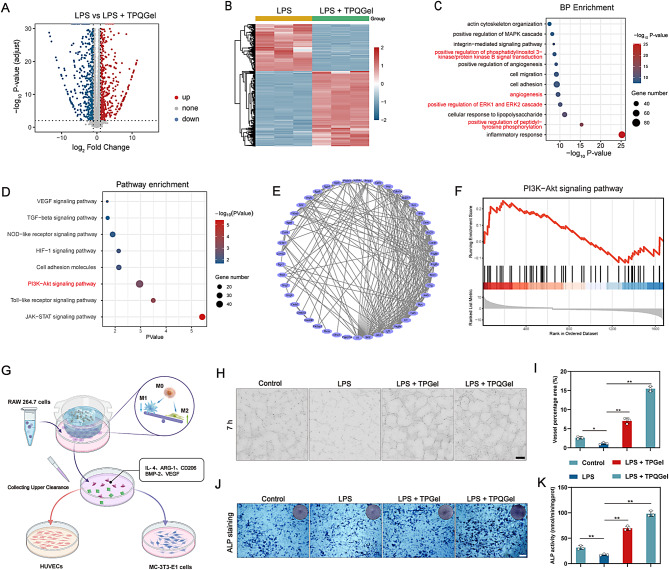
The local inflammatory microenvironment, insufficient vascularization, and inadequate bone repair materials are the three key factors that constrain the repair of bone defects. Here, we synthesized a composite nanoparticle, TPQ (TCP-PDA-QK), with a core‒shell structure. The core consists of nanotricalcium phosphate (TCP), and the shell is derived from polydopamine (PDA). The surface of the shell is modified with a vascular endothelial growth factor (VEGF) mimic peptide (QK peptide). TPQ was then embedded in porous methacrylate gelatin (GelMA) to form a TPQGel hydrogel. In the inflammatory environment, the TPQGel hydrogel can gradually release drugs through pH responsiveness, promoting M2 macrophage polarization, vascularization and bone regeneration in turn. In addition, reprogrammed M2 macrophages stimulate the generation of anti-inflammatory and pro-healing growth factors, which provide additional support for angiogenesis and bone regeneration. The TPQGel hydrogel can not only accurately fill irregular bone defects but also has excellent biocompatibility, making it highly suitable for the minimally invasive treatment of bone defects. Transcriptomic tests revealed that the TPQGel hydrogel achieved macrophage reprogramming by regulating the PI3K-AKT signalling pathway. Overall, the TPQGel hydrogel can be harnessed for safe and efficient therapeutics that accelerate the repair of bone defects.

Keywords: Bone defects; Bone regeneration; Core‒shell structure; Inflammatory microenvironment; M2 macrophage polarization; Vascularization.


Conflict of interest statement

Declarations. Ethical approval: The experimental protocol was reviewed and approved by the Animal Ethics Committee of Shanghai Public Health Clinical Center (approval number 2023-A032-01). Competing interests: The authors declare no competing interests.

Figures

Scheme 1
Scheme 1
Schematic representation of the synthesis of the TPQGel hydrogel and its therapeutic efficacy in treating bone defects. (A) Injectable TPQGel hydrogel design and preparation. (B) The TPQGel hydrogel is capable of not only precisely filling bone defects but also progressively releasing TPQ nanoparticles. The outer shell layer of PDA on the TPQ nanoparticles, along with its incorporated QK peptide, can initially engage and modulate the M2 polarization of macrophages. This interaction leads to the secretion of various pro-healing growth factors, thereby indirectly fostering vascularized bone regeneration. Additionally, the sustained release of the QK peptide also plays a role in the recruitment of stem cells and other cellular components, increasing the cell density at the injury site and accelerating the vascularized bone regeneration process. The calcium and phosphorus mineral components that are released from the degradation of TCP within the core of the TPQ nanoparticles replenish the substances depleted during bone repair, further facilitating osteogenic differentiation. Through this dual mechanism of action, the TPQGel hydrogel has emerged as a promising therapeutic approach for the treatment of bone defects.
Fig. 1
Fig. 1
Preparation and characterization of the TPQGel hydrogels. (A) Color change of the PDA solution. (B) TEM image of TCP@PDA. (C) FTIR spectra of TCP, TCP@PDA, TPQ, and QK. (D) FTIR spectra of GelMA and gelatin. (E) 1HNMR spectra of GelMA and gelatin. (F) Schematic diagram of the liquid‒solid transition of the GelMA, TPGel, and TPQGel hydrogels. (G) SEM images of the GelMA, TPGel, and TPQGel hydrogels. (H) EDS image of the TPQGel hydrogel. (J) Stress‒strain curves of the GelMA, TPGel, and TPQGel hydrogels. (K) Dissolution curves of the GelMA, TPGel, and TPQGel hydrogels. (L) Degradation curves of the GelMA, TPGel, and TPQGel hydrogels. (M) Release curves of the QK peptides from the TPQGel hydrogels
Fig. 2
Fig. 2
In vitro biocompatibility analysis of the TPGel hydrogels and TPQGel hydrogels. (A) CCK8 assay and (B) live‒dead staining of MC-3T3-E1 cells. (C) CCK8 assay and (D) live‒dead staining of HUVECs. (E) Cytoskeletal fluorescence staining for F-actin and DAPI in MC-3T3-E1 cells and (F) HUVECs. Quantitative analysis of (G) the cell density and (H) the cell spreading area of MC-3T3-E1 cells. Quantification of (I) the cell density and (J) the cell spreading area of HUVECs. Scale bars: 100 μm (B, D), 50 μm (low-magnification images in E, H), and 20 μm (high-magnification images in E, H). The data are presented as the means ± SDs (n = 3). *p < 0.05, **p < 0.01 indicate significant differences compared with the Control group. #p < 0.05, ##p < 0.01 indicate significant differences compared with the TPGel group
Fig. 3
Fig. 3
TPQGel hydrogel-mediated reprogramming of macrophages. (A) CCK8 assay and (B) live‒dead staining of RAW264.7 cells. (C) Flow cytometry analysis of CD86 and CD206 expression in RAW264.7 macrophages and (D) quantitative analysis. (E) Immunofluorescence staining of CD86 and CD206 in RAW264.7 macrophages. (F) Cytoskeletal fluorescence staining of F-actin and DAPI in RAW264.7 macrophages after different treatments. (G) Relative mRNA expression of inflammation-related genes in RAW264.7 macrophages. Scale bars: 100 μm (B), 20 μm (E), and 10 μm (F). The data are presented as the means ± SDs (n = 3). *p < 0.05, **p < 0.01 indicate significant differences compared with the Control group. ##p < 0.01 indicates significant differences compared with the TPGel group
Fig. 4
Fig. 4
The TPQGel hydrogel directly promoted angiogenesis. (A) Wound healing assay and (B) Transwell assay demonstrating the ability of the TPQGel hydrogel to promote cell migration and (C, D) quantitative analysis. (E) Schematic diagram of the effect of the TPQGel hydrogel on the angiogenic differentiation of HUVECs. (F) Vessel formation after different treatments and (G, H) quantitative analysis. (I) Relative mRNA expression of angiogenesis-related genes in HUVECs. (J) Immunofluorescence staining of CD31 and VEGF in HUVECs and (K) quantitative analysis. Scale bars: 200 μm (A, F), 100 μm (B), and 50 μm (J). The data are presented as the means ± SDs (n = 3). *p < 0.05, **p < 0.01 indicate significant differences compared with the Control group. ##p < 0.01 indicates significant differences compared with the TPGel group
Fig. 5
Fig. 5
The TPQGel hydrogel directly promoted osteogenic differentiation. (A) Wound healing assay and (B) Transwell assay demonstrating the ability of the TPQGel hydrogel to promote cell migration and (C, D) quantitative analysis. (E) Macroscopic and microscopy images of ALP staining and ARS staining of MC-3T3-E1 cells. (F) ALP activity and (G) quantitative analysis of ARS staining. (H) Western blot analysis of osteogenesis-related protein expression and (I) quantitative analysis. (J) Immunofluorescence staining of OPN and BMP-2 in MC-3T3-E1 cells. (K) RT‒qPCR analysis of osteogenesis-related protein expression. Scale bars: 200 μm (A, E), 100 μm (B), and 50 μm (J). The data are presented as the means ± SDs (n = 3). *p < 0.05, **p < 0.01 indicate significant differences compared with the Control group. #p < 0.05, ##p < 0.01 indicate significant differences compared with the TPGel group
Fig. 6
Fig. 6
Transcriptomic analysis of the mechanism of macrophage reprogramming by TPQGel hydrogels. (A) Volcano plots of the LPS group and the LPS + TPQGel group. Red represents upregulated genes, and blue represents downregulated genes. (B) Heatmap showing the overall gene expression levels in the LPS group and the LPS + TPQGel group. (C) Biological process (BP) and (D) KEGG analyses revealed potential pathways associated with the differentially expressed genes. (E) PI3K-AKT pathway gene relationship network map. (F) GSEA revealed that the number of genes enriched with the PI3K‒AKT pathway significantly increased in the LPS + TPQGel group. (G) Schematic of the effects of supernatants from RAW264.7 macrophages subjected to different treatments on angiogenesis and osteogenesis. (H) Vessel formation after supernatant treatment and (I) quantitative analysis. (J) ALP staining and (K) quantitative analysis of MC-3T3-E1 cells after supernatant treatment. Scale bars: 200 μm (H, J). The data are presented as the means ± SDs (n = 3). *p < 0.05, **p < 0.01 indicate significant differences compared with the LPS group
Fig. 7
Fig. 7
Analysis of the in vivo immunomodulation and vascular regeneration capacity of the TPQGel hydrogel. (A) (B) Construction of the bone defect model and surgical procedure. (C) Immunohistochemical staining of CD86 and CD206 expression. (D) Immunohistochemical stainin of CD31 and VEGF expression. (E) Angiogenic images of the dorsal subcutis of rats on days 5 and 10 after hydrogel injection and (F) quantitative analysis. Scale bar: 5 mm (E), 30 μm (C, D). The data are presented as the means ± SDs (n = 3). #p < 0.05, ##p < 0.01 indicates significant differences compared with the TPGel group
Fig. 8
Fig. 8
In vivo osteogenic differentiation capacity and biocompatibility analysis of the TPQGel hydrogels. (A) Representative micro-CT images of SD rat femurs and (B, C) quantitative analysis. Images were taken at week 3 and week 6 after treatment. (D) HE staining and (E) quantitative analysis at weeks 3 and 6 after treatment (black arrow: newly formed bone trabeculae. Yellow arrow: The central tube of the newborn. Arrows are only used to indicate anatomical structures and do not represent significant differences.) (F) Immunohistochemical staining of BMP-2 and OPN at week 3 after treatment and (G) quantitative analysis. (H) HE staining of the heart, liver, spleen, lung and kidney. (I) Hydrogel hemolysis assay. Scale bars: 2 mm (A), 100 μm (H), and 30 μm (D, F). The data are presented as the means ± SDs (n = 3). *p < 0.05, **p < 0.01 indicate significant differences compared with the Control group. ##p < 0.01 indicates significant differences compared with the TPGel group

References

    1. Sun L, Niu H, Wu Y, Dong S, Li X, Kim BYS, Liu C, Ma Y, Jiang W, Yuan Y. Bio-integrated scaffold facilitates large bone regeneration dominated by endochondral ossification. Bioactive Mater. 2024;35:208–27. 10.1016/j.bioactmat.2024.01.019. - PMC - PubMed
    1. Wu M, Liu H, Zhu Y, Chen F, Chen Z, Guo L, Wu P, Li G, Zhang C, Wei R, et al. Mild Photothermal-Stimulation based on injectable and photocurable hydrogels orchestrates Immunomodulation and osteogenesis for High‐Performance bone regeneration. Small. 2023;19. 10.1002/smll.202300111. - PubMed
    1. Liu Q, Zhang S, Shi L, Shi J, Sun C, Wang J, Zhou W, Zhou H, Shan F, Wang H, et al. Osteogenic induction and Anti-Inflammatory effects of Calcium‐Chlorogenic acid nanoparticles remodel the osteoimmunology microenvironment for accelerating bone repair. Adv Healthc Mater. 2024;13. 10.1002/adhm.202401114. - PubMed
    1. Han S, Yang H, Ni X, Deng Y, Li Z, Xing X, Du M. Programmed release of vascular endothelial growth factor and exosome from injectable Chitosan nanofibrous microsphere-based PLGA-PEG-PLGA hydrogel for enhanced bone regeneration. Int J Biol Macromol. 2023;253. 10.1016/j.ijbiomac.2023.126721. - PubMed
    1. van der Heide D, Cidonio G, Stoddart MJ, D’Este M. 3D printing of inorganic-biopolymer composites for bone regeneration. Biofabrication. 2022;14. 10.1088/1758-5090/ac8cb2. - PubMed

LinkOut - more resources