Review
. 2025 Apr 7;23(1):281.
doi: 10.1186/s12951-025-03311-3.

Nanosensitizer-assisted sonodynamic therapy for breast cancer

Affiliations
Review

Nanosensitizer-assisted sonodynamic therapy for breast cancer

Jing Yu et al. J Nanobiotechnology. .

Abstract

Breast cancer is the most commonly diagnosed cancer worldwide. Despite advancements in therapeutic modalities, its prognosis remains poor owing to complex clinical, pathological, and molecular characteristics. Sonodynamic therapy (SDT) is a promising approach for tumor elimination, using sonosensitizers that preferentially accumulate in tumor tissues and are activated by low-intensity ultrasound to produce reactive oxygen species. However, the clinical translation of SDT faces challenges, including the limited efficiency of sonosensitizers and resistance posed by the tumor microenvironment. The emergence of nanomedicine offers innovative strategies to address these obstacles. This review discusses strategies for enhancing the efficacy of SDT using sonosensitizers, including rational structural modifications, improved tumor-targeted enrichment, tumor microenvironment remodeling, and imaging-guided therapy. Additionally, SDT-based multimodal therapies, such as sono-chemotherapy, sono-immunotherapy, and sono-photodynamic therapy, and their potential applications in breast cancer treatment are summarized. The underlying mechanisms of SDT in breast cancer are briefly outlined. Finally, this review highlights current challenges and prospects for the clinical translation of SDT, providing insights into future advancements that may improve therapeutic outcomes for breast cancer.

Keywords: Breast cancer; Nanomedicine; Sonodynamic therapy; Sonosensitizer.


Conflict of interest statement

Declarations. Ethics approval and consent to participate: Not applicable. Consent for publication: Not applicable. Competing interests: The authors declare no competing interests.

Figures

Fig. 1
Fig. 1
Schematic illustration of the SDT mechanisms in breast cancer
Fig. 2
Fig. 2
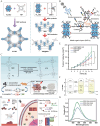
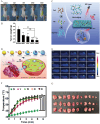
A The schematic diagram of the preparation of TBP@MOL for SDT. B The mechanism of enhanced 1O2 generation for TBP@MOL under ultrasound irradiation. Reprinted with permission from ref. [15]. Copyright 2023, Wiley. C Schematic illustration of the synthetic route of CTP and combined therapy. Reprinted with permission from ref. [50]. Copyright 2021, American Chemical Society. D Schematic illustration depicting the synthesis of M-BOC@SP NSs and mechanism of enhanced SDT against breast cancer. E Tumor volumes after various treatments (***P < 0.001). Reprinted with permission from ref. [16]. Copyright 2023, Elsevier. F Schematic illustration of energy bands of BWO-Fe NSs and band bending under ultrasound irradiation. G Fenton reactivity via Fe doping of BWO-Fe NSs improving sonodynamic performance.Reprinted with permission from ref. [54]. Copyright 2023, Wiley
Fig. 3
Fig. 3
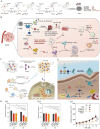
A Schematic illustration of the assembly of 1-NPs. B The mechanism of GSH-activatable sono-photodynamic immunotherapy for tumors by 1-NPs. Reprinted with permission from ref. [19]. Copyright 2023, Wiley. C Schematic diagram of the transformable TiO2@CaP under physiologically neutral as well as pathologically acidic condition and the mechanism for improved sono-immune therapeutic efficacy in tumor. D (a) Tumor weight of primary breast cancer and (b) tumor weight as well as (c) growth curves of metastatic lung cancer in 4T1 tumor-bearing mice with different treatments. Reprinted with permission from ref. [20]. Statistically significant difference: *P < 0.05; **P < 0.01; ***P < 0.001. Copyright 2021, Wiley. E The mechanism of efficient O2 production of MnO2/CaO2/Ce6@ZIF-8 for SDT. Reprinted with permission from ref. [68]. Copyright 2022, Royal Society of Chemistry
Fig. 4
Fig. 4
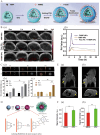
A Schematic illustration for the design of FHMP NPs. B (a) PA images and (b) PA signal at tumor regions of MDA-MB-231 tumor-bearing mice with different treatment at varied time intervals. Reprinted with permission from ref. [74]. Copyright 2018, Ivyspring International Publisher. C A multifunctional Ce6/PFP/DTX/PLGA nanoparticle named CPDPNP with ultrasound imaging capabilities: (a) 2D and CEUS images under different low-intensity focused ultrasound intensities and duration times. The corresponding grayscale intensity of (b) B-mode and (c) CEUS imaging at different intensities and time (**P < 0.01). Reprinted with permission from ref. [75]. Copyright 2021, Springer. D Schematic illustration of the synthesis of HMONs-MnPpIX-PEG. E The axial and coronal T1-weighted MR imaging of 4T1 tumor-bearing mice (a) before and (b) after intravenous administration of HMONs-MnPpIX-PEG. F (a) axial and (b) coronal T1-weighted MRI signal intensity of tumor before and after the injection of HMONs-MnPpIX-PEG (**P < 0.01). Reprinted with permission from ref. [76]. Copyright 2017, American Chemical Society
Fig. 5
Fig. 5
Summative scheme of combination therapy based on SDT for the treatment of breast cancer
Fig. 6
Fig. 6
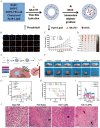
A Synthesis of PSDL. B Cell uptake of nanoparticles using the red fluorescence emission of DOX by laser confocal microscope. C Tumor growth curves and D tumor photos of MDA-MB-231 tumor-bearing nude mice after different treatments. Reprinted with permission from ref. [17]. **P < 0.01, compared with control; ##P < 0.01, compared among groups. Copyright 2022, Multidisciplinary Digital Publishing Institute (MDPI). E Schematic demonstration of the synthesis of A-DPPs and chemotherapy and SDT combined therapy strategy. F The photos of 4T1-bearing mice and isolated tumors at day 15 post different treatments. G Tumor volumes and H survival curve of tumor-bearing mice after different therapies. ***P < 0.001, ****P < 0.0001. I The passive cavitation signals in tumor-bearing mice with different treatments. J Hematoxylin and eosin staining images of tumor sites to observe the coagulative necrosis areas in tumor-bearing mice with different treatments. Reprinted with permission from ref. [18]. Copyright 2022, Dove Press
Fig. 7
Fig. 7
A Schematic illustration of the anti-tumor mechanism of CCL21a/ExoGM−CSF+Ce6@nanoGel. B Tumor growth (*P < 0.05 by two-way ANOVA) and C survival curves of 4T1 breast cancer mice treated with indicated hydrogels (*P < 0.01 by log-rank test). D The number of lung metastatic nodules at day 28 post different treatments (***P < 0.001 by one-way ANOVA). G1: None@nanoGel/US group; G2: CCL21a/ExoCtrl@nanoGel/US group; G3: CCL21a/ExoCtrl+Ce6@nanoGel/US group; G4: CCL21a/ExoGM−CSF+Ce6@nanoGel/US group. Reprinted with permission from ref. [94]. Copyright 2023, Wiley. E Schematic illustration of the synthesis of SnSNPs and their denaturation-and-penetration strategy for improved SDT. F The detection of content of collagen fibers via Masson’s trichrome staining of tumor tissue sections after various treatments. Reprinted with permission from ref. [97]. Copyright 2023, Nature Publishing Group
Fig. 8
Fig. 8
A Representative images of 4T1-bearing mice and B tumor weight from different groups at day 12 after treatments. **P < 0.01 versus control, ***P < 0.001 versus control, ##P < 0.01 SPDT/PSDT group versus SDT group, &&P < 0.01 SPDT/PSDT group versus PDT group. Reprinted with permission from ref. [108]. Copyright 2016, Elsevier. C Schematic illustration of PB + Ce6@Hy for self-augmented sonodynamic/photothermal combination therapy.Reprinted with permission from ref. [114]. Copyright 2022, Frontiers Media SA. D Schematic diagram of the preparation and anti-tumor mechanism of the CuS/HSA-TAPP. E Infrared thermal images and F temperature change curves of breast tumor-bearing mice with different treatments (**P < 0.01). G Tumor volume of breast tumor-bearing mice on the 14th day after different treatments. I: PBS group; II: Laser group; III:US group, IV: CuS/HSA hollow nanocapsules group, V: CuS/HSA hollow nanocapsules + laser group, VI: CuS/HSA hollow nanocapsules + US group, VII: CuS/HSA hollow nanocapsules + US + laser group, VIII: CuS/HSA-TAPP hollow nanocapsules group, IX: CuS/HSA-TAPP hollow nanocapsules + laser group, X: CuS/HSA-TAPP hollow nanocapsules + US group, XI: CuS/HSA-TAPP hollow nanocapsules + US + laser group. Reprinted with permission from ref. [115]. Copyright 2022, Royal Society of Chemistry
Fig. 9
Fig. 9
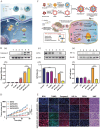
A Schematic illustration of IRP NPs for ferroptosis-boosted sonodynamic antitumor therapy. B Western blot and relative quantitative analysis of (a and b) Caspase-3, (c and d) GPX4 and (e and f) HIF-1α (**P < 0.01, ***P < 0.001, ****P < 0 .0001). Reprinted with permission from ref. [119]. Copyright 2022, Taylor &Francis. C Schematic diagram of SAFE mediated combination treatment of sonodynamic therapy and ferroptosis. D The tumor volumes curves of the 4T1 orthotopic breast tumors with different treatments (***P < 0.001). E Histological analysis of tumor tissues for ROS, TUNEL, caspase-3, HIF-1α and GPX4. Reprinted with permission from ref. [120]. Copyright 2022, Wiley
Fig. 10
Fig. 10
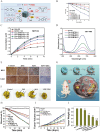
A Schematic diagram of ROS generation by Cu2-xO-BTO NCs through the sonodynamic and chemodynamic processes and detection by the specific probes. B The detection of 1O2 in the sonodynamic process via degradation curves of DPBF. C The production of ⋅OH in the sonodynamic process measured by using TA as the probe. D Generation of ⋅OH in the chemodynamic process measured by using TMB as the probe. Reprinted with permission from ref. [124]. Copyright 2022, American Chemical Society. E The expression of HK2 and Glut1 in 4T1 tumor-bearing mice by immunochemistry. F Images of pulmonary metastatic nodules of breast cancer. Reprinted with permission from ref. [131]. Copyright 2019, Elsevier. G Schematic illustration of T-mTNPs@L-Arg for synergistic nitric oxide gas-sonodynamic therapy. H The relative dissolved oxygen content in the cell medium of different groups. I The tumor volumes curves (*P < 0.05 versus mTNPs@L-Arg) and J Tumor weight of the MCF-7 tumor-bearing mice with different treatments (*P < 0.05 versus the control groups, #P < 0.05 versus mTNPs@L-Arg). Reprinted with permission from ref. [132]. Copyright 2022, Dove Press

References

    1. Sung H, Ferlay J, Siegel RL, Laversanne M, Soerjomataram I, Jemal A, et al. Global cancer statistics 2020: GLOBOCAN estimates of incidence and mortality worldwide for 36 cancers in 185 countries. CA Cancer J Clin. 2021;71(3):209–49. - PubMed
    1. Arnold M, Morgan E, Rumgay H, Mafra A, Singh D, Laversanne M, et al. Current and future burden of breast cancer: global statistics for 2020 and 2040. Breast. 2022;66:15–23. - PMC - PubMed
    1. Siegel RL, Miller KD, Wagle NS, Jemal A. Cancer statistics, 2023. CA Cancer J Clin. 2023;73(1):17–48. - PubMed
    1. Heer E, Harper A, Escandor N, Sung H, McCormack V, Fidler-Benaoudia MM. Global burden and trends in premenopausal and postmenopausal breast cancer: a population-based study. Lancet Glob Health. 2020;8(8): e1027. - PubMed
    1. Giaquinto AN, Sung H, Miller KD, Kramer JL, Newman LA, Minihan A, et al. Breast cancer statistics, 2022. CA Cancer J Clin. 2022;72(6):524–41. - PubMed

Substances

LinkOut - more resources