. 2025 Apr 8;10(7):e186259.
doi: 10.1172/jci.insight.186259.

Fgl2 regulates FcγRIIB+CD8+ T cell responses during infection

Affiliations

Fgl2 regulates FcγRIIB+CD8+ T cell responses during infection

Anna B Morris et al. JCI Insight. .

Abstract

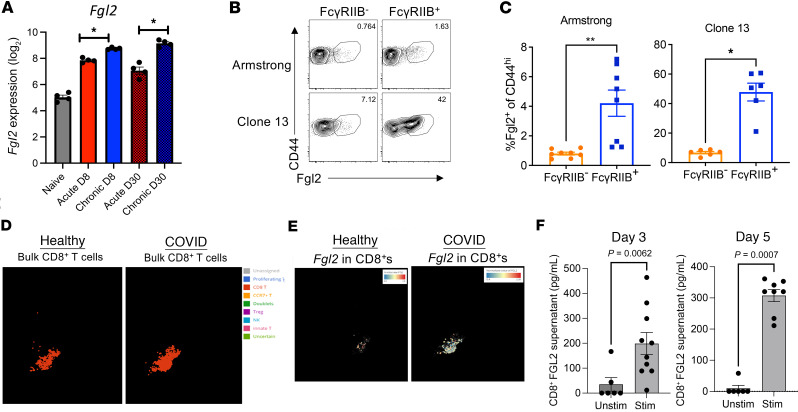
While the inhibitory receptor FcγRIIB has been shown to be upregulated on activated CD8+ T cells in both mice and humans, its effect on T cell fate during infection has not been fully elucidated. We identified an increase in FcγRIIB-expressing CD8+ T cells in patients with COVID-19 relative to healthy controls as well as in mouse models of viral infection. Despite its well-known role as an Fc receptor, FcγRIIB also ligates the immunosuppressive cytokine Fgl2, resulting in CD8+ T cell apoptosis. Both chronic LCMV infection in mice and COVID-19 in humans resulted in a significant increase in plasma Fgl2. Transfer of CD8+ T cells into a Fgl2-replete, but not Fgl2-devoid, environment resulted in elimination of FcγRIIB+, but not FcγRIIB-, CD8+ T cells. Similarly, plasma Fgl2 was directly proportional to CD8+ T cell lymphopenia in patients with COVID-19. RNA-Seq analysis demonstrated that Fgl2 was produced by murine virus-specific CD8+ T cells, with an increase in Fgl2 in CD8+ T cells elicited during chronic versus acute viral infection. Fgl2 was also upregulated in CD8+ T cells from patients with COVID-19 versus healthy controls. In summary, CD8+ T cell production of Fgl2 during viral infection underpinned an FcγRIIB-mediated loss of CD8+ T cell immunity in both mice and humans.

Keywords: Adaptive immunity; Immunology; T cells.


Figures

Figure 1
Figure 1. FcγRIIB is upregulated on CD8+ T cells isolated from patients with COVID.
Patients testing positive for SARS CoV-2 admitted as inpatients at Emory University Hospital from May to July 2020 (n = 31; Table 1) and normal healthy controls (n = 15) were consented for blood draw and CD8+ T cells were analyzed by flow cytometry. (A) Bulk CD8+ T cell frequencies were analyzed by Mann-Whitney U nonparametric test. (B) Frequencies of naive (CCR7+CD45RA+), TCM (CCR7+CD45RA), TEM (CCR7CD45RA), and TEMRA (CCR7CD45RA+) cells among CD8+ T cells are shown (analyzed by 2-way ANOVA). (C and D) Flow cytometry data were subjected to spanning-tree progression analysis for density-normalized events (SPADE) analysis. Shaded areas represent clusters of cells that were differentially represented in healthy individuals versus patients with COVID. Phenotypic characteristics of cells in those clusters are shown in D. Intensity of expression (MFI) is indicated by colorimetric scale. (EG) Flow cytometry data were analyzed via FlowJo. (E) Representative flow cytometry staining of FcγRIIB+ cells among CD8+ T cells. (F) Summary data of FcγRIIB+ cells among CD8+ cells (Mann-Whitney U nonparametric test). (G) Summary data of FcγRIIB+ cells among CD8+ Tem (Mann-Whitney U nonparametric test). Data are depicted as mean ± SEM. *P < 0.05, **P < 0.01, ***P < 0.001.
Figure 2
Figure 2. FcγRIIB is upregulated on viral antigen-specific effector and memory CD8+ T cells in mice.
Naive B6 mice were adoptively transferred with 2 × 10³ Thy1.1+ P14 TCR tg T cells and were infected with either LCMV Arm (2 × 10⁵ pfu i.p.) or cl-13, 2 × 10⁶ pfu i.v.). Blood was collected at the indicated time points for flow cytometric analysis. (A) Frequencies of Thy1.1+ P14 among total PBMC in Arm- or cl-13–infected animals. (B) Absolute numbers of Thy1.1+ P14 within PBMC in Arm- or cl-13–infected animals. (C and D) Representative flow cytometry staining (C) and summary data (D) of FcγRIIB+ cells among Thy1.1+ CD8+ T cells. Data shown are n = 3–5/group and are representative of 2 independent experiments. Data at each time point were compared by Mann-Whitney U nonparametric test. (E) mRNA transcript levels of Fcgr2b RNA isolated from P14 cells from Arm-infected versus cl-13–infected mice on day 30 from an existing dataset (20) (GSE30341) were compared by 2-way ANOVA with Dunnett’s post hoc test. Naive P14 were included as a control. (F) Chromatin accessibility of the Fcgr2b locus in acute versus chronic virus–elicited memory CD8+ P14 T cells was interrogated from an existing ATAC-Seq dataset (21). Naive CD8+ P14 T cells were used as a control. Data were analyzed by Mann-Whitney U nonparametric test and are depicted as mean ± SEM. *P < 0.05, **P < 0.01, ****P < 0.0001.
Figure 3
Figure 3. Transfer of FcγRIIB+ but not FcγRIIB CD8+ T cells into an Fgl2-rich environment results in loss of transferred T cells.
(AC) Naive B6 animals were infected either LCMV Arm or cl-13, and serum was analyzed on days 3, 7, 14, and 21 after infection for the concentration of total IgG (A), serum amyloid protein (SAP) (B), or Fgl2 (C). (DH) Naive B6 animals received an adoptive transfer of 1 × 10⁴ congenically labeled CD45.1+ P14 T cells and were infected with LCMV Arm. On day 27, splenic CD45.1+CD8+ P14 T cells were sorted into FcγRIIB+ (Fcpos) and FcγRIIB (Fcneg) populations which were each transferred into naive hosts that were then infected with either Arm or cl-13 (D). (E and F) The frequency (E) and absolute number (F) of FcγRIIB+ (Fcpos) versus FcγRIIB (Fcneg) CD45.1+ CD8+ among PBMC in Arm-infected mice. (G and H) The frequency (G) and absolute number (H) of FcγRIIB+ (Fcpos) versus FcγRIIB (Fcneg) CD45.1+ CD8+ among PBMC in cl-13–infected mice. Data shown are n = 3–5 mice/group and are representative of 2 independent experiments. Data at each time point were compared by Mann-Whitney U nonparametric test and are depicted as mean ± SEM. *P < 0.05, **P < 0.01, ***P < 0.001, ****P < 0.0001.
Figure 4
Figure 4. Fgl2 is increased in the serum of patients with COVID and is associated with decreased circulating CD8+ T cells.
(A) Plasma obtained from n = 31 COVID+ patients (at 2–16, mean 8.9d following symptom onset) or n = 15 healthy patients was assayed for Fgl2 concentration (ng/mL) via ELISA. (B) PBMC was obtained from n = 31 patients testing positive for SARS CoV-2 admitted as inpatients at Emory University Hospital May-July 2020 (n = 31, Table 1) that were enrolled in an IRB-approved protocol and consented for blood draw. Blood samples were obtained 2-16 (mean 8.9) days after symptom onset. WBC were not available for n = 7 patients, thus all absolute count data represents n = 24 patients with COVID. Data were analyzed by Mann-Whitney U nonparametric test and are depicted as mean ± SEM. (B) Plasma concentration of Fgl2 (ng/mL) is plotted against the frequency of CD8+ cells among PBMC (left panel), the absolute number of CD8+ T cells within PBMC (right panel), or the frequency of CD8+ cells among PBMC in healthy controls (right panel). (C) Plasma concentration of Fgl2 (ng/mL) is plotted against the frequency of CD45RA+ CCR7 Tem among CD8+ cells (left panel), and the absolute number of CD8+ CD45RA+ CCR7 Tem within PBMC (right panel). (D) Plasma concentration of Fgl2 (ng/mL) is plotted against the absolute number of total FcγRIIB+CD8+ T cells within PBMC (left panel) and the number of FcγRIIB+CD8+CD45RA+CCR7 Tem within PBMC (right panel). (E) Frequency of FcγRIIB+ among CD8+ T cells is plotted against the frequency of CD8+ cells among PBMC (left panel), and the absolute number of CD8+ T cells within PBMC (right panel). Data were compared by linear regression analysis. (F and G) PBMC obtained from n = 21 patients positive for SARS-CoV-2 was subjected to bulk RNA-Seq (n = 10 patients did not have material available for RNA-Seq). (F) PCA of differentially expressed genes (DEG) between patients with high plasma Fgl2 concentrations versus those with low plasma Fgl2 concentrations. (G) GSEA of DEGs (FDR < 0.1). The normalized enrichment scores of significant pathways (FDR < 0.1) in patients exhibiting high versus low plasma Fgl2 concentrations are plotted.
Figure 5
Figure 5. CD8+ T cells produce Fgl2 during viral infection in both mice and humans.
(A) Fgl2 transcripts in CD45.1+CD8+ P14 T cells sorted by FACS that were isolated on either day 8 or day 30 from mice infected with either Arm (acute) or cl-13 (chronic) were assessed by bulk RNA-Sequencing and compared by 2-way ANOVA (24). (B and C) Fgl2 protein expression in CD45.1+CD8+ P14 T cells isolated from the spleens of either Arm-infected or cl-13–infected mice on day 27 after infection was assessed via intracellular cytokine staining following ex vivo restimulation with PMA/ionomycin. Representative flow cytometry plots are shown in B. Summary data from n = 3 mice/group are shown in C. Data depicted are mean ± SEM, using Mann Whitney U nonparametric test. Data are representative of 2 independent experiments. (D and E) Data mining experiment to identify expression of Fgl2 within CD8+ T cells from a single cell RNA-Seq data comparing healthy people and patients with COVID-19 (25). (D) The CD8+ T cell clusters in healthy versus patients with COVID are shown in red. (E) Expression of Fgl2 transcript within the CD8+ T cells in healthy versus patients with COVID is shown in white. (F) CD8+ T cells were FACS purified from healthy human PBMC and stimulated for 5 days with anti-CD3/anti-CD28. Supernatants were collected and Fgl2 concentration was assessed via ELISA. Data are depicted as mean ± SEM (n = 6–10), using Mann Whitney U test. *P < 0.05, **P < 0.01.

References

    1. Chen L, Flies DB. Molecular mechanisms of T cell co-stimulation and co-inhibition. Nat Rev Immunol. 2013;13(4):227–242. - PMC - PubMed
    1. Boross P, et al. The inhibiting Fc receptor for IgG, FcγRIIB, is a modifier of autoimmune susceptibility. J Immunol. 2011;187(3):1304–1313. doi: 10.4049/jimmunol.1101194. - DOI - PubMed
    1. Clatworthy MR, Smith KG. FcgammaRIIb balances efficient pathogen clearance and the cytokine-mediated consequences of sepsis. J Exp Med. 2004;199(5):717–723. doi: 10.1084/jem.20032197. - DOI - PMC - PubMed
    1. Li F, Ravetch JV. Inhibitory Fcγ receptor engagement drives adjuvant and anti-tumor activities of agonistic CD40 antibodies. Science. 2011;333(6045):1030–1034. doi: 10.1126/science.1206954. - DOI - PMC - PubMed
    1. Morris AB, et al. Signaling through the inhibitory Fc receptor FcγRIIB induces CD8+ T cell apoptosis to limit T cell immunity. Immunity. 2020;52(1):136–150. doi: 10.1016/j.immuni.2019.12.006. - DOI - PMC - PubMed