

Long-term effectiveness and safety of methotrexate-tacrolimus combination therapy versus methotrexate monotherapy in reducing rheumatoid arthritis flares after TNF inhibitor discontinuation: a retrospective cohort study
- PMID: 40197512
- PMCID: PMC11974236
- DOI: 10.1186/s41927-025-00489-9
Long-term effectiveness and safety of methotrexate-tacrolimus combination therapy versus methotrexate monotherapy in reducing rheumatoid arthritis flares after TNF inhibitor discontinuation: a retrospective cohort study
Abstract
Background: This study evaluates the long-term effectiveness and safety of methotrexate-tacrolimus combination therapy compared to methotrexate monotherapy in maintaining successful tumor necrosis factor (TNF) inhibitor discontinuation in rheumatoid arthritis (RA) patients.
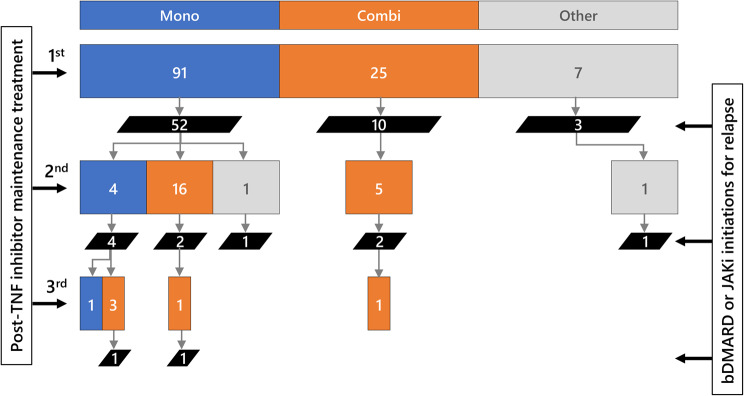
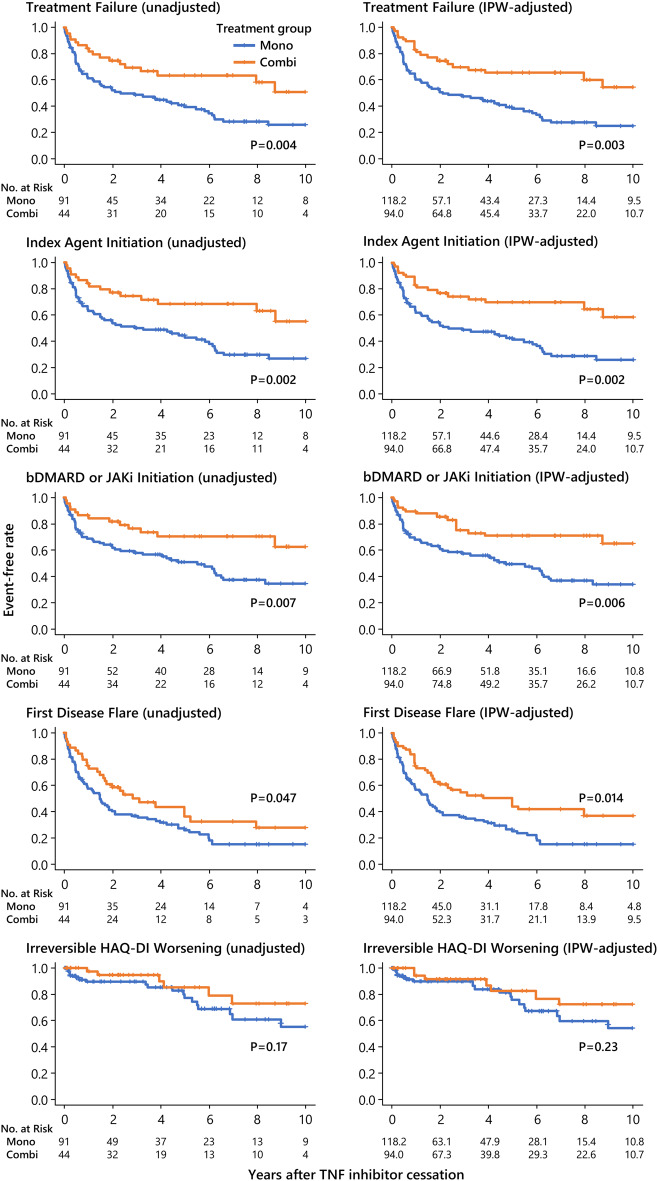
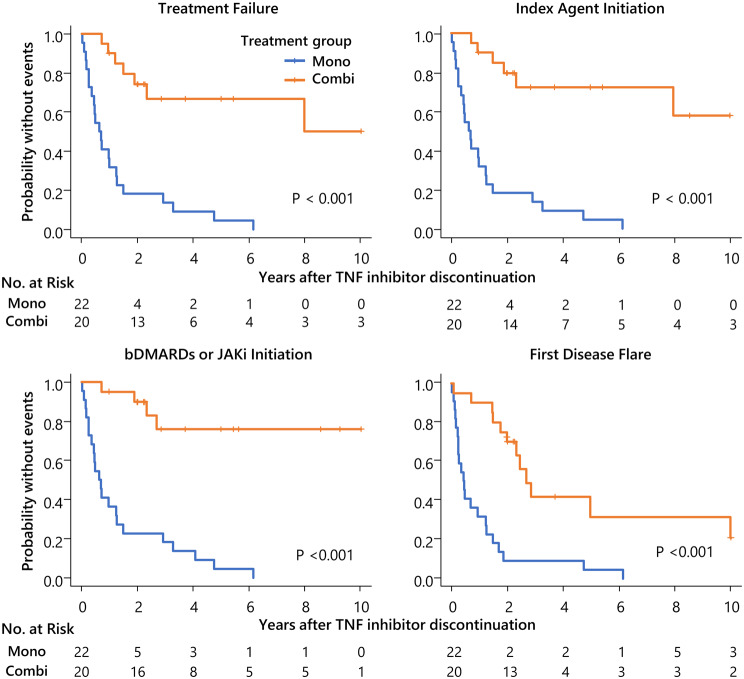
Methods: We retrospectively analyzed consecutive RA patients who discontinued TNF inhibitors after achieving disease control by October 2022 and received either methotrexate monotherapy or methotrexate-tacrolimus combination therapy for up to 10 years. Per-observation time-to-event analyses assessed treatment failure, treatment intensification, first disease flare, and irreversible functional deterioration. Mixed-effects Cox models, time-dependent Cox models without random effects, and Kaplan-Meier estimates with inverse probability weighting were applied. Safety assessment included treatment-limiting adverse events and renal function trends.
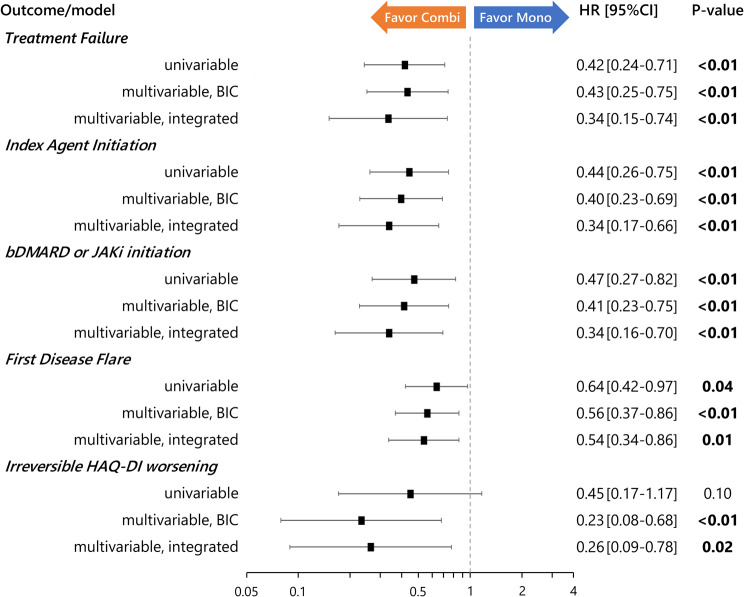
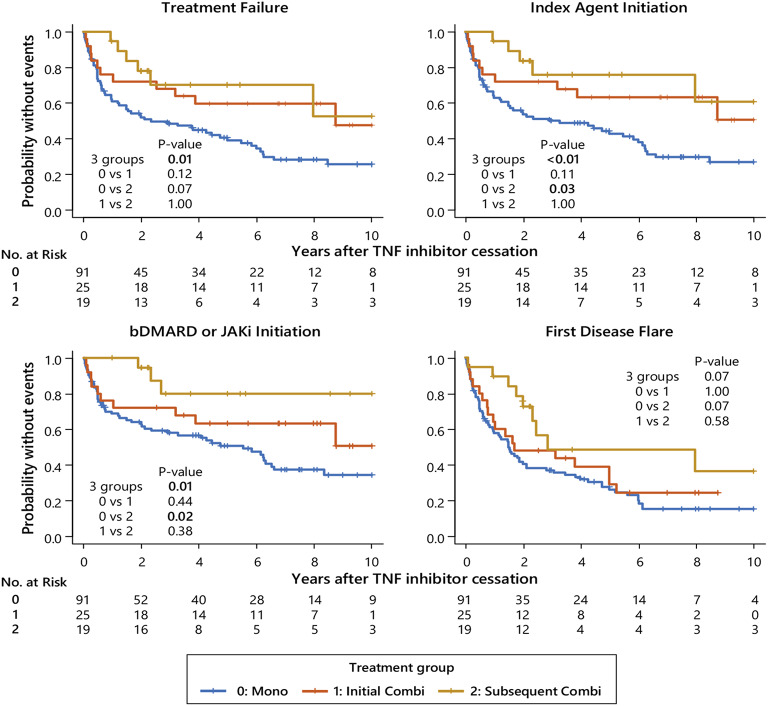
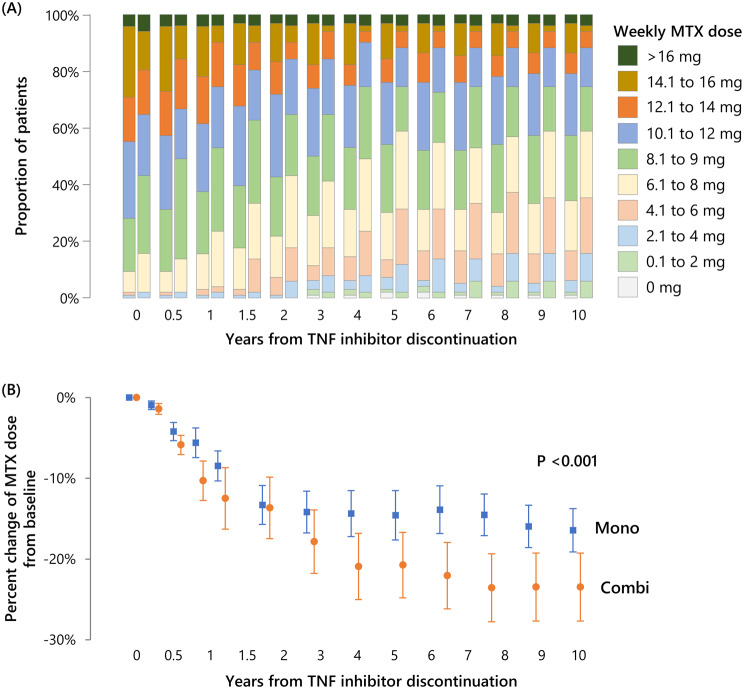
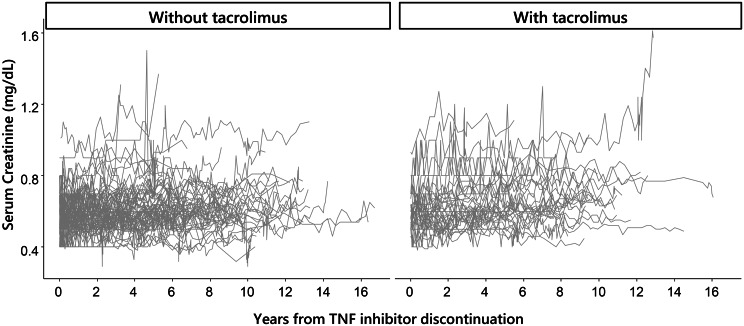
Results: A total of 147 treatment lines (96 methotrexate monotherapy and 51 combination therapy) in 116 patients were analyzed. The combination therapy significantly reduced treatment failure (hazard ratio [HR], 0.42; 95% confidence interval [CI], 0.24-0.72), treatment intensification with the index drugs (HR, 0.38; 95% CI, 0.22-0.67) and with biologics or Janus kinase inhibitors (HR, 0.39; 95% CI, 0.22-0.71), and first flare (HR, 0.55; 95%CI 0.36-0.84), with consistent findings across models. The benefit was most pronounced in patients with prior flares during methotrexate monotherapy after TNF inhibitor discontinuation, with HRs as low as 0.04-0.12 across outcomes. No significant differences in treatment-limiting adverse events were observed. The annual increase in serum creatinine for tacrolimus users was 0.0032 mg/dL, suggesting minimal long-term renal impact.
Conclusions: Methotrexate-tacrolimus combination therapy significantly reduces relapse risk following TNF inhibitor discontinuation without compromising safety, offering a potentially sustainable treatment alternative after achieving remission with TNF inhibitor therapy.
Keywords: Biological therapy; Clinical remission; Recurrence; Rheumatoid arthritis; Withdrawing treatment.
© 2025. The Author(s).
Conflict of interest statement
Declarations. Ethics approval and consent to participate: The Institutional Review Board and Ethics Committee of Nagoya City University Graduate School of Medical Sciences (IRB approval number: 60-21-0116), Japan, approved the study, following the principles of the Declaration of Helsinki and the local ethical guidelines. This study used an ‘opt-out’ approach. Patient data was included unless individuals opted out within the specified timeframe after notification. Consent for publication: Not applicable Disclaimer: No part of this manuscript, including text and figures, is copied or published elsewhere in whole or in part. While preparing this manuscript, the authors used generative AI tools like ChatGPT4, DeepL, and Grammarly to translate our original text into English, improve writing style, and check grammar and spelling. After using these tools, the authors reviewed and edited the content and take full responsibility for the publication’s content. Competing interests: The authors declare no competing interest.
Figures
Similar articles
-
Long-term efficacy and safety of add-on tacrolimus for persistent, active rheumatoid arthritis despite treatment with methotrexate and tumor necrosis factor inhibitors.Int J Rheum Dis. 2018 Mar;21(3):673-687. doi: 10.1111/1756-185X.13248. Epub 2018 Jan 4. Int J Rheum Dis. 2018. PMID: 29314738
-
Efficacy of add-on tacrolimus on methotrexate to maintain clinical remission after rediscontinuation of a tumor necrosis factor inhibitor in rheumatoid arthritis patients who relapsed shortly after discontinuation of the same tumor necrosis factor inhibitor due to clinical remission.Mod Rheumatol. 2017 Jan;27(1):29-34. doi: 10.3109/14397595.2016.1174394. Epub 2016 May 4. Mod Rheumatol. 2017. PMID: 27143107
-
Down-titration and discontinuation strategies of tumour necrosis factor-blocking agents for rheumatoid arthritis in patients with low disease activity.Cochrane Database Syst Rev. 2019 May 24;5(5):CD010455. doi: 10.1002/14651858.CD010455.pub3. Cochrane Database Syst Rev. 2019. PMID: 31125448 Free PMC article.
-
Real-World Persistence and Effectiveness of Upadacitinib versus Other Janus Kinase Inhibitors and Tumor Necrosis Factor Inhibitors in Australian Patients with Rheumatoid Arthritis.Rheumatol Ther. 2025 Feb;12(1):173-202. doi: 10.1007/s40744-024-00736-4. Epub 2025 Jan 6. Rheumatol Ther. 2025. PMID: 39757285 Free PMC article.
-
Baricitinib as monotherapy for treatment of rheumatoid arthritis: analysis of real-world data.Curr Med Res Opin. 2024 Nov;40(11):1993-2002. doi: 10.1080/03007995.2024.2416979. Epub 2024 Oct 22. Curr Med Res Opin. 2024. PMID: 39436446 Review.
References
-
- Smolen JS, Landewé RBM, Bergstra SA, Kerschbaumer A, Sepriano A, Aletaha D, et al. EULAR recommendations for the management of rheumatoid arthritis with synthetic and biological disease-modifying antirheumatic drugs: 2022 update. Ann Rheum Dis. 2023;82:3–18. - PubMed
-
- Fraenkel L, Bathon JM, England BR, St Clair EW, Arayssi T, Carandang K, et al. 2021 American college of rheumatology guideline for the treatment of rheumatoid arthritis. Arthritis Rheumatol. 2021;73:1108–23. - PubMed
-
- Moreland LW, Baumgartner SW, Schiff MH, Tindall EA, Fleischmann RM, Weaver AL, et al. Treatment of rheumatoid arthritis with a recombinant human tumor necrosis factor receptor (p75)-Fc fusion protein. N Engl J Med. 1997;337:141–47. - PubMed
-
- Maini R, St Clair EW, Breedveld F, Furst D, Kalden J, Weisman M, et al. Infliximab (chimeric anti-tumour necrosis factor alpha monoclonal antibody) versus placebo in rheumatoid arthritis patients receiving concomitant methotrexate: a randomised phase III trial. ATTRACT Study Group Lancet. 1999;354:1932–39. - PubMed
-
- Kremer JM, Westhovens R, Leon M, Di Giorgio E, Alten R, Steinfeld S, et al. Treatment of rheumatoid arthritis by selective inhibition of T-cell activation with fusion protein CTLA4Ig. N Engl J Med. 2003;349:1907–15. - PubMed
LinkOut - more resources
Full Text Sources
