. 2025 Apr;29(7):e70097.
doi: 10.1111/jcmm.70097.

ATP13A2 as a prognostic biomarker and its correlation with immune infiltration in cervical cancer: A retrospective study

Affiliations

ATP13A2 as a prognostic biomarker and its correlation with immune infiltration in cervical cancer: A retrospective study

Zhi Zhao et al. J Cell Mol Med. 2025 Apr.

Abstract

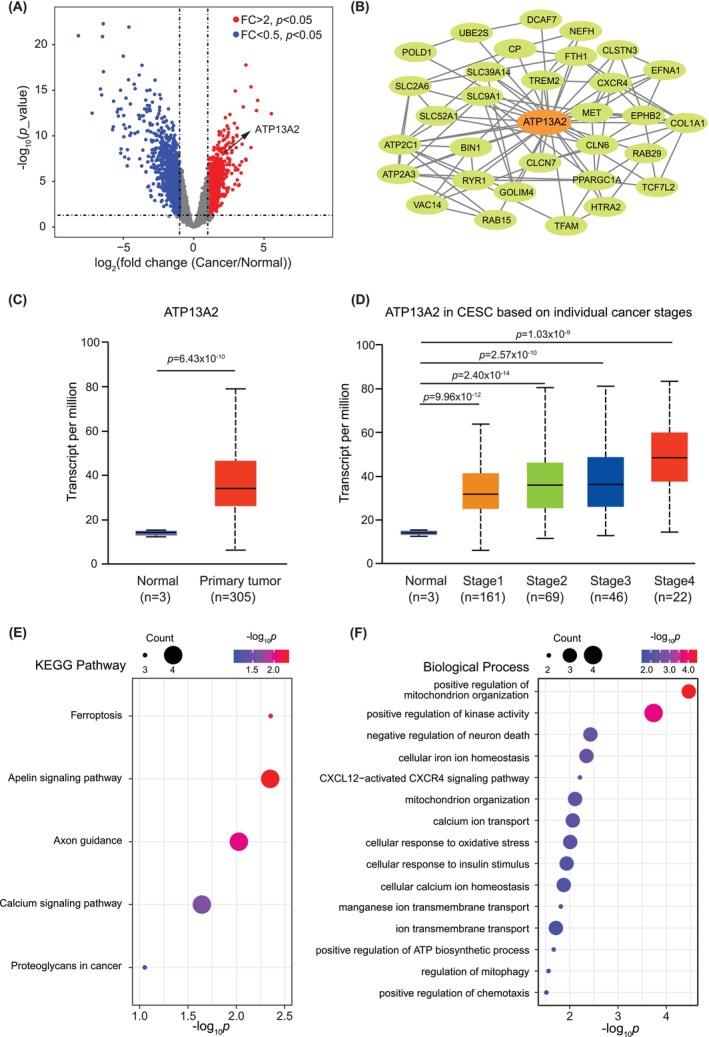
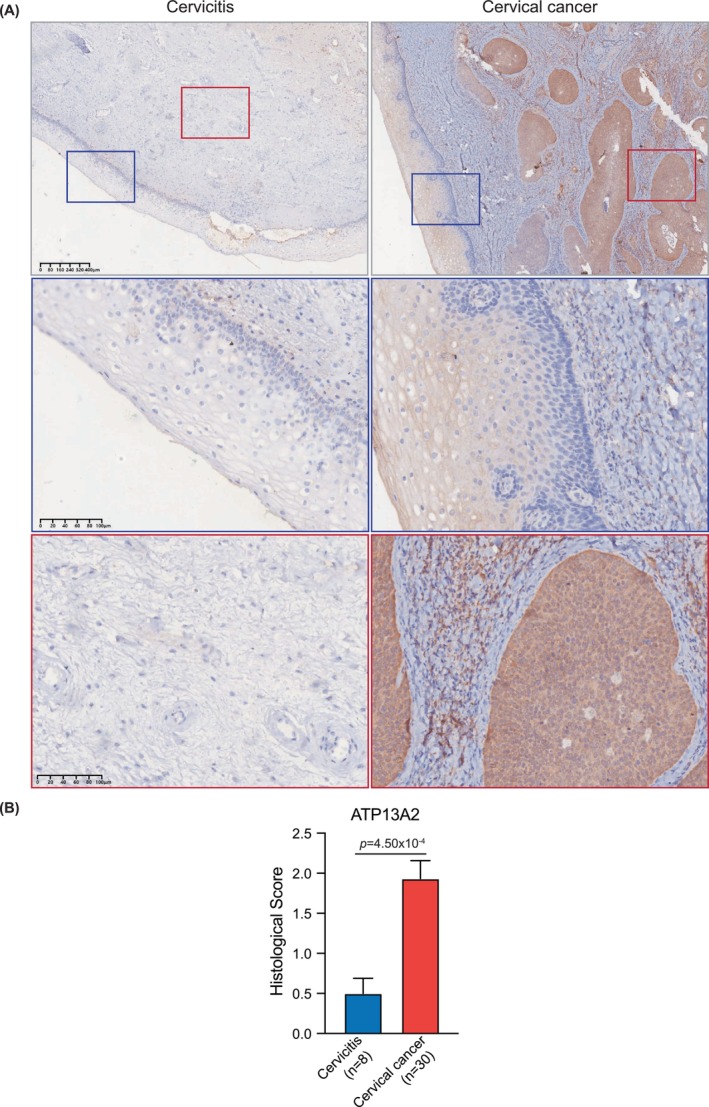
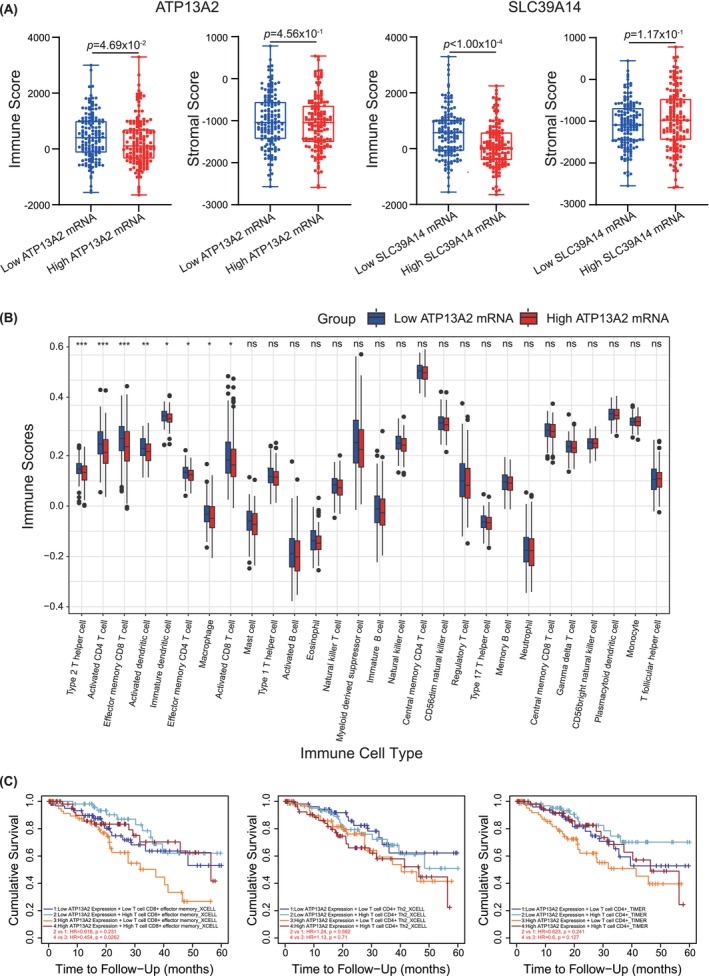
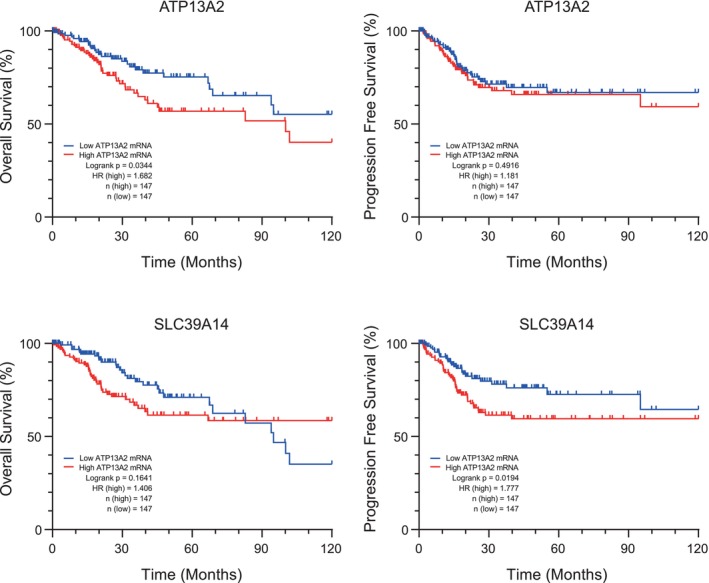
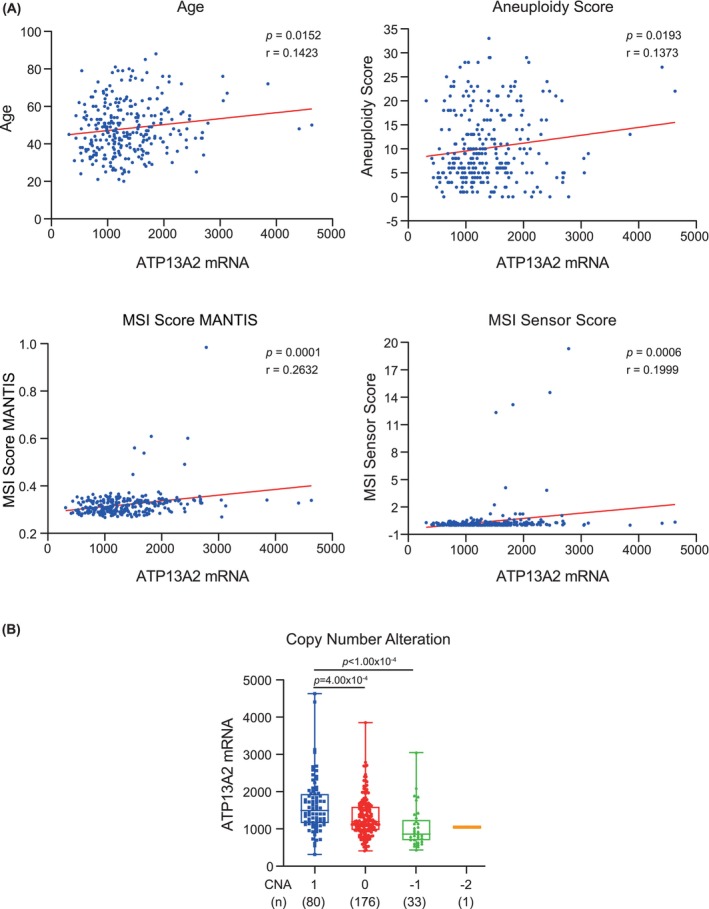
While the oncogene ATP13A2 is reportedly involved in colorectal cancer, its role in cervical cancer (CC) has yet to be fully characterized. In this study, we investigated ATP13A2 as a potential prognostic biomarker of CC. To this end, we compared CC tissues with normal tissues to identify differentially expressed genes, identifying ATP13A2 as a potential marker of CC. Elevated ATP13A2 expression levels were identified in CC samples compared to noncancerous samples across various data sets, with further immunohistochemical validation. Functional enrichment analysis revealed that ATP13A2 plays an essential role in the CXCL12-activated CXCR4 signalling pathway and chemotaxis regulation, which may alter immune infiltration. Notably, increased ATP13A2 levels were associated with poor overall survival. Furthermore, multiple clinical characteristics were significantly associated with ATP13A2 expression. Additionally, tumour bacterial infiltration was assessed using weighted co-expression network analysis, revealing a relationship between ATP13A2 expression and bacteria in the CC tumour microenvironment. Our results suggest that ATP13A2 is a promising diagnostic and prognostic marker for CC. However, further large-scale studies are needed to fully elucidate the mechanisms underlying the involvement of ATP13A2 in CC.

Keywords: ATP13A2; cervical cancer; immune infiltration; microbiome; prognostic marker.


Conflict of interest statement

The authors declare no conflicts of interest.

Figures

FIGURE 1
FIGURE 1
Analysis of cervical cancer‐induced expression and pathway enrichment. (A) Volcano plots representing differential gene expression between cervical cancer and normal tissues using data from the GSE9750 data set. The x‐axis displays the log2 (fold change) of gene expression (cancer relative to normal), whereas the y‐axis shows the log10 (p‐value). Genes with significant upregulation of expression (fold change >2, p < 0.05) are highlighted in red, and those with significant downregulation of expression (fold change <0.5, p < 0.05) are coloured in blue. ATP13A2 expression is strongly upregulated in cervical cancer and is notably marked. (B) The protein–protein interaction network of cancer‐related genes with upregulated expressions generated using the STRING database emphasized genes related to ATP13A2. A network of ATP13A2‐associated genes is shown. (C) Box plot illustrating the expression levels of ATP13A2 in cervical cancer tissues compared with those in normal tissues. Data are sourced from the UALCAN database, with the y‐axis displaying the transcript counts per million. (D) Analysis of ATP13A2 expression across different pathological stages. Data are sourced from the UALCAN database. (E) A representation of the top five terms from the KEGG analysis of genes is shown in (B). The spot size indicates the number of genes in each term, and the colour gradient indicates the p‐value of each term. (F) The gene ontology enrichment analysis of gene features in (B). The bubble plot specifies biological processes against their significance (−log10 of the p‐value), with the size of each bubble reflecting the number of genes associated with that process.
FIGURE 2
FIGURE 2
Immunohistochemistry of ATP13A2 antibodies in cervical cancer and cervicitis sections. (A) Representative immunohistochemical staining for ATP13A2 (brown) in cervicitis tissue (left) and human cervical cancer (right) sections. Nuclei were counterstained with haematoxylin (blue staining). The top row displays low‐magnification views (4×), with the areas of interest highlighted by coloured boxes. The corresponding high‐magnification (20×) views of these regions are shown below. The blue and red boxes show the squamous epithelium and stroma, respectively, in the cervical sections. The cervicitis sample showed a negative or weak staining pattern, whereas the cervical cancer sample showed high ATP13A2 protein expression, particularly in the tumour region. (B) Bar plot illustrating the histological scoring of ATP13A2 expression in cervicitis and cervical cancer samples. The data showed a significant increase in ATP13A2 expression in cervical cancer (n = 30) compared to that in cervicitis (n = 8), with a p‐value of 4.50e‐4. The error bars represent the standard error of the mean (SEM).
FIGURE 3
FIGURE 3
Evaluation of immune infiltration across high and low gene expression groups. (A) Plots show lower immune scores in the high gene expression group than in the low gene expression group for ATP13A2 and SLC39A14. Data are sourced from a Cervical Squamous Cell Carcinoma study (TCGA, PanCancer Atlas), n = 147 for the high and low gene expression groups. (B) Comparison of 28 immune cell subtypes between patients with high ATP13A2 mRNA expression level and controls. Histogram showing the differences in infiltration levels of type 2T helper cells, activated CD4 T cells, effector memory CD8 T cells, activated dendritic cells, immature dendritic cells, effector memory CD4 T cells, macrophages and activated CD8 T cells between high and low ATP13A2 expression groups. *p < 0.05; **p < 0.01; ***p < 0.001; ns, not significant. (C) Clinical survival outcomes of CC patients in the effector memory CD8 T cell, type 2T helper cell and activated CD4 T cell groups.
FIGURE 4
FIGURE 4
Comparison of overall survival (OS) and progression‐free survival (PFS) between high and low gene expression groups. Kaplan–Meier survival curves representing the OS of patients grouped based on low (blue curve) and high (red curve) ATP13A2 and SLC39A14 expression levels. The x‐axis represents survival duration (in months), and the y‐axis represents survival probability. Significant differences between the two groups were determined using the log‐rank test. Data are sourced from a Cervical Squamous Cell Carcinoma study (TCGA, PanCancer Atlas), n = 147 for the high and low gene expression groups.
FIGURE 5
FIGURE 5
Pearson's correlations between ATP13A2 expression levels and various clinical features in cervical cancer. Data are sourced from a Cervical Squamous Cell Carcinoma study (TCGA, PanCancer Atlas), with 290 available cases for analysis. (A) Scatter plots display the correlation between ATP13A2 expression levels (x‐axis) and various clinical features (y‐axis), including age, aneuploidy score, MSI score MANTIS and MSI sensor score. Each dot represents an individual patient's data. Linear regression lines (solid red lines) indicate the direction and strength of the correlations. Pearson's correlation coefficient (r) and significance level (p‐value) are displayed for each plot. (B) ATP13A2 expression in cervical cancer stratified by copy number alterations (CNAs). The box plot represents the distribution of ATP13A2 expression levels (y‐axis) in cervical cancer samples grouped by their respective CNAs (x‐axis): CNA = 1, 0, −1 and −2. Each box represents the full range of minimum to maximum expression values. All data points are displayed within the box. The mean ATP13A2 expression is highlighted by a horizontal line within a box. The number of samples in each CNA group is indicated by the corresponding box. CNA = 1, gain of copy number; CNA = 0, neutral or no change in copy number; CNA = −1, single copy deletion; CNA = −2, double copy deletion.

Similar articles

References

    1. Siegel RL, Miller KD, Jemal A. Cancer statistics, 2018. CA Cancer J Clin. 2018;68(1):7‐30. doi:10.3322/caac.21442 - DOI - PubMed
    1. Bray F, Laversanne M, Sung H, et al. Global cancer statistics 2022: GLOBOCAN estimates of incidence and mortality worldwide for 36 cancers in 185 countries. CA Cancer J Clin. 2024;74(3):229‐263. doi:10.3322/caac.21834 - DOI - PubMed
    1. Wang L, Wang P, Ren Y, et al. Prevalence of high‐risk human papillomavirus (HR‐HPV) genotypes and multiple infections in cervical abnormalities from northern Xinjiang, China. PLoS One. 2016;11(8):e0160698. doi:10.1371/journal.pone.0160698 - DOI - PMC - PubMed
    1. Wu J, Chen J, Feng Y, Tian H, Chen X. Tumor microenvironment as the "regulator" and "target" for gene therapy. J Gene Med. 2019;21(7):e3088. doi:10.1002/jgm.3088 - DOI - PubMed
    1. Vito A, El‐Sayes N, Mossman K. Hypoxia‐driven immune escape in the tumor microenvironment. Cells. 2020;9(4):9040992. doi:10.3390/cells9040992 - DOI - PMC - PubMed

MeSH terms