. 2025 Apr 8;135(11):e176818.
doi: 10.1172/JCI176818. eCollection 2025 Jun 2.

Identification of CD84 as a potent survival factor in acute myeloid leukemia

Affiliations

Identification of CD84 as a potent survival factor in acute myeloid leukemia

Yinghui Zhu et al. J Clin Invest. .

Abstract

Acute myeloid leukemia (AML) is an aggressive and often deadly malignancy associated with proliferative immature myeloid blasts. Here, we identified CD84 as a critical survival regulator in AML. High levels of CD84 expression provided a survival advantage to leukemia cells, whereas CD84 downregulation disrupted their proliferation, clonogenicity, and engraftment capabilities in both human cell lines and patient-derived xenograft cells. Critically, loss of CD84 also markedly blocked leukemia engraftment and clonogenicity in MLL-AF9 and inv(16) AML mouse models, highlighting its pivotal role as a survival factor across species. Mechanistically, CD84 regulated leukemia cells' energy metabolism and mitochondrial dynamics. Depletion of CD84 altered mitochondrial ultrastructure and function of leukemia cells, and it caused downmodulation of both oxidative phosphorylation and fatty acid oxidation pathways. CD84 knockdown induced a block of Akt phosphorylation and downmodulation of nuclear factor erythroid 2-related factor 2 (NRF2), impairing AML antioxidant defense. Conversely, CD84 overexpression stabilized NRF2 and promoted its transcriptional activation, thereby supporting redox homeostasis and mitochondrial function in AML. Collectively, our findings indicate that AML cells depend on CD84 to support antioxidant prosurvival pathways, highlighting a therapeutic vulnerability of leukemia cells.

Keywords: Antigen; Bone marrow; Cancer immunotherapy; Cell biology; Hematology; Oncology.


Figures
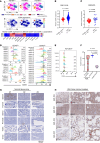
Figure 1
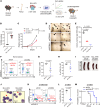
Figure 1. CD84 is overexpressed in AML.
(A) BM cells were subjected to CyTOF immunophenotyping comprising 39 surface markers tailored to detect different immune subsets. Analysis was performed with Cytobank platform in independent healthy donors (n = 3). (B) Scatter plots of CD84 mRNA expression in BM-MNCs from patients with AML (n = 542) and healthy donors (n = 73) (from GEO GSE13159 dataset) indicating increased CD84 expression in AML specimens. Graphs are presented as mean ± SEM. Statistical significance was assessed by 2-tailed unpaired t test. (C) Scatter plots of CD84 mRNA expression in leukemia blasts from patients with AML (n = 26) and CD34+ cells isolated from healthy donors (n = 38) (from GEO GSE9476 dataset) indicating increased CD84 expression in AML specimens. Graphs are presented as mean ± SEM. Statistical significance was assessed by 2-tailed unpaired t test. (D) Histogram showing CD84 surface protein expression in different AML patient specimens (n = 31) as analyzed by flow cytometry, highlighting that CD84 is highly expressed in AML primary patient cells. PE anti-human CD84 (clone CD84.1.21; BioLegend) was used (1 μl/test). (E) Histogram showing flow cytometry profiles of CD84 expression in healthy donors from the CD34+ cellular population. The analysis was conducted in independent donors (n = 5). (F) Violin plot shown the percentage of CD84-expressing cells among AML primary patients (n = 31), AML cell lines (n = 9), and healthy donor cells (n = 5). Data are represented as mean ± SEM. Statistical significance was assessed by 1-way ANOVA. (G) Representative images of immunohistochemical staining of CD84 performed in normal tissue array. Each normal tissue stained for CD84 was obtained from a minimum of 3 independent normal donors. Scale bars: 50 μm. (H) Representative images of immunohistochemical staining of CD84 in AML BM. Original magnification, ×200. Scale bars: 200 μm. The analysis was conducted in 15 independent AML donor biopsies (see also Supplemental Figure 2G).
Figure 2
Figure 2. CD84 deletion dampens AML survival in both AML cell lines and cell-derived xenograft.
(A) Western blot of the indicated proteins in THP1 cells and HEL cells transduced with 2 shRNAs against CD84 (shCD84-1; shCD84-2) or scramble control (shCtrl). Data are representative of at least 2 independent experiments. (B) Cell proliferative analysis of THP1 cells and HEL cells transduced with shCtrl or shCD84 lentiviral vectors. (C) Bar chart showing apoptosis levels indicated by annexin-APC/DAPI in 3 AML patient specimens transduced with shCtrl or shCD84 lentiviral vector. (D and E) AML cells obtained from 3 different donors (AML #1, #3, #8) were transduced with shCtrl or shCD84 lentivirus. Representative colony images are in D. The graph in E shows AML colony-formation cell (CFC) frequencies after 10 days of culture. n = 3 independent replicates per sample. (F) Bioluminescent imaging showing the tumor burden in xenograft NSG mice on days 14–35 following shCtrl- or shCD84-transduced THP1-luciferase cell transplantation (n = 5 per group). (G) Kaplan-Meier analysis of survival of THP1-luciferase cell–transplanted (shCtrl or shCD84) NSG mice. Each group consisted of 5 mice. (H) Bioluminescent imaging showing the tumor burden in xenograft NSG mice on days 19–41 following mock/shCtrl-, CD84-OE/shCtrl–, or CD84-OE/shCD84–transduced THP1-luciferase cell transplantation (n = 4 per group). (I) Kaplan-Meier analysis of survival of THP1-luciferase cell–transplanted (mock/shCtrl, CD84-OE/shCtrl, or CD84-OE/shCD84) NSG mice (n = 4 per group). (J) Bar chart showing the CD84 surface expression in BM cells from NSG mice xenografted with THP1 luciferase cells transduced with mock/shCtrl or CD84-OE/shCD84. Data are represented as mean ± SEM and are representative of 3 biological replicates (B and E) and 3 independent experiments (C). Each dot in J represents 1 mouse. Statistical significance was assessed by 2-way ANOVA (B, D, and E); 2-way ANOVA (mix model; C); log-rank test (G and I); and 2-tailed unpaired t test (J).
Figure 3
Figure 3. CD84 loss impairs AML development in PDX.
(A) Schematic of the design and procedures of generating a CD84 knockdown, AML PDX model. AML primary patient cells were transduced with shCtrl or shCD84 lentivirus. After puromycin selection, shCtrl or shCD84 AML primary cells were injected into irradiated NSG mice. (B) Representative flow cytometry profile of human AML cells (human CD45+/CD33+) engrafted in BM. (CE) Scatter plots showing the percentage of human AML cells (human CD45+/CD33+) engrafted in BM (C), SP (D), and PB (E) of recipient NSG mice (n = 5 per group). Data are represented as mean ± SEM and are representative of 5 individual mice per group. Statistical significance was assessed by 2-tailed unpaired t test. (F) Bioluminescent imaging showing the tumor burden in xenograft NSG mice (frontal and dorsal) following shCtrl- or shCD84-transduced AML PDX-luciferase cell transplantation (n = 4 per group). (G) Kaplan-Meier survival analysis of AML PDX-luciferase cell–transplanted (shCtrl or shCD84) NSG mice (n = 4 per group). Statistical significance was assessed by log-rank test. (H) Flow cytometry profile showing apoptosis levels indicated by annexin-APC/DAPI in 32D cells transfected with lentivirus including CD823-mock vector or CD823-CD84 WT. (I) Violin plot showing apoptosis levels indicated by annexin V-APC/DAPI in 32D cells transduced with mock or CD84 WT. Data are represented as mean ± SEM and are representative of 3 biological replicates. Statistical significance was assessed by 2-tailed unpaired t test.
Figure 4
Figure 4. CD84 is essential for AML maintenance in vivo.
(A) Design and procedures of generating an MLL-AF9 AML mouse model with CD84 knockdown. (B) Violin chart showing CD84 expression in c-kit+ cells before and after MLL-AF9 transduction. (C) Connecting line graph representing cell-proliferative analysis of MLL-AF9 AML cells transduced with shCtrl or shCD84 (shCD84-1; shCD84-2) lentiviral vector. (D) Representative colony formation images of MLL-AF9 c-kit+ cells transduced with shCtrl or shCD84 (shCD84-1; shCD84-2). Images were acquired in tiles by the City of Hope microscopy core facility using ZEN 3.1 (blue edition, Carl Zeiss Microscopy GmbH). Original maginifcation, ×10. (E) The graph shows MLL-AF9 AML colony formation cell numbers after 7 days of culture. (F) Representative scatter plots showing the percentage of donor cells (mouse CD45.2) transduced with shCtrl or shCD84 and engrafted in the BM. (G and H) Graphs showing the percentages of mouse CD45.2 in the BM (G) and SP (H) of recipient mice (mouse CD45.1) at around 5 weeks after BM transplantation (n = 5 per group). (I) Representative SP image of recipient mice xenografted with shCtrl-MLL-AF9 or shCD84-MLL-AF9. (J) Representative images of Wright-Giemsa staining of BM from recipient mice transplanted with shCtrl-MLL-AF9 or shCD84-MLL-AF9 AML cells (red arrows indicate AML blast). (K and L) Representative scatter plot (K) and associated graph (L) showing the leukemic engraftment in the PB of recipient mice (CD45.1) xenografted with MLL-AF9 AML with or without CD84 silencing (CD45.2) upon secondary BM transplantation on day 38. (M) Kaplan-Meier analysis of survival of secondary BM-transplanted mice with MLL-AF9 cells (shCtrl or shCD84) (n = 5 per group). Data are represented as ± SEM and are representative of 3 independent experiments (B, C, and E), 5 individual mice (G and H); and 5 individual mice per group (L). Statistical significance was assessed by 2-tailed unpaired t test (B, G, H, and L); 2-way ANOVA (mixed model; C); 1-way ANOVA (E); and log-rank test (M).
Figure 5
Figure 5. CD84 is essential for AML maintenance in inv(16) mouse model.
(A) Histogram and violin chart showing CD84 expression in inv(16) c-kit+ cells relative to WT c-kit+ cells. Data are represented as mean ± SEM and are representative of 3 independent experiments and mice. Statistical significance was assessed by 2-tailed unpaired t test. (B) Connecting line graph representing cell proliferative analysis of inv(16)-AML cells transduced with shCtrl or shCD84 (shCD84-1; shCD84-2) lentiviral vector. Data are represented as mean ± SEM and are representative of 3 independent experiments. Statistical significance was assessed with 2-way ANOVA (mixed model). (C) Violin plot showing apoptosis levels indicated by annexin-APC/DAPI in inv(16)-AML cells transduced with shCtrl or shCD84 lentiviral vector. Data are represented as mean ± SEM and are representative of 4 independent experiments. Statistical significance was assessed by 1-way ANOVA. (D) Representative flow cytometry profile of donor cells (mouse CD45.2) engrafted in BM from shCtrl-inv(16) or shCD84-inv(16) transplanted mice. (E) Scatter plot showing the leukemic engraftment in the BM of recipient mice (CD45.1) xenografted with inv(16) AML with or without CD84 silencing (CD45.2) (n = 5 per group). Data are represented as mean ± SEM and are representative of 5 individual mice. Statistical significance was assessed by 2-tailed unpaired t test. (F) Representative colony images of inv(16)-AML cells transduced with shCtrl or shCD84-1+2. Original magnificiation, 10×. (G) The bar graph shows colony formation numbers of inv(16) mice transduced with shCtrl or shCD84-1+2 after 7 days of culture. Data are represented as mean ± SEM and are representative of 7 independent replicates. Statistical significance was assessed by 2-tailed unpaired t test.
Figure 6
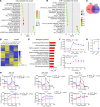
Figure 6. CD84 knockdown deactivated energy metabolism and induced mitochondrial stress in AML.
(A and B) Scattergrams of CD84-related gene sets based on enrichment analyses of DEGs in HEL cells (shCD84 vs shCtrl) (A) and THP1 cells (shCD84 vs shCtrl) (B). The color indicates the false discovery rate q values; NES, normalized enrichment score. (C) Venn diagram showing the overlapped DEGs between HEL (shCD84 versus shCtrl) and THP1 (shCD84 versus shCtrl) groups. (D) Heatmap showing gene expression of the overlapped differential genes between THP1 cells and HEL cells expressing shCD84 or shCtrl, based on a fold change >2 or <0.5 and P < 0.05. (E) Bar chart showing GO enrichment analysis of common DEGs (n = 188) in 2 AML cell lines. (F) Connecting lines showing the effects of CD84 deletion on levels of OCR and ECAR in THP1 cells. Cells were transfected with lentivirus expressing shCD84 or shCtrl, and puromycin selected for 2 days. The cells were harvested to measure levels of OCR and ECAR using the Seahorse XF Cell Energy Phenotype Test Kit. Data are represented as mean ± SEM and are representative of 3 biological replicates. Statistical significance was assessed with 2-way ANOVA (mixed model). (G) Box chart showing the effects of CD84 knockdown on FAO levels in THP1 cells. The cells were harvested as described in F, and FAO assay results are presented as fold change, compared with control. Data are represented as mean ± SEM and are representative of 3 independent experiments. Statistical significance was assessed by 2-tailed unpaired t test. (H) Connecting lines showing the effects of CD84 deletion on levels of OCR and ECAR in primary AML cells obtained from n = 3 different donors. Cells were transduced with lentivirus expressing shCD84 or shCtrl for 48 hours. The cells were harvested to measure levels of OCR and ECAR using the Seahorse XF Cell Energy Phenotype Test Kit. Data are represented as mean ± SEM and are representative of 3 independent experiments. Statistical significance was assessed with 2-way ANOVA (mixed model).
Figure 7
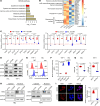
Figure 7. Knockdown of CD84 triggers mitochondrial stress in AML cells.
(A) Representative transmission electron microscopy images of mitochondrial cristae in HEL cells transfected with shCtrl or shCD84 lentivirus. Scale bars: 1 μm (top); 0.5 μm (bottom). The analysis was conducted in at least 2 independent experimental sets. (B) Western blot of indicated proteins was performed in HEL cells transduced with lentivirus expressing either shCtrl or shCD84, indicating mitochondrial dysfunction in CD84 knockdown cells. Data are representative of 2 independent biological replicates. (C) Interleaved scatter plot showing the MMPs that were measured using JC-1 dye for flow cytometry. Data are represented as mean ± SEM and are representative of 3 independent experiments. Statistical significance was assessed by 2-tailed unpaired t test. (D) Representative flow cytometry profiles of JC-1–stained THP1, which was transduced with lentiviruses expressing indicated vectors (shCD84 targeting 3′-UTR). Red (PE) and green (FITC) represent the monomers to aggregated ratio. (E) Interleaved scatter plot summarizing the alteration of MMPs shown in D. Data are represented as mean ± SEM and are representative of 3 independent experiments. Statistical significance was assessed by 1-way ANOVA. (F) Western blot of indicated proteins was performed in THP1 cells transduced with lentivirus expressing either shCtrl, shCD84 (3′-UTR), or shCD84 (3′-UTR) plus CD84-WT. Data are representative of at least 2 independent biological replicates.
Figure 8
Figure 8. CD84 knockdown impairs GSH metabolism and NRF2 antioxidant defense, leading to mitochondrial dysfunction in AML.
(A) Bar chart showing the KEGG pathway enrichment analysis of differentially expressed core genes in both THP1 cells and HEL cells. (B) Heatmap visualization of NRF2-regulated antioxidant and detoxification enzyme expression according to our RNA-Seq dataset. (C) The violin plot showing the mRNA expression of key antioxidant/detoxification genes in THP1 cells and HEL cells transduced with shCtrl or shCD84. Data are represented as mean ± SEM and are representative of 3 independent experiments. Statistical significance was assessed by 2-tailed unpaired t test. (D) Immunoblot detection of indicated proteins involved in GSH biosynthesis in THP1 cells and HEL cells transduced with shCtrl or shCD84 for 72 hours. Data are representative of at least 2 independent biological replicates. (E and F) Representative histogram (E) and violin chart (F) showing the effects of CD84 knockdown on intracellular ROS generation in THP1 cells and HEL cells transduced with shCtrl or shCD84 for 72 hours. Data are represented as mean ± SEM and are representative of 3 independent experiments. Statistical significance was assessed by 2-tailed unpaired t test. (G) The violin plot shows the intracellular GSH levels in THP1 cells and HEL cells that were transduced with shCtrl or shCD84 for 72 hours. Data are represented as mean ± SEM and are representative of 3 independent experiments. Statistical significance was assessed by 2-tailed unpaired t test. (H) Immunoblot analysis of the expression of NRF2 in the cytoplasm and nucleus of HEL and THP1 cells stably expressing CD84 shRNA (targeting 3’UTR). Data are representative of at least 2 independent experiments. (I) Representative confocal microscopy images and violin chart showing the nucleoplasm distribution of NRF2 in THP1 cells transduced with either shCtrl or shCD84 lentivirus. The intensity of nuclear fluorescence was quantified in the violin plot. Data are represented as mean ± SEM and are representative of 4 independent images. Statistical significance was assessed by 2-tailed unpaired t test.
Figure 9
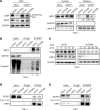
Figure 9. CD84 knockdown disrupts NRF2 binding to Keap1 in AML cells.
(A) The immunoblot shows the expression of indicated proteins in THP1 cells transduced with shCtrl or shCD84. THP1 cells stably expressing 3xFlag-CD84 were further infected with viruses expressing CD84 shRNA. The amount of NRF2 in the whole cell lysate, cytoplasm, and nucleus was determined by immunoblot. (B) The immunoblot shows coimmunoprecipitation analysis of the ubiquitination of NRF2 upon CD84 knockdown in THP1 cells. (C) The immunoblot shows the time course of protein expression after CHX treatment at indicated times. Western blot analysis confirmed the presence of NRF2 at times after CHX treatment in control samples. (D and E) The immunoblots show quantitative analysis of the binding to KEAP1 in the presence or absence of stably overexpressing Flag-CD84 cells by immunoprecipitation. The interaction between NRF2 and KEAP1 under different CD84 levels was analyzed. Indicated THP1 cells stably expressing CD84 shRNA (D) or 3xFlag-CD84 (E) were harvested for immunoprecipitation and subjected to immunoblotting with anti-NRF2 and anti-KEAP1 antibodies. Data in AE are representative of at least 2 biological replicates.

References

    1. Kantarjian H, et al. Acute myeloid leukemia: current progress and future directions. Blood Cancer J. 2021;11(2):41. doi: 10.1038/s41408-021-00425-3. - DOI - PMC - PubMed
    1. Masetti R, et al. Venetoclax: a new player in the treatment of children with high-risk myeloid malignancies? Blood Adv. 2024;8(13):3583–3595. doi: 10.1182/bloodadvances.2023012041. - DOI - PMC - PubMed
    1. Shimony S, et al. Acute myeloid leukemia: 2023 update on diagnosis, risk-stratification, and management. Am J Hematol. 2023;98(3):502–526. doi: 10.1002/ajh.26822. - DOI - PubMed
    1. Kumar CC. Genetic abnormalities and challenges in the treatment of acute myeloid leukemia. Genes Cancer. 2011;2(2):95–107. doi: 10.1177/1947601911408076. - DOI - PMC - PubMed
    1. Mattes K, et al. Differential redox-regulation and mitochondrial dynamics in normal and leukemic hematopoietic stem cells: A potential window for leukemia therapy. Crit Rev Oncol Hematol. 2019;144:102814. doi: 10.1016/j.critrevonc.2019.102814. - DOI - PubMed

MeSH terms