. 2025 Apr 8;135(11):e169152.
doi: 10.1172/JCI169152. eCollection 2025 Jun 2.

Preadipocyte IL-13/IL-13Rα1 signaling regulates beige adipogenesis through modulation of PPARγ activity

Affiliations

Preadipocyte IL-13/IL-13Rα1 signaling regulates beige adipogenesis through modulation of PPARγ activity

Alexandra R Yesian et al. J Clin Invest. .

Abstract

Type 2 innate lymphoid cells (ILC2s) regulate the proliferation of preadipocytes that give rise to beige adipocytes. Whether and how ILC2 downstream Th2 cytokines control beige adipogenesis remain unclear. We used cell systems and genetic models to examine the mechanism through which IL-13, an ILC2-derived Th2 cytokine, controls beige adipocyte differentiation. IL-13 priming in preadipocytes drove beige adipogenesis by upregulating beige-promoting metabolic programs, including mitochondrial oxidative metabolism and PPARγ-related pathways. The latter was mediated by increased expression and activity of PPARγ through the IL-13 receptor 1 (IL-13R1) downstream effectors STAT6 and p38 MAPK, respectively. Il13-KO or preadipocyte Il13ra1-KO mice were refractory to cold- or β3-adrenergic agonist-induced beiging in inguinal white adipose tissue, whereas Il4-KO mice showed no defects in beige adipogenesis. Il13-KO and Il13ra1-KO mouse models exhibited increased body weight and fat mass and dysregulated glucose metabolism but had a mild cold-intolerant phenotype, likely due to their intact brown adipocyte recruitment. We also found that genetic variants of human IL13RA1 were associated with BMI and type 2 diabetes. These results suggest that IL-13 signaling-regulated beige adipocyte function may play a predominant role in modulating metabolic homeostasis rather than in thermoregulation.

Keywords: Adipose tissue; Cell biology; Glucose metabolism; Metabolism; Obesity.


Figures

Figure 1
Figure 1. IL-13/IL-13R1 regulates beige adipocyte recruitment.
(A) Core body temperature of 8-week-old female WT and Il13-KO mice during a 72-hour cold challenge at 4°C. n = 6 WT mice; n = 5 Il13-KO mice. The experiment was repeated in 2 separate cohorts. (B) Immunoblots showing protein levels of UCP1 and mitochondrial OXPHOS complexes III (UQCRC2), IV (MTCO1), and V (ATP5A) in iWAT of WT and Il13-KO mice. Representative samples from 3 mice/group are shown. (C) Representative H&E staining of iWAT from the mice in A. Scale bar: 200 μm. (D) Core body temperature of 5- to 7-week-old control and pIl13ra1-KO mice during the cold challenge at 4°C. n = 5/group. The experiment was performed in 1 cohort. (E) Immunoblots showing protein levels of UCP1 and mitochondrial OXPHOS complexes II, III, and V in iWAT of control and pIl13ra1-KO mice after the cold exposure in D. Representative samples from 4 mice/group are shown. (F) Representative H&E staining of iWAT and (G) mRNA expression of pIl13ra1 and thermogenic genes measured by RT-qPCR in subcutaneous adipose tissue of the cold-exposed control and pIl13ra1-KO mice in D. n = 5/group. Scale bar: 200 μm. All values are presented as the mean ± SEM. *P < 0.05, **P < 0.01, and ***P < 0.001, by 2-way ANOVA (A and D) and 2-tailed, unpaired t test (G). Tubb, tubulin (loading control).
Figure 2
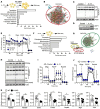
Figure 2. Regulation of mitochondria-related metabolic programs by IL-13 in preadipocytes enhances the oxidative capacity of mature adipocytes.
(A) WT preadipocytes were treated with IL-13 or vehicle for 24 hours before induction of differentiation for 6 days, followed by RNA-Seq analysis. The top enriched categories upregulated by IL-13 pretreatment are shown. RNA-Seq was performed once but was repeated in a separate clonal line (n = 4). Bioinformatics was processed using the CLC Genomics Workbench. (B) STRING protein-protein interaction map of genes in the KEGG thermogenesis pathway upregulated by IL-13 pretreatment. (C) Immunoblotting of mitochondrial OXPHOS complex proteins in WT adipocytes (n = 3; 3-day differentiation; experiments were repeated twice) and (D) UCP1 protein in mature WT adipocytes (n = 2; 6-day differentiation) with or without IL-13 pretreatment. (E) Mitochondrial respiration of mature WT adipocytes with or without IL-13 pretreatment. CL, CL316,243. n = 10; experiments were repeated 3 times. (F) WT preadipocytes were treated with IL-13 or vehicle for 24 hours, followed by RNA-Seq. The top enriched categories upregulated by IL-13 are shown (n = 4). (G) STRING protein-protein interaction map of genes in the KEGG thermogenesis pathway upregulated by IL-13 treatment in preadipocytes. (H) Immunoblotting showing PPARγ and mitochondrial OXPHOS complex proteins by IL-13 in WT preadipocytes. n = 3/group. Experiments repeated more than 3 times. (I) Mitochondrial respiration of WT preadipocytes treated with IL-13 for 24 hours. n = 5; experiments were repeated 3 times. (J) Mitochondrial respiration of primary preadipocytes treated with IL-13 for 24 hours. n = 10; experiments were repeated twice. (K) RT-qPCR analyses to assess the expression of OXPHOS and PPARγ target genes in iWAT of WT and Il13-KO mice. n = 6 WT and 5 Il13-KO 8-week-old female mice. *P <0.05 and **P < 0.01, by 2-way ANOVA (E, I, and J) and 2-tailed, unpaired t test (K).
Figure 3
Figure 3. IL-13 potentiates PPARγ-mediated beige adipogenesis.
(A) Immunoblot of PPARγ protein in Il13ra1-KO and Il13ra1-RE preadipocytes treated with IL-13 or vehicle for 24 hours. n = 3, experiment repeated twice. (B) RT-qPCR of Pparg1 and PPARγ target genes in Il13ra1-KO and Il13ra1-RE preadipocytes treated with or without IL-13 for 24 hours. n = 3, experiment performed 3 times. (C) RT-qPCR of Pparg and PPARγ target genes in WT preadipocytes with indicated treatments for 24 hours. n = 3, experiment performed 4 times. (D) RT-qPCR analyses of WT cells with indicated treatments for 24 hours, followed by 2 days of differentiation. n = 3, experiments performed 3 times. (E) Immunoblotting in WT cells with indicated treatments for 24 hours, followed by differentiation for 5 days. n = 3/condition, experiments repeated twice. (F) WT preadipocytes were transfected with a Gal4 control or Gal4-PPARγ-LBD expression vector, together with a Gal4-binding site containing luciferase reporter and a β-gal internal control. Graph shows PPARγ LBD transactivation on the luciferase reporter with indicated treatments for 24 hours. Luciferase activity was normalized to β-gal activity to determine the RLU. n = 4, experiments performed 3 times. (G) Schematic shows 2 sets of ChIP primer pairs (C1 and C2) flanking 2 potential PPREs on the Lipe gene promoter ( the transcriptional start site designated as 1). Arrows indicate 2 direct repeats of the PPRE. Graphs show ChIP analyses of preadipocytes treated overnight with indicated treatments and of adipocytes differentiated for 3 days after overnight Rosi or IL-13+Rosi pretreatment using antibodies against the IgG control, PPARγ, or H3ac. n = 3 technical replicates, experiments performed 3 times. *P < 0.05, **P < 0.01, ***P < 0.001, and ****P < 0.0001, by 2-way ANOVA with Tukey’s multiple-comparison test (B) and 1-way ANOVA with Tukey’s multiple-comparison test (C and D).
Figure 4
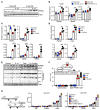
Figure 4. IL-13/IL-13R1 increases the expression and activity of PPARγ through STAT6 and p38 MAPK.
(A) Schematic of the 1-hybrid system to assess PGC-1α coactivation on PPARγ LBD activity. AD293 cells were transfected with Gal4-PPARγ-LBD and Ppargc1 expression vector, together with Gal4 binding site containing a luciferase reporter and β-gal as an internal control. Graph shows quantification of PPARγ LBD transactivation on the luciferase reporter in AD293 cells cotransfected with 0, 2.5, or 10 ng Ppargc1a expression vector in the presence of vehicle or P38i (10 μM). Luciferase activity was measured 48 hours after transfection and normalized to β-gal activity to determine the RLU. n = 3. The experiment was performed 3 times. (B) Quantification of PPARγ LBD transactivation in AD293 cells cotransfected with luciferase/β-gal reporters, Gal4-PPARγ-LBD, and a control vector or Ppargc1a expression vector (10 ng). Cells were treated with vehicle, IL-13, P38i, or IL-13+P38i overnight. RLU was determined 48 hours after transfection. n = 3. The the experiment was performed 3 times. (C and D) Expression of PPARγ target genes measured by RT-qPCR in WT preadipocytes treated with IL-13, Rosi, or IL-13+Rosi for 24 hours with or without P38i. n = 3. The experiment was performed twice. (E and F) Expression of PPARγ target genes by RT-qPCR in WT preadipocytes treated with IL-13, Rosi, or IL-13+Rosi for 24 hours ± STAT6i (10 μM). n = 3. The experiment was performed once. (G) Immunoblotting showing HSL protein in preadipocytes treated with IL-13+Rosi or vehicle with or without P38i for 24 hours. n = 3, with quantifications shown. The experiment was performed twice. (H) Immunoblotting showing HSL protein in WT preadipocytes treated with IL-13+Rosi or vehicle with or without STAT6i for 24 hours. n = 3, with quantifications shown. The experiment was performed twice. *P < 0.05, **P < 0.01, ***P < 0.001, and ****P < 0.0001, by 2-way ANOVA (A and B), 2-way ANOVA with Tukey’s multiple-comparison test (CF), and 1-way ANOVA with Tukey’s multiple-comparison test (G and H).
Figure 5
Figure 5. Adult mice deficient in IL-13 signaling exhibit impaired responses to β3-adrenergic stimulation.
(A) Representative H&E staining of iWAT from WT and Il13-KO mice injected with PBS or CL for 10 days. n = 3–4/group (3-month-old males). The experiment was performed once. (B) Immunoblotting showing UCP1 protein levels in iWAT of the WT and Il13-KO mice in A. Tubulin was used as a loading control. (C) H&E staining and (D) immunoblotting of iWAT from control and Il13ra1-KO mice injected with CL for 10 days. n = 4 (30-week-old males). For H&E-stained images, samples from 1 mouse of each group are shown, with HSP60 used as a loading control. (E) H&E staining and (F) immunoblotting of iWAT from control and bIl13ra1-KO mice injected with or without CL once daily for 7 consecutive days. n = 3 for noninjected control mice; n = 6–7 for CL-injected mice (5-month-old females). The experiment was performed once. Representative tissue samples are shown. (G) Immunoblotting for HSL, p-HSL (S660), and p-PKA substrates in iWAT explants from control and bIl13ra1-KO mice. Tissue was stimulated with CL for 0, 20, 40, and 60 minutes ex vivo. Pooled analysis of 2 mice/genotype (5-month-old females). The experiment was performed 3 times. Scale bars: 200 μm (A, C, and E).
Figure 6
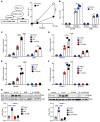
Figure 6. Il13ra1 is associated with body weight.
(A) Variants located at the IL13RA1 gene showing genome-wide significant associations with BMI in a multiethnic population, based on X chromosome GWAS results from a GIANT Consortium study. The regional association plot was generated by LocusZoom (https://my.locuszoom.org/) (66) on –log10 P values for variant-trait associations. Each dot is a variant; the diamond-shaped dot indicates the lead variant with the smallest P value. Dot colors indicate LD relationships (r2) between all variants and the lead variants. The minor allele frequency is not included. (B) Gene expression levels of IL13RA1 (log-transformed transcripts per million) in 4 human tissues, in women and men, based on data from the GTEx Portal (50). (C) Body weight and (D) fat tissue weight normalized to the body weight of WT and Il13ra1-KO mice. n = 6/genotype (20-week-old males). (E) Intraperitoneal glucose tolerance test (GTT) of WT and Il13ra1-KO mice. n = 5–6 per group (5-month-old mice). Experiments in CE were repeated in 2 separate cohorts. (F) Body weight and (G) fat tissue weight normalized to the body weight of control and pIl13ra1-KO mice. n = 5/group (5- to 7-week-old males). (H) GTT of WT and pIl13ra1-KO mice. n = 7/group (20-week-old females). The experiment was performed in 1 cohort. *P < 0.05, by 2-tailed, unpaired t test (C, D, F, and G) and 2-way ANOVA (E and H).

Comment in

  • IL-13 priming in precursors drives beige adipogenesis and enhances metabolic homeostasis

References

    1. Larsson SC, Burgess S. Causal role of high body mass inDex in multiple chronic diseases: a systematic review and meta-analysis of Mendelian randomization studies. BMC Med. 2021;19(1):320. doi: 10.1186/s12916-021-02188-x. - DOI - PMC - PubMed
    1. Bartelt A, Heeren J. Adipose tissue browning and metabolic health. Nat Rev Endocrinol. 2014;10(1):24–36. doi: 10.1038/nrendo.2013.204. - DOI - PubMed
    1. Kajimura S, et al. Brown and beige fat: physiological roles beyond heat generation. Cell Metab. 2015;22(4):546–559. doi: 10.1016/j.cmet.2015.09.007. - DOI - PMC - PubMed
    1. Zhang F, et al. An adipose tissue atlas: an image-guided identification of human-like BAT and beige depots in rodents. Cell Metab. 2018;27(1):252–262. doi: 10.1016/j.cmet.2017.12.004. - DOI - PMC - PubMed
    1. Saito M, et al. High incidence of metabolically active brown adipose tissue in healthy adult humans: effects of cold exposure and adiposity. Diabetes. 2009;58(7):1526–1531. doi: 10.2337/db09-0530. - DOI - PMC - PubMed