. 2025 Apr 8;135(12):e180724.
doi: 10.1172/JCI180724. eCollection 2025 Jun 16.

Adeno-associated virus expressing a blood-brain barrier-penetrating enzyme improves GM1 gangliosidosis in a preclinical model

Affiliations

Adeno-associated virus expressing a blood-brain barrier-penetrating enzyme improves GM1 gangliosidosis in a preclinical model

Saki Kondo Matsushima et al. J Clin Invest. .

Abstract

GM1 gangliosidosis is a lysosomal storage disorder (LSD) caused by genetic defects in lysosomal β-galactosidase (β-gal). The primary substrate of β-gal is GM1 ganglioside (GM1), a sialylated glycosphingolipid abundant in the central nervous system (CNS). Deficiency in β-gal causes GM1 to accumulate in neural cells, leading to a rapid decline in psychomotor functions, seizures, and premature death. There is currently no therapy available. Although enzyme replacement therapy has been approved for other LSDs, its effects on the CNS are limited owing to the blood-brain barrier (BBB). Here, we assessed the therapeutic efficacy of a systemic infusion of an adeno-associated virus vector carrying a gene expressing a BBB-penetrable enzyme under the control of a liver-specific promoter in GM1 gangliosidosis model mice. The BBB-penetrable enzyme consisted of the variable region of the anti-transferrin receptor antibody fused with β-gal. The BBB-penetrable enzyme was only produced in the liver and secreted into the blood, which was efficiently distributed to various organs, including the brain. GM1 accumulation in the CNS was completely normalized, with improved neurological functions and animal survival. This therapeutic approach is expected to be applied for the treatment of several hereditary neurological diseases with CNS involvement.

Keywords: Gene therapy; Genetics; Lysosomes; Therapeutics.


Conflict of interest statement

Conflict of interest: MK, HT, SI, and HS are employees of and/or stockholders in JCR Pharmaceuticals Co. Ltd. (Japan).

Figures

Figure 1
Figure 1. β-Gal activity in systemic organs.
β-Gal activity in various tissues was analyzed at 23 weeks after treatment: (A) serum (n = 10 for NT group, n = 12 for G-High group, n = 13 for G-Low, T-Low, and T-High groups, n = 17 for WT group), (B) liver, (C) spleen, (D) heart, (E) cerebrum, (F) cerebellum, and (G) hippocampus (n = 6 for G-High group, n = 7 for G-Low, T-Low, T-High, and NT groups, n = 8 for WT group). The β-gal activity was expressed as nanomoles per hour per milliliter of serum and as nanomoles per hour per milligram of protein in tissues. One mouse in the T-Low group did not show any increase in β-gal activity in all organs we measured after treatment, resulting in a large error bar. G-Low, 1 × 10¹² vg/kg of AAV-β-gal treatment; G-High, 5 × 10¹² vg/kg of AAV-β-gal treatment; T-Low, 1 × 10¹² vg/kg of AAV-Tβ-gal treatment; T-High, 5 × 10¹² vg/kg of AAV-Tβ-gal treatment; NT, nontreated GM1 mice; WT, wild-type mice. Results are shown as means ± SD. Significance was evaluated by a 1-way or 2-way ANOVA followed by Dunnett’s multiple-comparison test. *P < 0.05, **P < 0.005, ****P < 0.0001 vs. NT.
Figure 2
Figure 2. GM1 content storage in the CNS.
GM1 storage of the cerebrum, cerebellum, and hippocampus was evaluated by LC-MS/MS and immunostaining. (AC) GM1 content in the cerebrum (A), cerebellum (B), and hippocampus (C) measured by LC-MS/MS (n = 6 for G-High group, n = 7 for G-Low, T-Low, T-High, and NT groups, n = 11 for WT group). One mouse in the T-Low group did not show any increase in β-gal activity in all organs we measured after treatment, resulting in a large error bar. (DG) Immunostaining of selected brain regions: M1 region of cerebrum (D), cerebellum (E), and cornu ammonis 1 (CA1) (F) and dentate gyrus (DG) (G) regions of hippocampus. Green, CTB-X staining; blue, NeuN staining. Representative images are shown following staining of 3 per group. Scale bars: 50 μm. G-Low, 1 × 10¹² vg/kg of AAV-β-gal treatment; G-High, 5 × 10¹² vg/kg of AAV-β-gal treatment; T-Low, 1 × 10¹² vg/kg of AAV-Tβ-gal treatment; T-High, 5 × 10¹² vg/kg of AAV-Tβ-gal treatment; NT, nontreated GM1 mice; WT, wild-type mice. Results are shown as means ± SD. Significance was evaluated by a 1-way ANOVA followed by Dunnett’s multiple-comparison test. ***P < 0.001, ****P < 0.0001 vs. NT.
Figure 3
Figure 3. Neuropathological features.
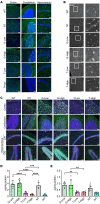
(A) Astrocytosis was evaluated with immunostaining using anti-GFAP antibody. GFAP (green) and DAPI (blue) staining in the cerebrum, cerebellum, and hippocampus. (B) Staining with Iba1 (gray). Images on the right show ×3 zoom of white boxes in overview images. (C) Staining with LAMP1 (green), NeuN (red), and DAPI (blue). Representative images are shown following staining of 3 per group. (D and E) Quantification of cytokines MIP-1a and IP-10 in the brain at 33 weeks of age (n = 6 per groups). G-Low, 1 × 10¹² vg/kg of AAV-β-gal treatment; G-High, 5 × 10¹² vg/kg of AAV-β-gal treatment; T-Low, 1 × 10¹² vg/kg of AAV-Tβ-gal treatment; T-High, 5 × 10¹² vg/kg of AAV-Tβ-gal treatment; NT, nontreated GM1 mice; WT, wild-type mice. Scale bars: 50 μm and 25 μm (×3 zoom). Results are shown as means ± SD. Significance was evaluated by a 1-way ANOVA followed by Tukey’s multiple-comparison test. **P < 0.005, ***P < 0.001, ****P < 0.0001.
Figure 4
Figure 4. T improves several motor performances.
Behavioral evaluation with rotarod test, open-field test, and gait analysis was conducted. (A) Rotarod testing: highest latency achieved on 4–40 rpm accelerating rotarod over 300 seconds over 3 trials (n = 8 for T-Low group, n = 10 for G-Low, T-High, and NT groups, n = 11 for G-High group, n = 19 for WT group). (BD) Open-field test. Total distance traveled (B), rearing number (C), and moving speed (D) were analyzed (n = 8 for T-Low group, n = 9 for G-Low and T-High groups, n = 11 for G-High group, n = 10 for NT group, n = 19 for WT group). (E) Gait analysis (n = 12 for T-Low group, n = 15 for T-High and NT groups, n = 18 for G groups, n = 21 for WT group). Footprints were evaluated for stride length/body length ratio. G-Low, 1 × 10¹² vg/kg of AAV-β-gal treatment; G-High, 5 × 10¹² vg/kg of AAV-β-gal treatment; T-Low, 1 × 10¹² vg/kg of AAV-Tβ-gal treatment; T-High, 5 × 10¹² vg/kg of AAV-Tβ-gal treatment; NT, nontreated GM1 mice; WT, wild-type mice. Results are shown as means ± SEM. Significance was evaluated by a 1-way ANOVA followed by Tukey’s or Dunnett’s multiple-comparison test. *P < 0.05, **P < 0.005, ****P < 0.0001.
Figure 5
Figure 5. T treatment improves survival of GM1 mice.
Body weight (A) and Kaplan-Meier survival analysis (B) of T-treated GM1 mice are shown. (A) Body weights are shown as means ± SD (26 weeks: n = 14 for NT and T groups, n = 15 for G groups, n = 19 for WT group; 34 weeks: n = 16 for NT and T groups, n = 17 for G groups, n = 23 for WT group). (B) For survival analysis, mice were allowed to survive until 730 days or greater than 15% body weight loss relative to the highest weight achieved for each animal (n = 5 for T-High group, n = 6 for G-Low group, n = 7 for G-High, T-Low, and NT groups, n = 9 for WT group). G-Low, 1 × 10¹² vg/kg of AAV-β-gal treatment; G-High, 5 × 10¹² vg/kg of AAV-β-gal treatment; T-Low, 1 × 10¹² vg/kg of AAV-Tβ-gal treatment; T-High, 5 × 10¹² vg/kg of AAV-Tβ-gal treatment; NT, nontreated GM1 mice; WT, wild-type mice; HZ, heterozygote mice. Significance was evaluated by a 1-way ANOVA followed by Dunnett’s multiple-comparison test and log-rank (Mantel-Cox) test. *P < 0.05 vs. NT.

References

    1. Schultz ML, et al. Clarifying lysosomal storage diseases. Trends Neurosci. 2011;34(8):401–410. doi: 10.1016/j.tins.2011.05.006. - DOI - PMC - PubMed
    1. Okada S, O’Brien JS. Generalized gangliosidosis: beta-galactosidase deficiency. Science. 1968;160(3831):1002–1004. doi: 10.1126/science.160.3831.1002. - DOI - PubMed
    1. O’Brien JS, et al. Generalized gangliosidosis: another inborn error of ganglioside metabolism? Am J Dis Child. 1965;109:338–346. doi: 10.1001/archpedi.1965.02090020340014. - DOI - PubMed
    1. Suzuki K. Cerebral GM1-gangliosidosis: chemical pathology of visceral organs. Science. 1968;159(3822):1471–1472. doi: 10.1126/science.159.3822.1471. - DOI - PubMed
    1. Sinigerska I, et al. Founder mutation causing infantile GM1-gangliosidosis in the Gypsy population. Mol Genet Metab. 2006;88(1):93–95. doi: 10.1016/j.ymgme.2005.12.009. - DOI - PubMed