. 2025 May;301(5):108480.
doi: 10.1016/j.jbc.2025.108480. Epub 2025 Apr 6.

The evolution of AKAPs and emergence of PKA isotype selective anchoring determinants

Affiliations

The evolution of AKAPs and emergence of PKA isotype selective anchoring determinants

Jerome I Falcone et al. J Biol Chem. 2025 May.

Abstract

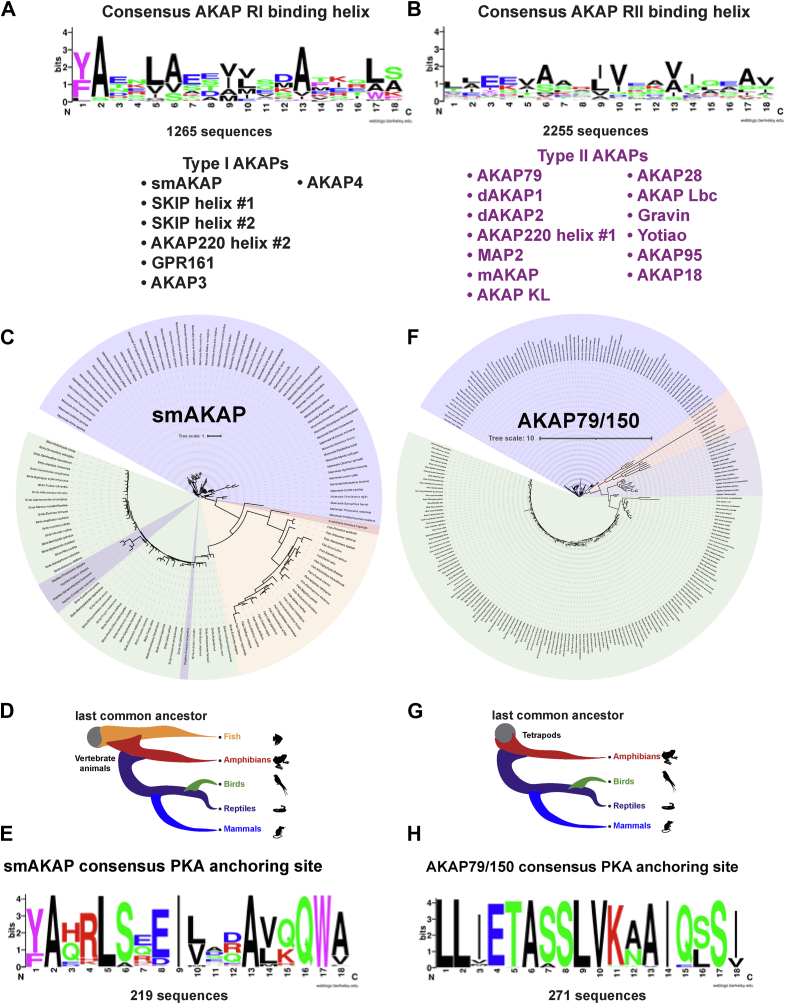
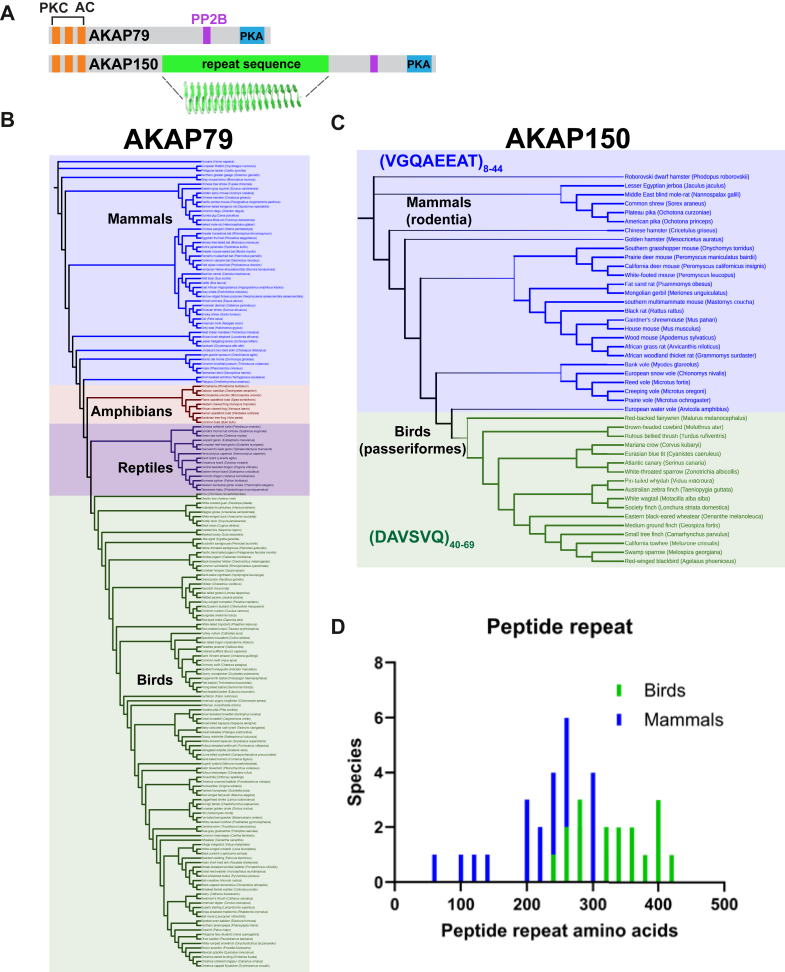
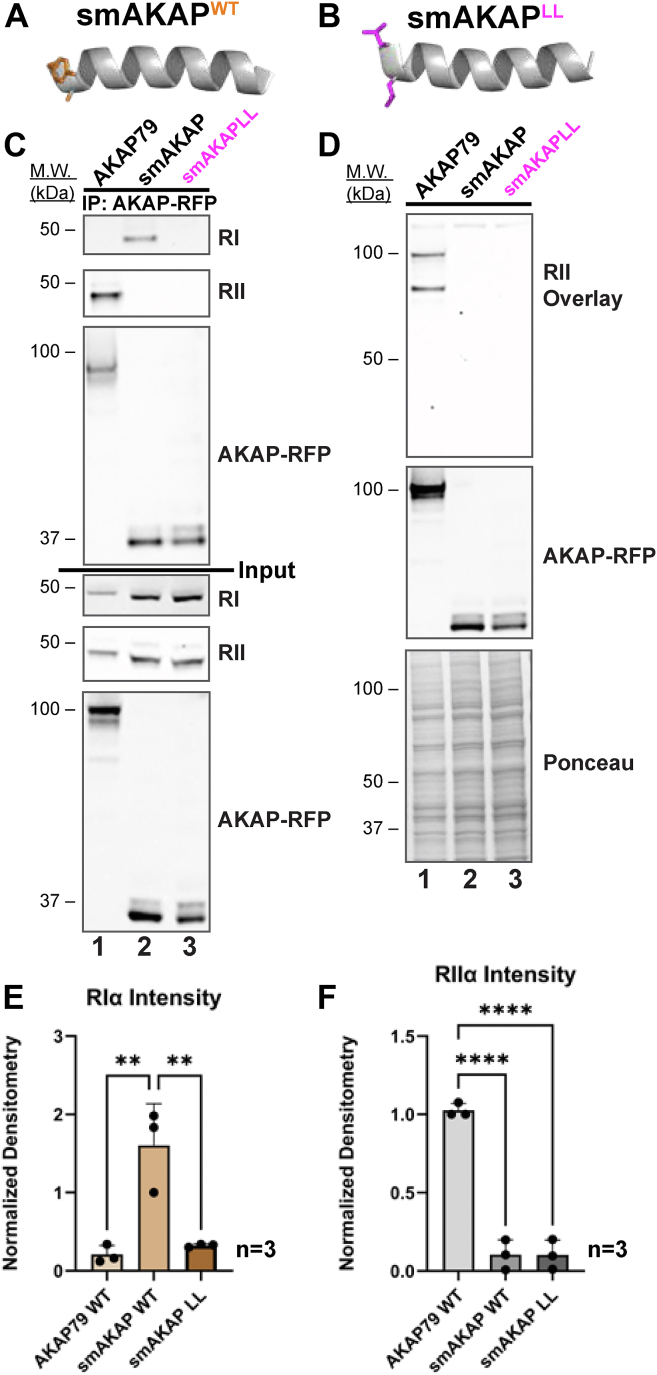
Cyclic AMP is a versatile signaling molecule utilized throughout the eukaryotic domain. A frequent use is to activate protein kinase A (PKA), a serine/threonine kinase that drives many physiological responses. Spatiotemporal organization of PKA occurs though association with A-kinase anchoring proteins (AKAPs). Sequence alignments and phylogenetic analyses trace the evolution of PKA regulatory (R) and catalytic (C) subunits and AKAPs from the emergence of metazoans. AKAPs that preferentially associate with the type I (RI) or type II (RII) regulatory subunits diverged at the advent of the vertebrate clade. Type I PKA anchoring proteins including smAKAP contain an FA motif at positions 1 and 2 of their amphipathic binding helices. Fluorescence recovery after photobleaching measurements indicate smAKAP preferentially associates with RI (T 1/2. 4.37 ± 1.2 s; n = 3) as compared to RII (T 1/2. 2.19 ± 0.5 s; n = 3). Parallel studies measured AKAP79 recovery half times of 8.74 ± 0.3 s (n = 3) for RI and 14.42 ± 2.1 s (n = 3) and for RII, respectively. Introduction of FA and AF motifs at either ends of the AKAP79 helix biases the full-length anchoring protein toward type I PKA signaling to reduce corticosterone release from adrenal cells by 61.5 ± 0.8% (n = 3). Conversely, substitution of the YA motif at the beginning of the smAKAP helix for a pair of leucine's abrogates RI anchoring. Thus, AKAPs have evolved from the base of the metazoan clade into specialized type I and type II PKA anchoring proteins.

Keywords: AKAP; amphipathic helix; evolution; protein kinase A; signal transduction.


Conflict of interest statement

Conflicts of interests The authors declare that they have no conflicts of interests with the contents of this article.

Figures

Figure 1
Figure 1
AKAP and PKA evolutionary history. A cladogram displays the emergence of AKAPs and PKA subunits throughout Metazoan evolution. Clade names indicate the origin of a protein, as well as numbers in parentheses denoting the number of proteins to emerge in this clade. PKAc subunits (green dots), RI subunits (gold dots), RI subunits (silver dots), AKAPs (magentadots). Inset 1: smAKAP helix (magenta) docked to RIα D/D (tan). Inset 2: AKAP79 helix (magenta) docked to RIIα D/D (gray).
Figure 2
Figure 2
Type I and II AKAPs.A, consensus logos of 1265 type I AKAP helices, revealing a conserved FA motif (97.7% conservation with F/Y). The AKAPs used are listed below. B, consensus logos of 2255 type II AKAP helices. C, phylogenetic tree of smAKAP orthologs. D, cladogram showing the smAKAP distribution among vertebrates. E, consensus logo of 219 smAKAP ortholog helices. F, phylogenetic tree of AKAP79/150 orthologs. G, cladogram of AKAP79/150 distribution across tetrapods. H, consensus logo of 271 AKAP79/150 ortholog helices.
Figure 3
Figure 3
FRAP analysis of smAKAP and AKAP79.A, schematic of the TIRF-FRAP paradigm (left) and a representative recovery graph (right). Tighter AKAP-binding results in a slower recovery of the photobleached R subunits. B, representative FRAP recovery curves of free R subunits RIα (gold) and RIIα (silver), displayed as mean ± SEM (n = 50). Mean ± SD recovery half-times included. C, recovery half times of free RIα (gold) and RIIα (silver). D, recovery rate constants of free RIα (gold) and RIIα (silver). Means ± SD (n = 3) Student's t test: ∗p < 0.05, ∗∗p < 0.005. E, time course of photobleaching of smAKAP-bound RIα (top) and RIIα (bottom) over 3 s. F, representative FRAP recovery curves of smAKAP-bound R subunits RIα (gold) and RIIα (silver) displayed as mean ± SEM (n = 50). Mean ± SD recovery half-times included. G, time course of photobleaching of AKAP79-bound RIα (top) and RIIα (bottom) over 7 s. H, representative FRAP recovery curves of AKAP79-bound R subunits RIα (gold) and RIIα (silver) displayed as mean ± SEM (n = 50). Mean ± SD recovery half-time values included. I, recovery half-time of smAKAP (left) and AKAP79 (right) bound RIα (gold) and RIIα (silver). J, recovery rate constants of smAKAP (left) and AKAP79 (right) bound RIα (gold) and RIIα (silver). Means ± SD (n = 3). Student's t test: ∗p < 0.05, ∗∗p < 0.005.
Figure 4
Figure 4
AKAP79/150 repeat analysis.A, diagram of domains on AKAP79 and AKAP150. Individual enzyme binding regions (adenylyl cyclase, AC), (PKC), (protein phosphatase, PP2B), (protein kinase A, PKA) are indicated. Anchoring domains are conserved, but AKAP150 contains a unique a beta-helical peptide repeat. B, cladogram of AKAP79-containing species present in all tetrapod classes. C, cladogram of AKAP150-containing species. AKAP150 restricted to the Passerine bird order and the rodent mammal order, with distinct repeat sequences: VGQAEEAT for rodents and DAVSVQ for birds. Repeat number varies by species. D, histogram of the repeat lengths (amino acids) for both passerine (green) and rodent (blue) forms, with passerine repeats being longer due to containing more repeating units.
Figure 5
Figure 5
AKAP79/AKAP150 PKA binding analysis.A, Alphafold 3 model of AKAP79 bound to the type II PKA holoenzyme, demonstrating the close positioning of regulatory subunits. B, AKAP150 modeled with type II PKA holoenzyme. The octapeptide repeat helix wedges between the two regulatory subunits, creating an extended conformation. C and D, representative FRAP recovery curves of AKAP79 (C) and AKAP150 (D) bound RIα (gold) and RIIα (silver), displayed as mean ± SEM (n = 50). Mean ± SD recovery half time values included. E, recovery half times of AKAP79 (left) and AKAP150 (right) bound RIα (gold) and RIIα (silver). F, recovery rate constants of AKAP79 (left) and AKAP150 (right) bound RIα (gold) and RIIα (silver). Means ± SD (n = 3). One-way ANOVA with Tukey's multiple comparisons test: ∗∗p < 0.01, ∗∗∗p < 0.00, ∗∗∗∗p < 0.0001.
Figure 6
Figure 6
AKAP79 PKA preference switch.A, full-length GFP-tagged AKAP79WT, AKAP79FA, AKAP79AF, and AKAP79FAAF mutants were immunoprecipitated from HEK293T cells, and RI and RII coprecipitation was analyzed via immunoblot. Antibody incompatibility caused the detection of an IgG band above the RI bands (top panel). Only AKAP79FAAF precipitates RI. Both AKAP79FA and AKAP79FAAF show reduced RII binding. B, quantification of RI pulldown bands, normalized to background. AKAP79FAAF has a band intensity 3.55 times higher than the other mutants. C, quantification of RII pulldown by AKAP mutants. Data are shown as mean ± SD. One-way ANOVA with Tukey's multiple comparisons test: ∗p < 0.05. N-terminal helices contribute to reduced RII binding. D and E, ΔG contributions of AKAP helical amino acids from molecular dynamics (MD) experiments. Residues colored on a gradient from blue (more negative ΔG; stronger binding) to magenta (more positive ΔG; weaker binding). AKAP79FAAF shows a switch in preference from RIIα to RIα. F and G, representative FRAP recovery curves of AKAP79WT (F) and AKAP79FAAF (G) bound RIα (gold) and RIIα (silver). FRAP curves displayed as mean ± SEM (n = 50). Mean ± SD recovery half-time values included. H and I, recovery half-times from three replicate FRAP experiments. H, RIα recovery half times from AKAP79WT (tan) and AKAP79FAAF (brown). I, RIIα recovery half times from AKAP79WT (gray) and AKAP79FAAF (slate). J and K, recovery rate constants from three replicate FRAP experiments. J, RIα rate constants from AKAP79WT (tan) and AKAP79FAAF (brown). K, RIIα rate constants from AKAP79WT (gray) and AKAP79FAAF (slate). Data are presented as mean ± SD (n = 3). Student's t test: ∗∗∗p < 0.0005, ∗∗∗∗p < 0.0001.
Figure 7
Figure 7
The amino terminal aromatic motif is necessary for smAKAP interaction with RI.A and B, models depicting the anchoring helix of smAKAP WT (orange side chains) and the smAKAPLL mutant (magenta side chains). Full-length mRFP-tagged AKAP79, smAKAP, and smAKAPLL were immunoprecipitated from HEK293T cells. C, coprecipitation of RI (top) or RII (upper) was analyzed by immunoblot. Only smAKAP precipitates with RI. Neither smAKAP or the LL mutant interact with RII. Coprecipitation of RII with WT AKAP79 served as a loading control. Molecular weight markers and loading controls are indicated. D, full-length mRFP-tagged AKAP79, smAKAP, and smAKAPLL were immunoprecipitated from HEK293T cells. Top: interaction with RII was assessed by RII overlay. Mid: immunoblot detection of AKAP-RFP confirmed equivalent levels of each anchoring protein. bottom: ponceau staining demonstrated protein expression of cell lysates. Molecular markers are indicated. E and F, quantification of (E) RI coprecipitation and (F) RII overlay with AKAP variants from three independent experiments. Data are shown as mean ± SD. One-way ANOVA with Tukey's multiple comparisons test: ∗∗p < 0.005, ∗∗∗∗p < 0.0001.
Figure 8
Figure 8
Rescue of Cushing's syndrome by AKAP79FAAF. A, model depicting how AKAP79FAAF restores corticosterone release in Cushing's syndrome. PKAcW196G is displaced from type II PKA holoenzymes, such as those bound by AKAP79WT (orange). Mislocalized PKAc drives ectopic phosphorylation of mitochondrial substrates. Membrane relocalization of the type I holoenzyme subunit by AKAP79FAAF (magenta) separates the mutant C subunit from the mitochondria, reducing corticosterone release. B, normalized corticosterone levels measured from ATC7L PKAcW196G cells stably expressing either AKAP79WT (orange) or AKAP79FAAF (magenta). Data are presented as mean ± SD (n = 3). Student's t test: ∗∗p < 0.005.

Similar articles

References

    1. Turnham R.E., Scott J.D. Protein kinase A catalytic subunit isoform PRKACA; History, function and physiology. Gene. 2016;577:101–108. - PMC - PubMed
    1. Blanco E., Fortunato S., Viggiano L., de Pinto M.C. Cyclic AMP: a polyhedral signalling molecule in plants. Int. J. Mol. Sci. 2020;21:4862. - PMC - PubMed
    1. Langeberg L.K., Scott J.D. Signalling scaffolds and local organization of cellular behaviour. Nat. Rev. Mol. Cell Biol. 2015;16:232–244. - PMC - PubMed
    1. Krebs E.G., Blumenthal D.K., Edelman A.M., Hales C.N. In: Mechanisms of Receptor Regulation. Crooke S.T., Poste G., editors. Plenum; New York: 1985. The functions of the cAMP-dependent protein kinase; pp. 324–367.
    1. Bos J.L. Epac: a new cAMP target and new avenues in cAMP research. Nat. Rev. Mol. Cell Biol. 2003;4:733–738. - PubMed

MeSH terms

Substances

LinkOut - more resources