. 2025 Apr 9;16(1):3346.
doi: 10.1038/s41467-025-58450-w.

Generation of induced alveolar assembloids with functional alveolar-like macrophages

Affiliations

Generation of induced alveolar assembloids with functional alveolar-like macrophages

Ji Su Kang et al. Nat Commun. .

Abstract

Within the human lung, interactions between alveolar epithelial cells and resident macrophages shape lung development and function in both health and disease. To study these processes, we develop a co-culture system combining human pluripotent stem cell-derived alveolar epithelial organoids and induced macrophages to create a functional environment, termed induced alveolar assembloids. Using single-cell RNA sequencing and functional analyses, we identify alveolar type 2-like cells producing GM-CSF, which supports macrophage tissue adaptation, and macrophage-like cells that secrete interleukin-1β and interleukin-6, express surfactant metabolism genes, and demonstrate core immune functions. In response to alveolar epithelial injury, macrophage-like cells efficiently eliminate damaged cells and absorb oxidized lipids. Exposure to bacterial components or infection with Mycobacterium tuberculosis reveals that these assembloids replicate key aspects of human respiratory defense. These findings highlight the potential of induced alveolar assembloids as a platform to investigate human lung development, immunity, and disease.


Conflict of interest statement

Competing interests: The authors declare no competing interests.

Figures
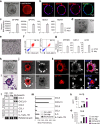
Fig. 1
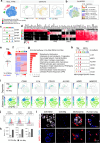
Fig. 1. Characterization of iAEOs, iMφ, and iAlvAssemb.
a Representative phase-contrast and lysotracker fluorescence images of iAEOs. Three independent experiment was repeated independently with similar results. b Representative immunostaining images showing the expression of the alveolar epithelial markers (NKX2.1, SFTPB, SFTPC, HOPX) in iAEOs. c Relative mRNA expression level of alveolar epithelial markers (SFTPB, SFTPC, MUC1, HOPX) in iAEOs and undifferentiated hESCs. Data were presented as mean ± SD, technical replicates (n = 3). d Representative TEM image showing lamellar bodies in iAEO. Two independent experiment was repeated independently with similar results. e Representative phase-contrast image of iMφ differentiated from hESCs. More than three independent experiment was repeated independently with similar results. f Representative flow cytometry plots of macrophage markers (CD45, CD14, CD11c) on iMφ. g Relative mRNA expression level of macrophage markers (PTPRC, CD14, IL1β) in iMφ and undifferentiated hESCs. Data were presented as mean ± SD with technical replicates (n = 3). ho iAlvAssemb was created by co-culturing of iAEO and iMφ in KSFM media for 7 days. More than three independent experiment was repeated independently with similar results. h-i. Representative phase-contrast and H&E staining images of iAlvAssemb cultured in KSFM media. j Representative cell membrane-linked fluorescence images (Green) of iMφ and lysotracker fluorescence images (Red) of Alv-iAEOs in AlvAssemb. k Representative immunostaining images showing the expression of the alveolar epithelial markers (SFTPB, SFTPC) and iMφ marker (MAC387) in AlvAssemb. l, m Cytokine blot array images and quantification of secreted cytokines in conditioned media of ctrl-iAEOs, ctrl-iMφ and iAlvAssemb cultured in KSFM media. n, o Quantification of IL1β and IL6 secretion in conditioned media of ctrl-iAEOs, ctrl-iMφ, iAlvAssemb and Human AM. Data were presented as mean ± SD with technical replicates for Ctrl-iMφ (n = 6), iAlvAssemb (n = 6), Ctrl-iAEO (n = 3), and Human AM (n = 3). Statistical analysis was performed using a one-way ANOVA with Dunnett’s multiple comparisons test, and p-value (<0.05) was indicated on the graph.
Fig. 2
Fig. 2. Transcriptional regulation of iAlvAssemb system.
scRNA-seq was performed with ctrl-iAEOs and iAlvAssemb grown in KSFM media with biological replicates (n = 2), and Data was integrated with iMφ data (GSE133935), previously reported. a, b The t-SNE plot represents the clustering of cell populations based on cell type-specific markers (a) and Library ID (b). c, d Violin plot and heatmap represents the log -transformed expression values of cell-type specific markers, including a box plot that highlights the interquartile range (IQR), median, and mean (horizontal line). e Venn diagram showing the numbers of DEGs in in both Mφ and AECs. f Heatmap of DEGs in both Mφ and AECs. g. Representative enriched pathway in DEGs of Mφ and AECs. h Violin plots showing log-transformed expression values of Alv-iMφ-enriched genes, includes a box plot highlighting the interquartile range (IQR), median and mean (horizontal line). i t-SNE plot showing the expression of Alv-iMφ-enriched genes in iAlvAssemb system and human lung tissues. jl ctrl-iMφ, ctrl-iAEO and iAlvAssemb was grown in 50% GFR-matrigel with KSFM medium for 7days. j, k Representative flow cytometry dot-plots and quantitative analysis of macrophage-specific surface markers in ctrl-iMφ, and Alv-iMφ isolated from iAlvAssemb. Data were presented as mean ± SD with technical replicates (n = 3). l Representative immunostaining images showing the expression of the alveolar marker (MUC1) and AM-specific markers (MARCO, MSR1). Two independent experiment was repeated independently with similar results.
Fig. 3
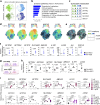
Fig. 3. Tissue adaptation and maturation of iMφ in iAlvAssemb system.
Ctrl-iMφ and iAlvAssemb was grown in 50% GFR-matrigel with KSFM medium for 7 days and Alv- iMφ was isolated from iAlvAssemb. a Schematic images showing the method to isolate Alv-iMφ from iAlvAssemb. b Representative flow cytometry plots of macrophage markers (CD14, CD45) on Ctrl-iMφ and Alv-iMφ. c GSEA-enrichment plot showing gene signature of lung macrophage cells on Ctrl-iMφ and Alv-iMφ. d A scatter plot showing the correlation of gene expression (n = 7080) between induced macrophages (Mono-Mφ, Ctrl-iMφ, Alv-iMφ.) and tissue-resident alveolar macrophages (HBAM, original dataset from GSE174659), normalized relative to monocytes. correlation coefficient (Pearson’s r) and p value was presented in figures. e Sample Distance matrix of indicated samples. f Heatmap of mouse AM-specific gene clusters in the lung from transcriptome data of macrophages in various tissues (left panel, original dataset: GSE63340), Heatmap showing the relative expression of human orthologs of mouse AM-specific genes in ctrl-iMφ and alv-iMφ (right panel). g Relative mRNA expression level of significantly increased genes in undifferented hESC, Ctrl-iMφ, Alv-iMφ, and human lung. Alv-i iMφ was isolated from iAlvAssemb. Data were presented as mean ± SD. Statistical analysis was performed using an unpaired t-test between Ctrl-iMφ (n = 5) and Alv-iMφ (n = 3), biological replicates. P-value (<0.05) was indicated on the graph. h Representative phase-contrast, fluorescence images and quantifications showing phagocytosis ability. Data presented as mean ± SD with technical replicates; Ctrl-iMφ (n = 8), Alv-iMφ (n = 6), and Human AM (n = 5). Human AM (ACCEGEN) were cultured in Human alveolar macrophage media for experimental control. i Representative phase-contrast and lipid analogues (D3823, Green) fluorescence images, and quantifications showing lipid uptake ability. Data were presented as mean ± SD with technical replicates; Ctrl-iMφ (n = 219), Alv-iMφ (n = 185) and Human AM (n = 1058). Statistical analysis was performed using a one-way ANOVA with Dunnett’s multiple comparisons test, and p-value (<0.05) was indicated on the graph.
Fig. 4
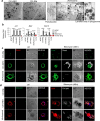
Fig. 4. Phagocytic clearance of damaged AECs by Alv-iMφ.
a Representative TEM images of Ctrl-iAEOs, Ctrl-iMφ, and iAlvAssemb cultured in KSFM media. The left panel shows Ctrl-iAEO with lamellar bodies indicated by solid arrows, while the middle panel presents Ctrl- iMφ. In iAlvAssemb (right panel), iAEO is positioned on the left side of the dashed line, with the recruited iMφ on the right. An inset on the left highlights the extended pseudopodia in iAlvAssemb, while another on the right shows lamellar bodies within the phagosome of iMφ. b Relative mRNA expression level of damage-response genes (p21, BAX, ISG15) by bleomycin treatment for 48 h. Data were presented as mean ± SD with technical replicates; Ctrl-iMφ, Ctrl-AEO, iAlvAssemb (n = 6). Statistical analysis was performed using a two-way ANOVA with Sidak’s multiple comparisons test, and p-value (<0.05) was indicated on the graph. c Representative phase-contrast and live (Green)/dead (Red) fluorescence images by bleomycin treatment for 48 hr in Ctrl-iMφ, Ctrl-iAEOs, and iAlvAssemb. d Representative phase-contrast and peroxidation lipid (Green)/normal lipid (Red) fluorescence images by bleomycin treatment for 48 h in Ctrl-iMφ, Ctrl-iAEOs, and iAlvAssemb.
Fig. 5
Fig. 5. Paracrine effects of GM-CSF in iAlvAssemb system.
a A schematic explanation of parabiotic organoid culture systems. b Relative mRNA expression level of Alv-iMφ-enriched genes (ALOX5, MSR1, CCL4, IL1β, IL8) in the Crtl-iMφ and Alv-iMφ of parabiotic organoid system. Data were presented as mean ± SD with biological replicates (n = 3). Statistical analysis was performed using an unpaired t-test, and p-value (<0.05) was indicated on the graph. c Gene expression of SFTPC, GM-CSF and G-CSF in the AECs in Crtl-iAEO and iAlvAssemb on t-SNE plot of scRNA-seq analysis. d Representative cytokine blot array images of GM-CSF in conditioned media of Crtl-iAEOs, Crtl-iMφ and iAlvAssemb. e Relative mRNA expression level of CSF2R in Crtl-iAEOs, Crtl-iMφ, iAlvAssemb and human lung. Data were presented as mean ± SD with biological replicates (n = 6) for Crtl-iAEOs, Crtl-iMφ, iAlvAssemb and statistical analysis was performed using a one-way ANOVA with Dunnett’s multiple comparisons test. p-value (<0.05) was indicated on the graph. f A schematic explanation of G-CSF or GM-CSF treatment on Ctrl- iMφ. g Relative mRNA expression level of Alv-iMφ-enriched genes in Ctrl-iMφ with or without treatment of G-CSF and GM-CSF at 10 or 100 ng/ml for 7 days. Data were presented as mean ± SD with technical replicates (n = 6) and statistical analysis was performed using a one-way ANOVA with Dunnett’s multiple comparisons test. p- alue (<0.05) was indicated on the graph. h, i Representative immunostaining images showing the expression of AM specific marker (MSR1, Red) and lipid uptake (D3823, Green) in iMφ with or without 100 ng/ml of GM-CSF, and quantification of the F.I. Data were presented as mean ± SD with technical replicates; n (h) = 5, n (i) = 159. Statistical analysis was performed using an unpaired t-test, and p-value (<0.05) was indicated on the graph.
Fig. 6
Fig. 6. The role of GM-CSF on the tissue adaptation of Alv-iMφ.
a Illustration of genomic DNA showing target of the dual guide RNA and genotyping primers used to produce CSF-/- iAEO. b Schematic image showing the strategy for CSF2-/- iAEO generation. c Agarose gel electrophoresis of PCR amplified products for CSF2 genotyping. d Phase contrast images and fluorescence images for Lysotracker staining of CSF2-/- iAEO lines cultured in iAEO media. e Quantification of GM-CSF secretion in conditioned media of WT-, CSF-/- iAEO #1, and #9 lines cultured in KSFM media. Data are presented as mean ± SD with technical replicates (n = 3). ND, not detected. (mp). f Schematic images showing the parabiotic organoid cultures of iMφ with Ctrl-iMφ, wt-iAEO or CSF-/--iAEO in KSFM media for 7 days. g Relative mRNA expression level of Alv-iMφ-enriched genes (IL1β, IL8, CCL4, ALOX5 and MSR1). Data presented as mean ± SD with technical replicates (n = 3). Statistical analysis was performed using a one-way ANOVA with Dunnett’s multiple comparisons test, and p value (<0.05) was indicated on the graph. h. Representative florescence images showing the lipid uptake (D3823, Green) in para-iMφ with WT-, CSF-/- iAEO #1, and #9. i. Quantification of the F.I. Data were presented as mean ± SD with technical replicates; WT (n = 209), #1 (n = 180) and #9 (n = 224). Statistical analysis was performed using a one-way ANOVA with Dunnett’s multiple comparisons test, and p-value (<0.05) was indicated on the graph.
Fig. 7
Fig. 7. Paracrine effects of interleukin to Alv-iAEOs.
a t-SNE plots showing single cell distribution of individual replicates in Crtl-iAEOs and Alv-iAEOs. b, c Representative enrichment pathways in DEG analysis and Violin plots showing log expression level of surfactant metabolism related genes of Alv-iAEOs. Each violin includes a box plot showing the interquartile range (IQR), with horizontal lines indicating the median and mean. d, e Expression of genes related with AT2 cells (SFTPA1, SFTPA2, NAPSA, ABCA3 and IL1R1) (d) and AT1 cells (AGER, CLIC5) (e) on t-SNE. f Relative mRNA expression level of surfactant metabolism (SFTPA1, SFTPA2, SFTPC, SLC34A2 and ABCA3) and immune related genes (IL1R1, LCN2, IL8 and CXCL2) in Ctrl-iAEOs and Alv-iAEOs isolated from iAlvAssemb cultured in KSFM media. Data were presented as mean ± SD with biological replicates; Ctrl-iAEO (n = 5), Alv-iAEO (n = 7). Statistical analysis was performed using an unpaired t-test, and p-value (<0.05) was indicated on the graph. g, h A schematic explanation (h) of parabiotic culture of iAEOs with iMφ in KSFM media for 7 days. h Relative mRNA expression level of surfactant metabolism (SFTPA1, SFTPA2, SFTPC, SLC34A2 and ABCA3) and immune related genes (IL1R1and LCN2) in ctrl-iAEO and para-iAEO. Data were presented as mean ± SD with biological replicates; Ctrl-iAEO (n = 4), Para-iAEO (n = 3). Statistical analysis was performed using an unpaired t-test, and p-value (<0.05) was indicated on the graph. i Relative mRNA expression level of surfactant metabolism (SFTPA1, SFTPA2, SFTPC, SLC34A2 and ABCA3) and immune related genes (IL1R1 and LCN2) in iAEOs with or without IL1β or IL6 in KSFM media for 7days. Data were presented as mean ± SD with technical replicates (n = 3). Statistical analysis was performed using a one-way ANOVA with Dunnett’s multiple comparisons test, and p-value (<0.05) was indicated on the graph.
Fig. 8
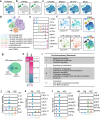
Fig. 8. iAlvAssemb as a disease modeling system with LPS.
a t-SNE Plot of Merged iAlvAssembs with and without 1 ng/ml LPS Treatment for 24 h in KSFM media (K-means clustering). b, c t-SNE Plot showing the expression of genes related with macrophage (PTPRC, CD14) and alveolar epithelial markers (EPCAM, NKX2.1, SFTPC, MUC1). d Cell clustering and cell type annotation of iAlvassemb system. e Violin plots showing the log gene expression of cell type specific markers in each cluster. Each violin includes a box plot showing the interquartile range (IQR), with horizontal lines indicating the median and mean. f t-SNE plots showing the difference in cell clusters based on library id, and expression of CD68 and IL1R1. g, h Venn diagram and heatmap of DEG analysis with LPS-response in AEC and iMφ. i List of enriched Reactome Pathways in iAlvAssemb after LPS treatment. jm Violin plots showing gene expression related with interleukin signaling (j), chemotaxis (k), Mφ (l) and AEC-specific markers (m) after LPS treatment. Each violin includes a box plot showing the interquartile range (IQR), with horizontal lines indicating the median and mean.

References

    1. Zepp, J. A. & Morrisey, E. E. Cellular crosstalk in the development and regeneration of the respiratory system. Nat. Rev. Mol. Cell Biol.20, 551–566 (2019). - PMC - PubMed
    1. Bissonnette, E. Y., Lauzon-Joset, J. F., Debley, J. S. & Ziegler, S. F. Cross-talk between alveolar macrophages and lung epithelial cells is essential to maintain lung homeostasis. Front Immunol.11, 583042 (2020). - PMC - PubMed
    1. Bain, C. C. & MacDonald, A. S. The impact of the lung environment on macrophage development, activation and function: diversity in the face of adversity. Mucosal Immunol.15, 223–234 (2022). - PMC - PubMed
    1. Guillot, L. et al. Alveolar epithelial cells: master regulators of lung homeostasis. Int J. Biochem Cell Biol.45, 2568–2573 (2013). - PubMed
    1. Allard, B., Panariti, A. & Martin, J. G. Alveolar macrophages in the resolution of inflammation, tissue repair, and tolerance to infection. Front Immunol.9, 1777 (2018). - PMC - PubMed

MeSH terms

Substances

LinkOut - more resources