. 2025 Apr 8;16(1):3329.
doi: 10.1038/s41467-025-58728-z.

MSFragger-DDA+ enhances peptide identification sensitivity with full isolation window search

Affiliations

MSFragger-DDA+ enhances peptide identification sensitivity with full isolation window search

Fengchao Yu et al. Nat Commun. .

Abstract

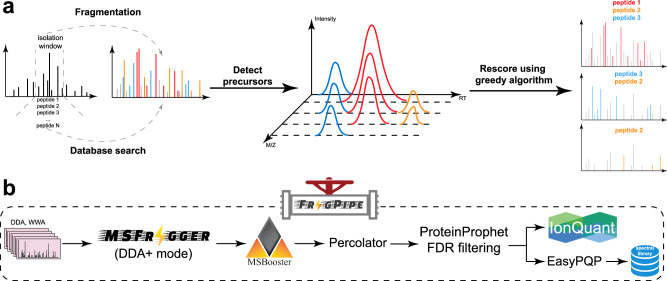
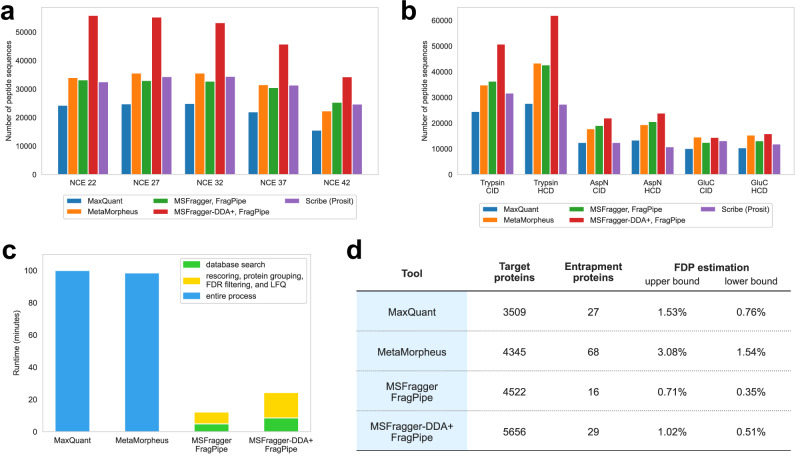
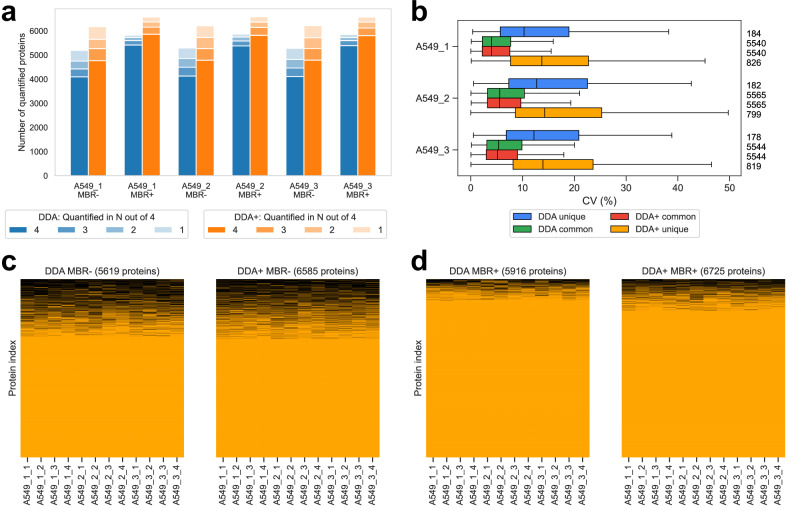
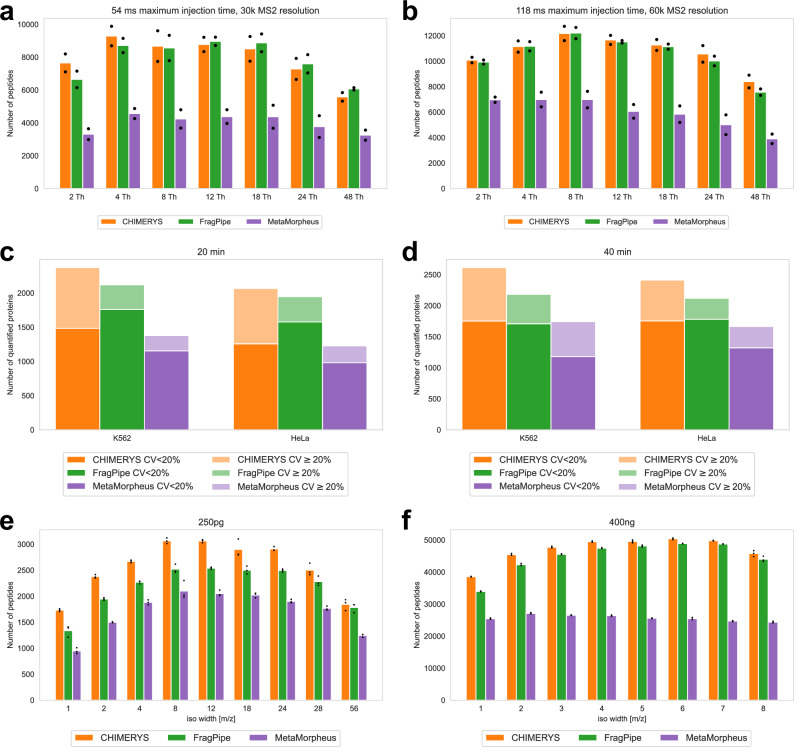
Liquid chromatography-mass spectrometry based proteomics, particularly in the bottom-up approach, relies on the digestion of proteins into peptides for subsequent separation and analysis. The most prevalent method for identifying peptides from data-dependent acquisition mass spectrometry data is database search. Traditional tools typically focus on identifying a single peptide per tandem mass spectrum, often neglecting the frequent occurrence of peptide co-fragmentations leading to chimeric spectra. Here, we introduce MSFragger-DDA+, a database search algorithm that enhances peptide identification by detecting co-fragmented peptides with high sensitivity and speed. Utilizing MSFragger's fragment ion indexing algorithm, MSFragger-DDA+ performs a comprehensive search within the full isolation window for each tandem mass spectrum, followed by robust feature detection, filtering, and rescoring procedures to refine search results. Evaluation against established tools across diverse datasets demonstrated that, integrated within the FragPipe computational platform, MSFragger-DDA+ significantly increases identification sensitivity while maintaining stringent false discovery rate control. It is also uniquely suited for wide-window acquisition data. MSFragger-DDA+ provides an efficient and accurate solution for peptide identification, enhancing the detection of low-abundance co-fragmented peptides. Coupled with the FragPipe platform, MSFragger-DDA+ enables more comprehensive and accurate analysis of proteomics data.


Conflict of interest statement

Competing interests: A.I.N. and F.Y. receive royalties from the University of Michigan for the sale of MSFragger, IonQuant, and diaTracer software licenses to commercial entities. All license transactions are managed by the University of Michigan Innovation Partnerships office, and all proceeds are subject to university technology transfer policy. Other authors declare no competing interests.

Figures

Fig. 1
Fig. 1. Overview of MSFragger-DDA+ and FragPipe.
a MSFragger-DDA+ algorithm. Each tandem mass spectrum is searched against all peptides within the isolation window. Subsequently, MSFragger-DDA+ detects the precursor signals for each of the matched PSMs. After filtering out the PSMs with low-quality precursor signals, MSFragger-DDA+ rescores the PSMs using a greedy algorithm. b MSFragger-DDA+ workflow in FragPipe software. The workflow contains MSFragger-DDA+ for database searching, MSBooster for deep-learning-based rescoring, Percolator for PSM ranking, PorteinProphet for protein inference, FDR filtering, IonQuant for label-free quantification (optional), and EasyPQP for spectral library generation (optional). Source data are provided as a Source Data file.
Fig. 2
Fig. 2. Sensitivity, speed, and false discovery proportion assessment using traditional DDA datasets with different NCE and enzymatic digestions.
a, b Number of peptide sequences identified by MaxQuant, MetaMorpheus, MSFragger, MSFragger-DDA+, and Scribe. a Data with different NCE. b Data with different enzymatic digestions. c Runtime of MaxQuant, MetaMorpheus, MSFragger, and MSFragger-DDA+. d Protein-level FDP evaluation for MaxQuant, MetaMorpheus, MSFragger, and MSFragger-DDA+. Two calculation methods, including the upper bound and lower bound, were applied. Source data are provided as a Source Data file.
Fig. 3
Fig. 3. Performance benchmarking using timsTOF ddaPASEF data.
a Number of quantified proteins from the DDA and DDA+ workflows in the A549 cell line dataset (with three biological replicates, and four technical replicates for each). “MBR+” and “MBR-” refer to IonQuant run with and without MBR, respectively. b Numbers and CVs of overlapped and non-overlapped proteins quantified from the DDA and DDA+ workflows using the A549 cell line. The blue box plots are from the unique proteins of the DDA mode, the green box plots are from the common proteins of the DDA mode, the red box plots are from the common proteins of the DDA+ mode, and the yellow box plots are from the unique proteins of the DDA+ mode. The common proteins are the overlapping proteins quantified in both DDA and DDA+ modes. The numbers on the right are the quantified proteins. For biological replicates A549_1, A549_2, and A549_3, there are 184, 182 and 178 unique proteins of the DDA mode; 826, 799, and 819 unique proteins of the DDA+ mode; and 5540, 5565, and 5544 common proteins, respectively. The box in each plot captures the interquartile range (IQR) with the bottom and top edges representing the first (Q1) and third quartiles (Q3), respectively. The median (Q2) is indicated by a horizontal line within the box. The whiskers extend to the minima and maxima within 1.5 times the IQR below Q1 or above Q3. c Two plots showing the protein non-missing values and missing values from the DDA and DDA+ workflows. A549 cell line data. MBR is disabled. The number of columns equals to the number of proteins quantified in the specific setting and listed at the top of each plot. The proteins with non-zero intensities are in orange, and the proteins with zero intensities are in black. d Similar to (c) but the MBR is enabled. Source data are provided as a Source Data file.
Fig. 4
Fig. 4. Sensitivity assessment using three WWA datasets.
a, b Numbers of peptides from the first WWA dataset of Truong et al. There are 14 samples with different isolation windows, maximum injection time, and MS2 resolutions. Each sample contain two technical replicates. MBR is disabled. The bar height represents the mean of the counts, and the black dot represents the peptide count for each replicate. c, d Numbers and CVs of quantified proteins from the second dataset of Truong et al. The dark color is with CV < 20% and the light color is with CV ≥ 20%. The samples are from K562 and HeLa cell lines, respectively. There are four samples with different combinations of cell line and gradient length. Each sample has eight technical replicates. MBR is disabled. e, f Numbers of identified peptides from the WWA dataset published by Matzinger et al. There are 17 samples with different isolation windows and sample amounts. Each sample has three technical replicates. The bar height represents the mean of the counts, and the black dot represents the peptide count for each replicate. Source data are provided as a Source Data file.
Fig. 5
Fig. 5. Performance demonstration using the glioma dataset.
a Heatmap of the gene intensities from the DDA+ workflow. b PCA plot of the quantitative results from the DDA+ workflow. c Volcano plot comparing 10711 gene intensities between IDHmut samples (n = 21) and IDHwt samples (n = 11) from the DDA+ workflow. Log2 fold change was calculated using limma’s moderated t test. The p values were adjusted using the Benjamini-Hochberg procedure. The black dot represents the differentially expressed genes based on a fold change threshold of 2 and adjusted p value of 0.05. d Box plots showing the percentage of protein-level missing values from the DDA and DDA+ workflows. A total of 9395 proteins from DDA+ workflow and 8406 proteins from DDA workflow are compared across the defined intensity ranges, with the protein count for each box displayed at the top. The box in each plot captures the IQR with the bottom and top edges representing the Q1 and Q3, respectively. The median (Q2) is indicated by a horizontal line within the box. The whiskers extend to the minima and maxima within 1.5 times the IQR below Q1 or above Q3. e Venn diagrams showing the number of upregulated and downregulated genes in the DDA and DDA+ workflows. Source data are provided as a Source Data file.

Update of

Similar articles

Cited by

References

    1. Olsen, J. V. & Mann, M. Status of large-scale analysis of post-translational modifications by mass spectrometry. Mol. Cell Proteom.12, 3444–3452 (2013). - PMC - PubMed
    1. Li, G. X. et al. Comprehensive proteogenomic characterization of rare kidney tumors. Cell Rep. Med. 5, 101547 (2024). - PMC - PubMed
    1. Huang, C. et al. Proteogenomic insights into the biology and treatment of HPV-negative head and neck squamous cell carcinoma. Cancer Cell39, 361–379.e316 (2021). - PMC - PubMed
    1. Schoof, M. et al. An ultrapotent synthetic nanobody neutralizes SARS-CoV-2 by stabilizing inactive Spike. Science370, 1473–1479 (2020). - PMC - PubMed
    1. Mi, Y. et al. High-throughput mass spectrometry maps the sepsis plasma proteome and differences in patient response. Sci. Transl. Med. 16, eadh0185 (2024). - PubMed

LinkOut - more resources