. 2025 Apr;11(4):790-807.
doi: 10.1038/s41477-025-01974-2. Epub 2025 Apr 8.

An Oryza-specific histone H4 variant predisposes H4 lysine 5 acetylation to modulate salt stress responses

Affiliations

An Oryza-specific histone H4 variant predisposes H4 lysine 5 acetylation to modulate salt stress responses

Vivek Hari-Sundar Gandhivel et al. Nat Plants. 2025 Apr.

Abstract

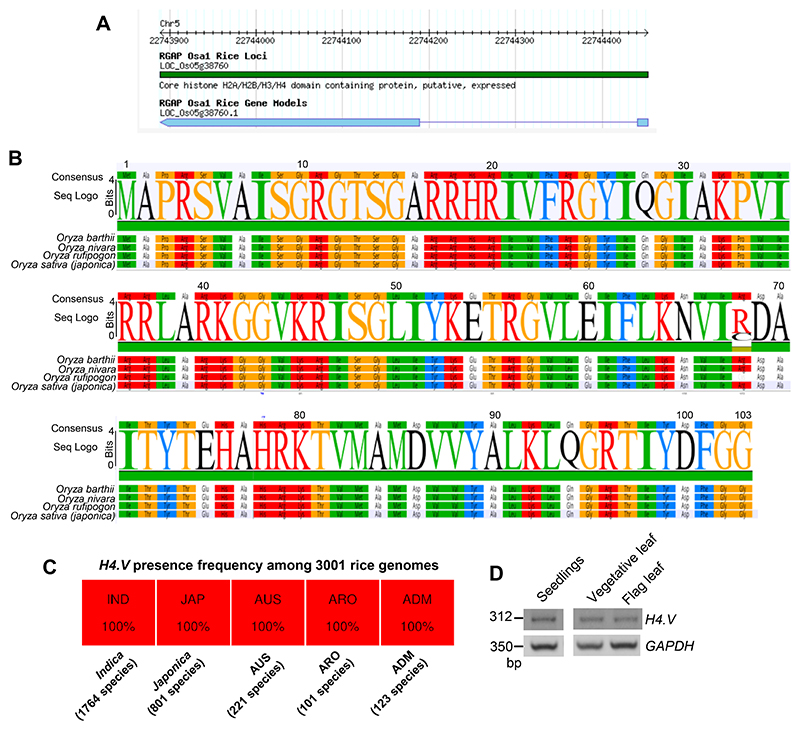
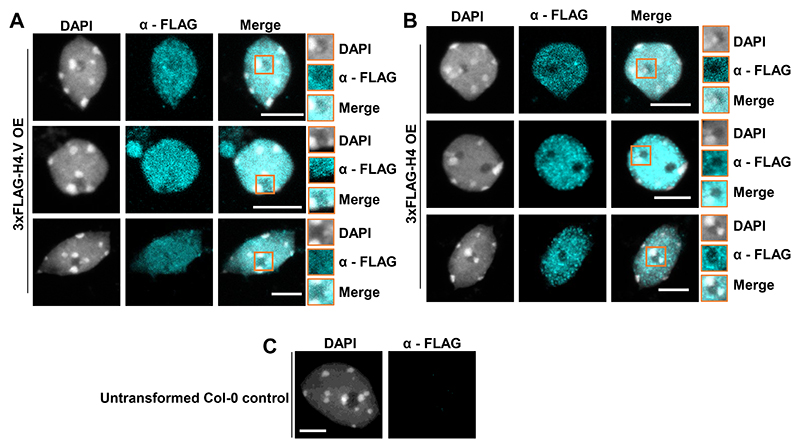
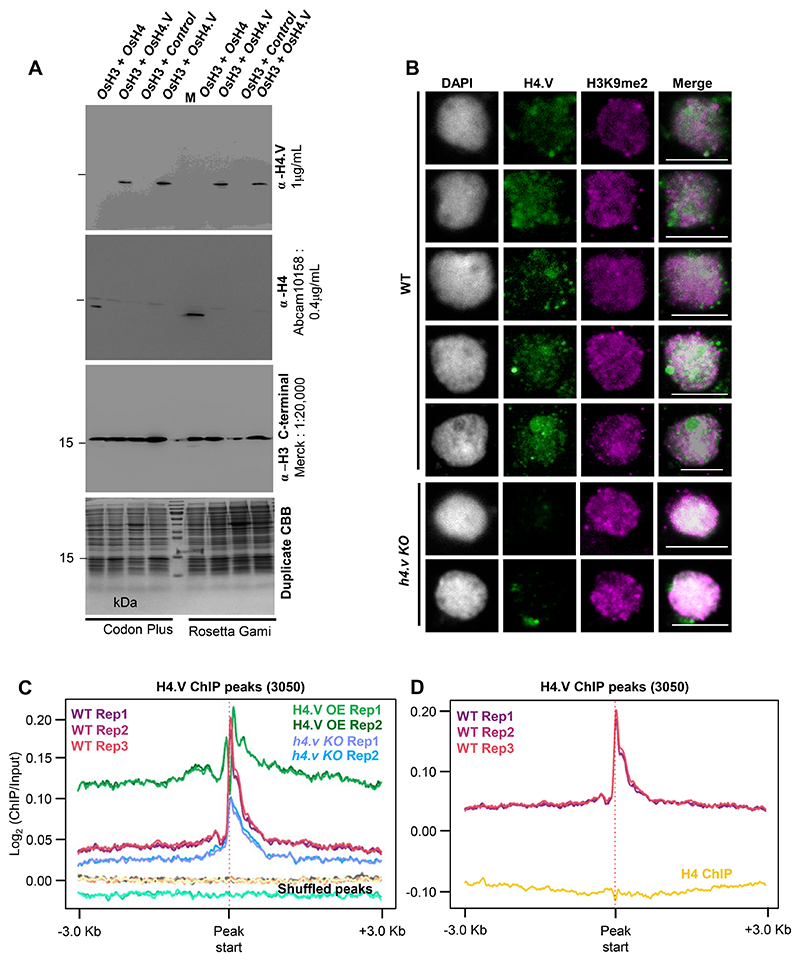
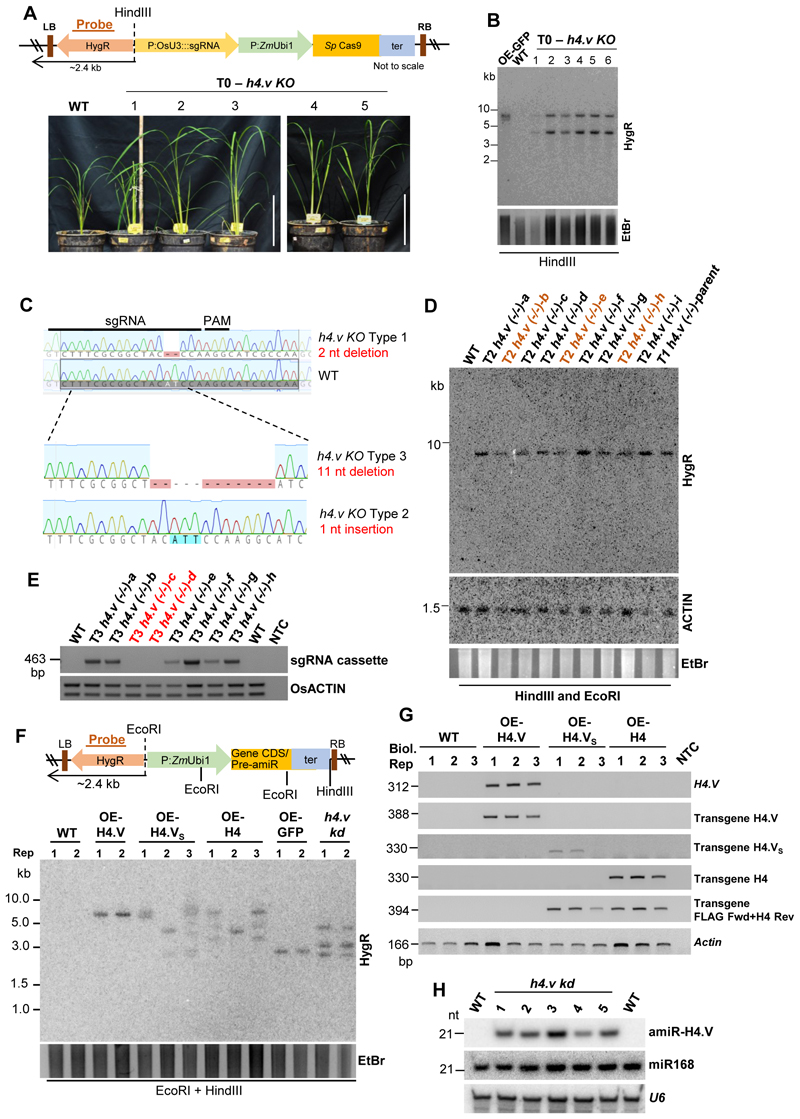
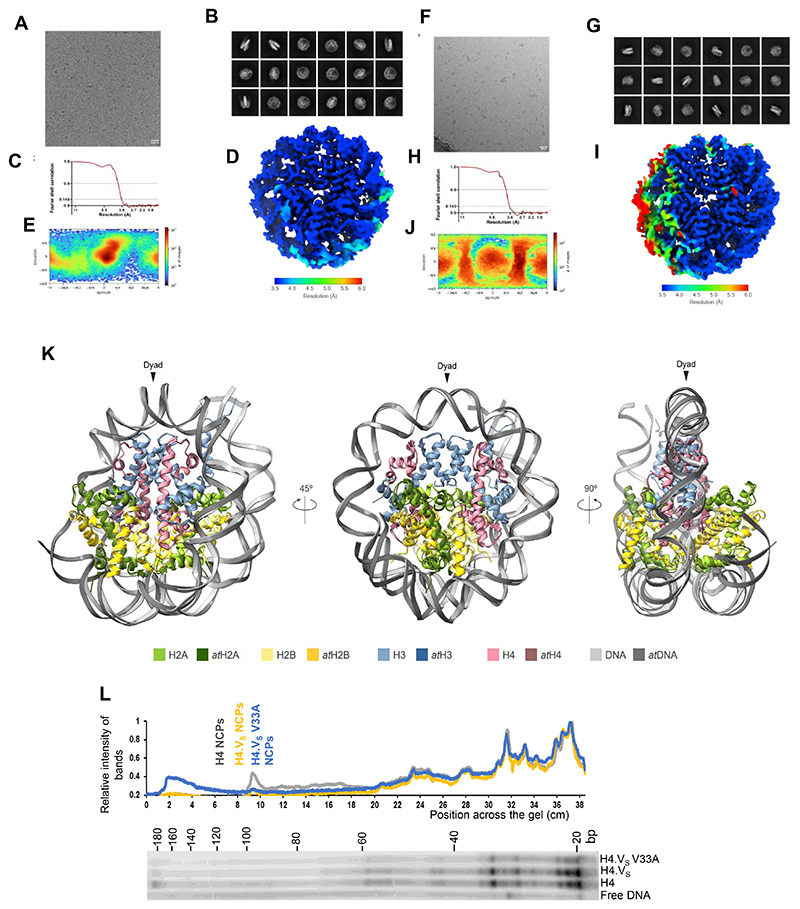
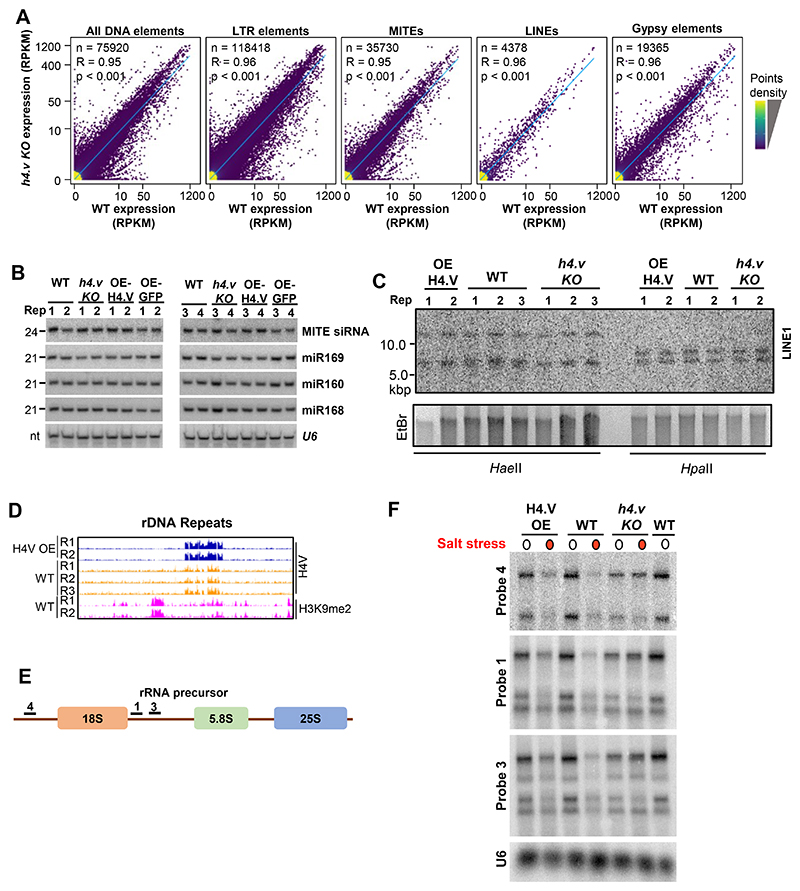
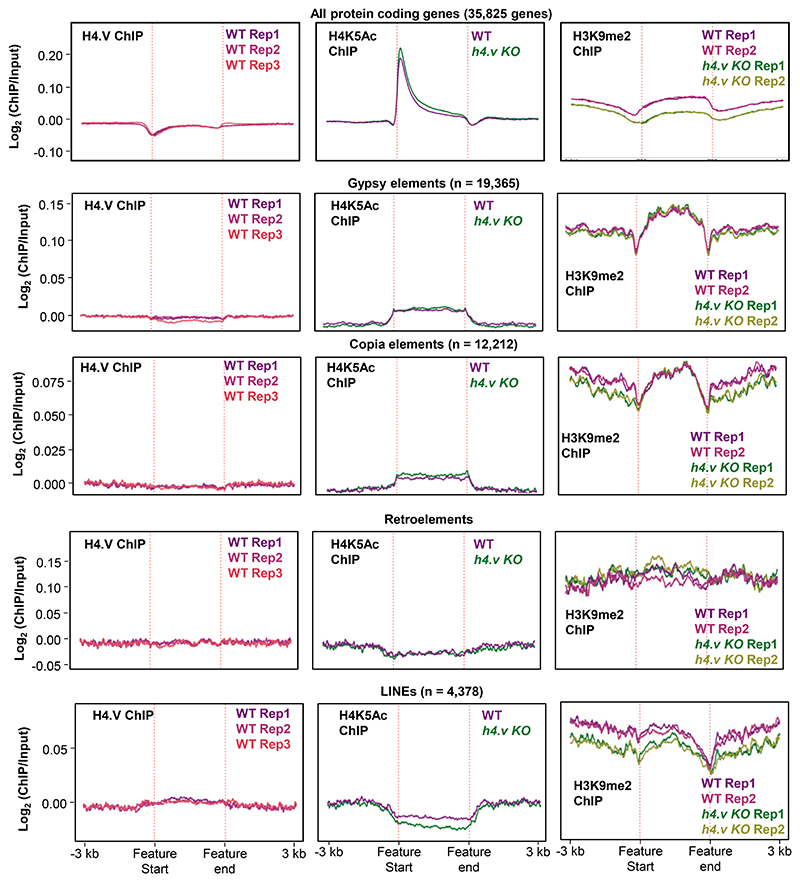
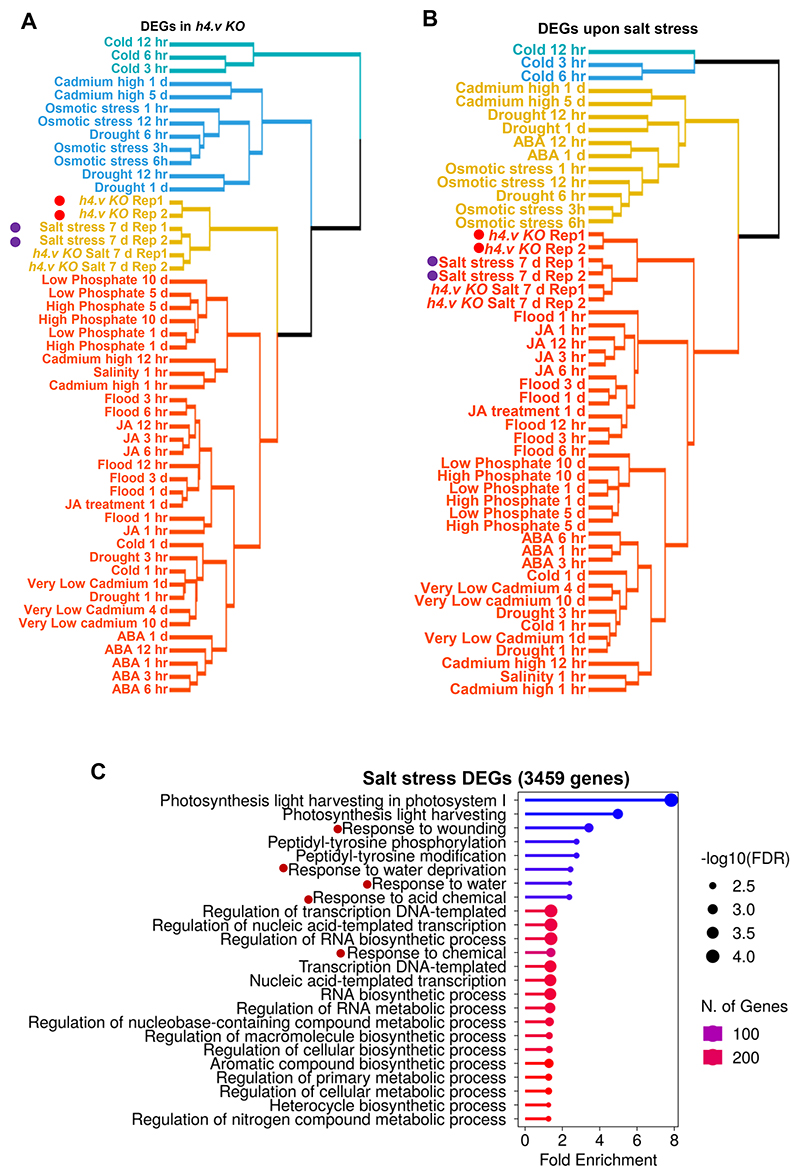
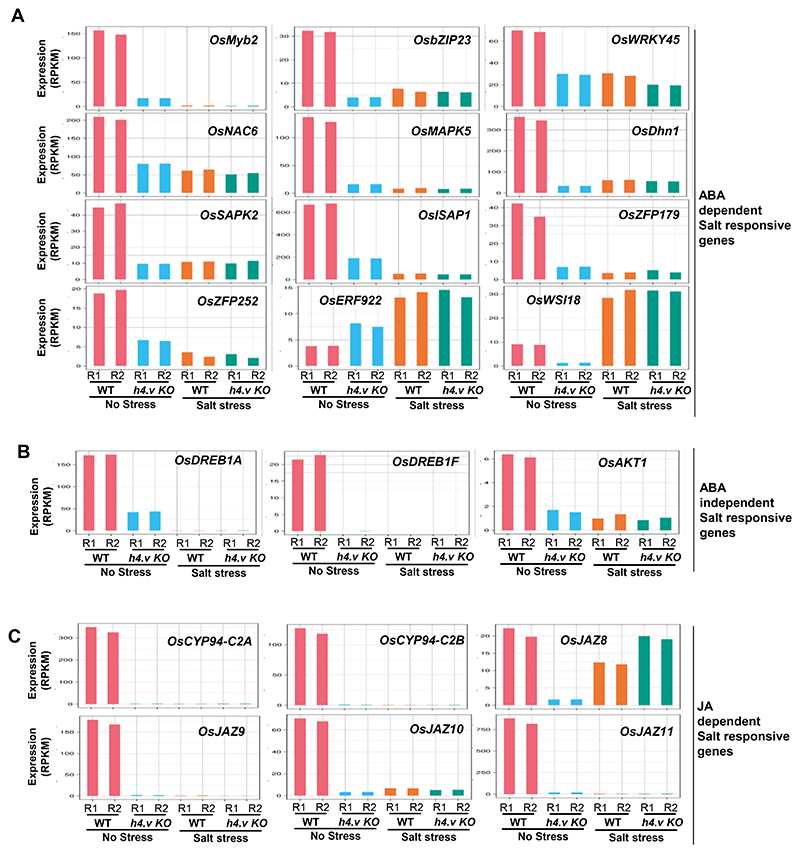
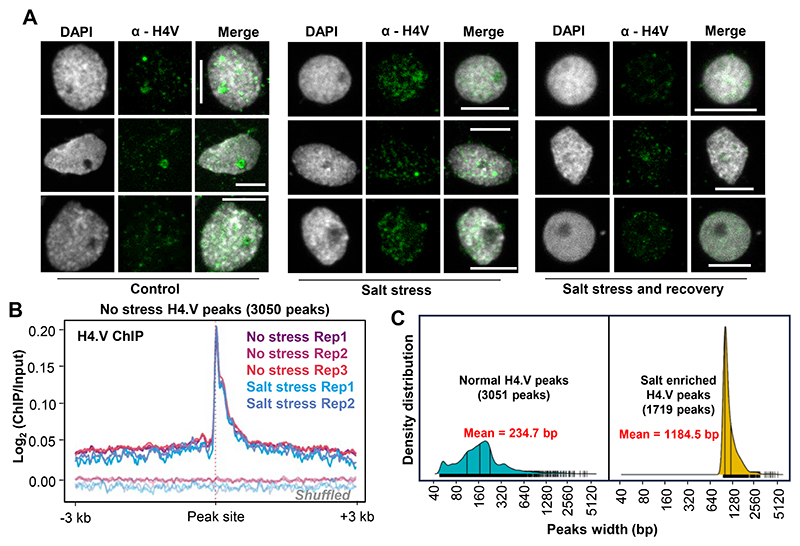
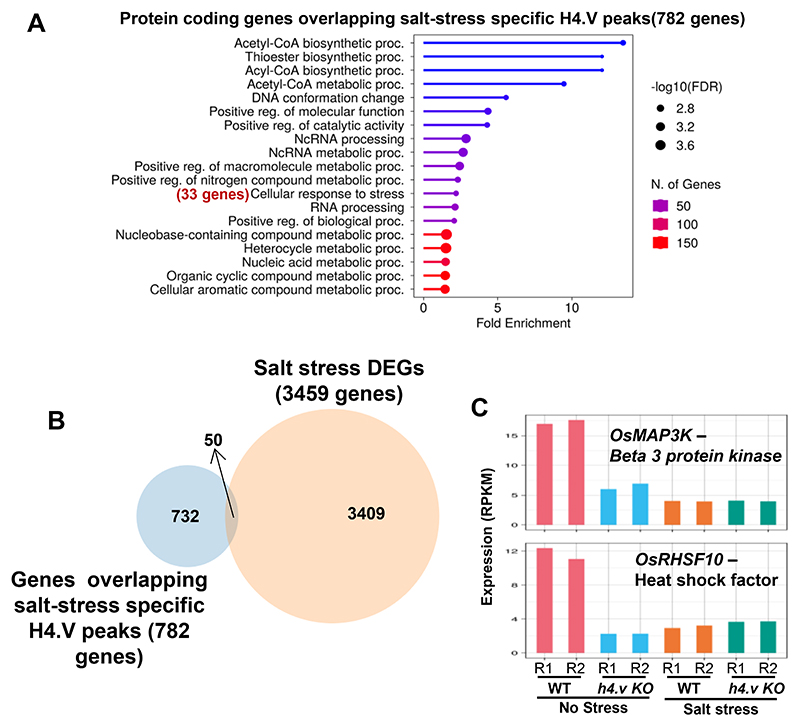
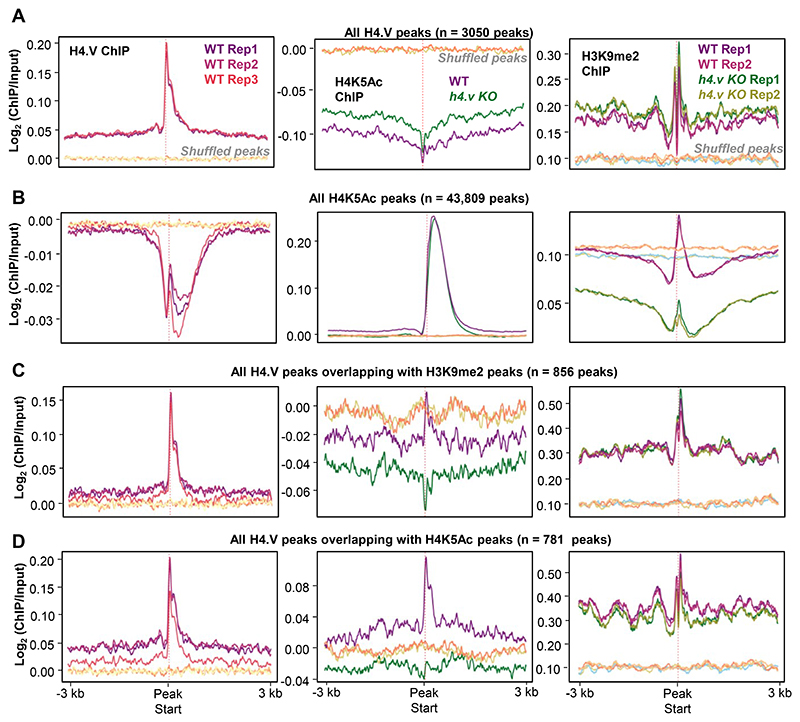
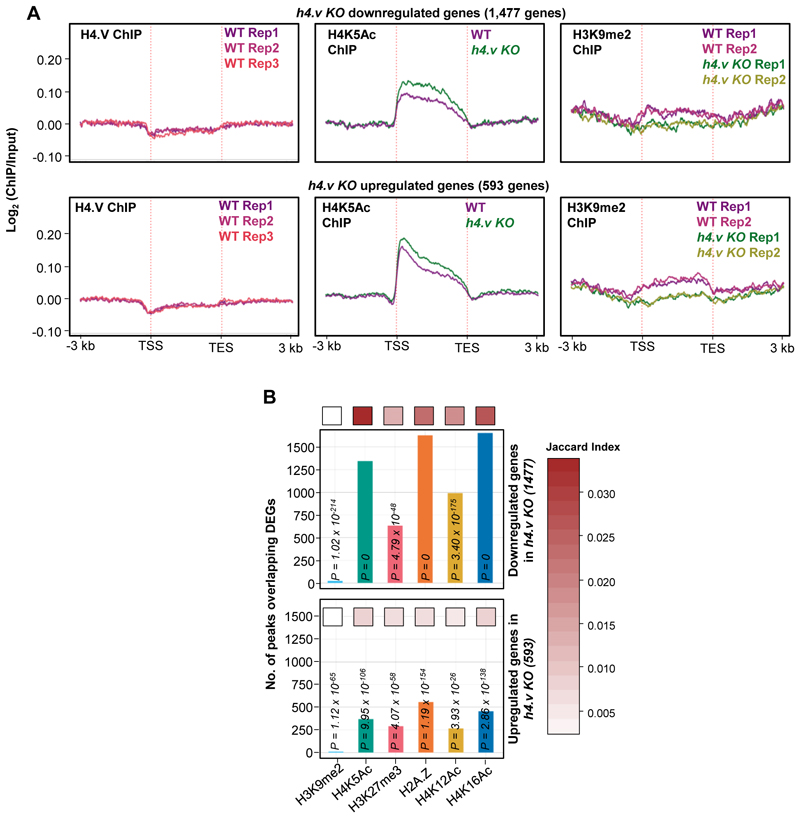
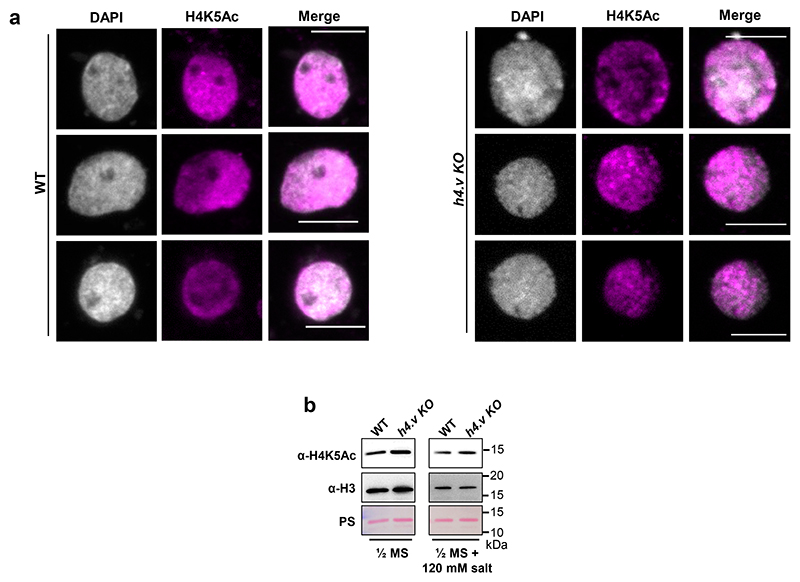
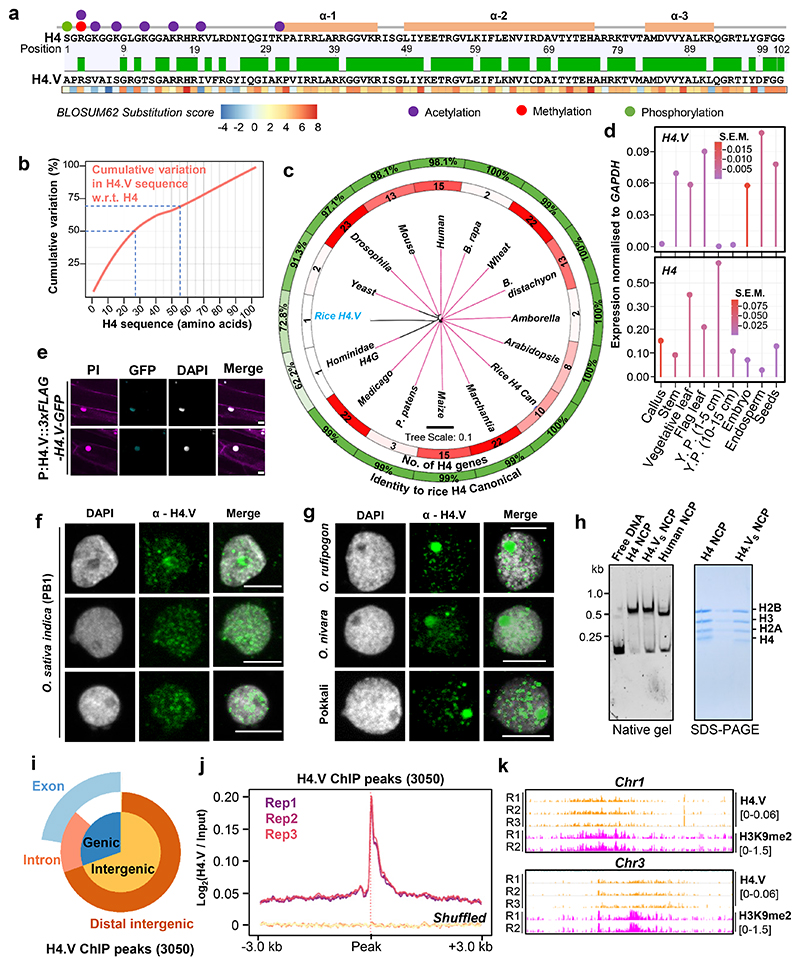
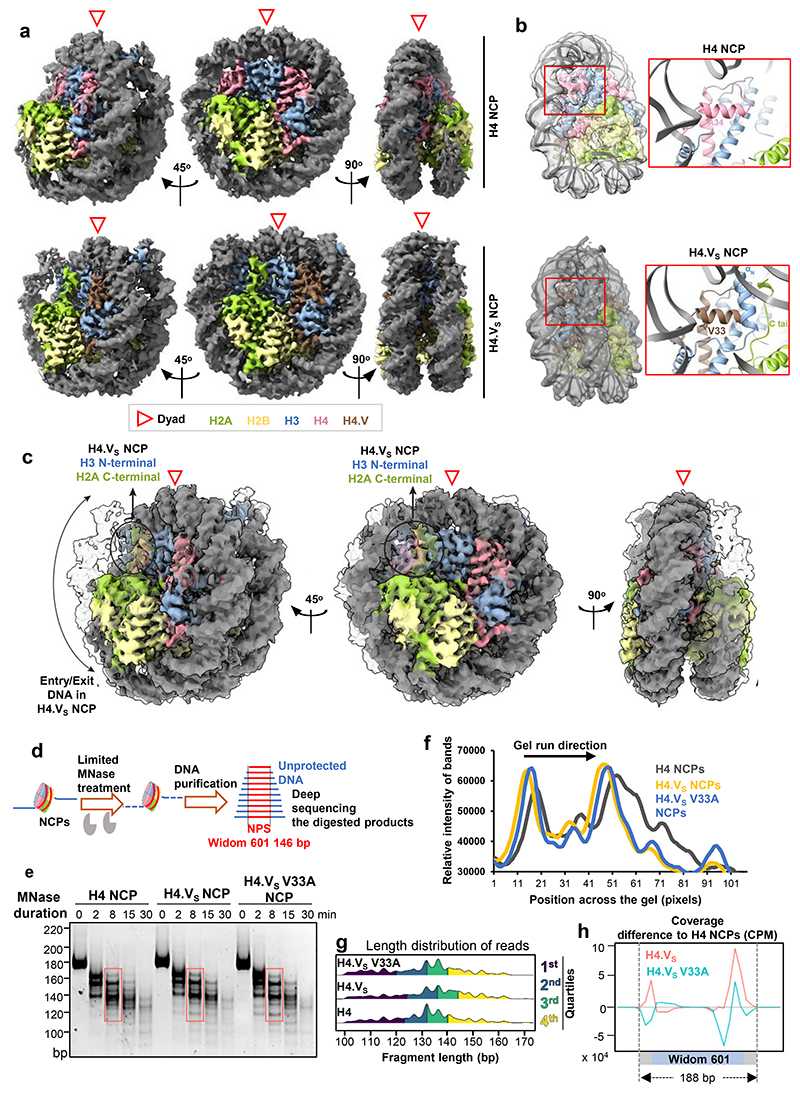
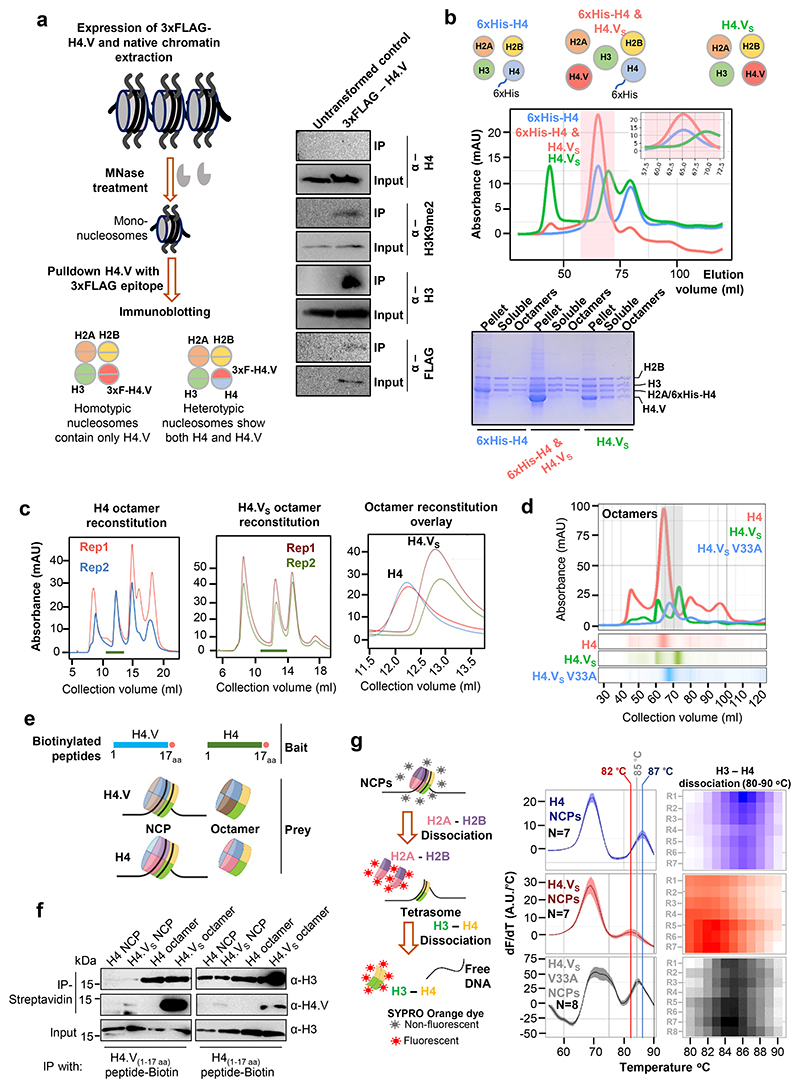
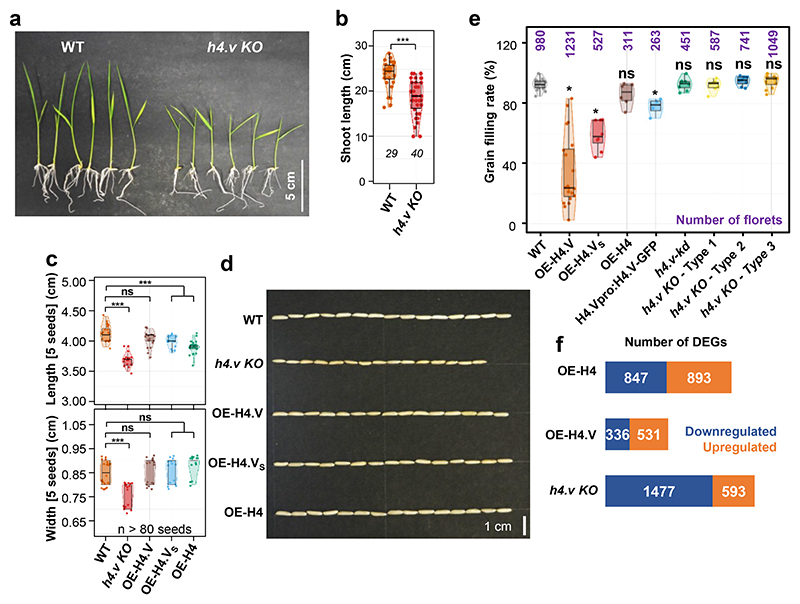
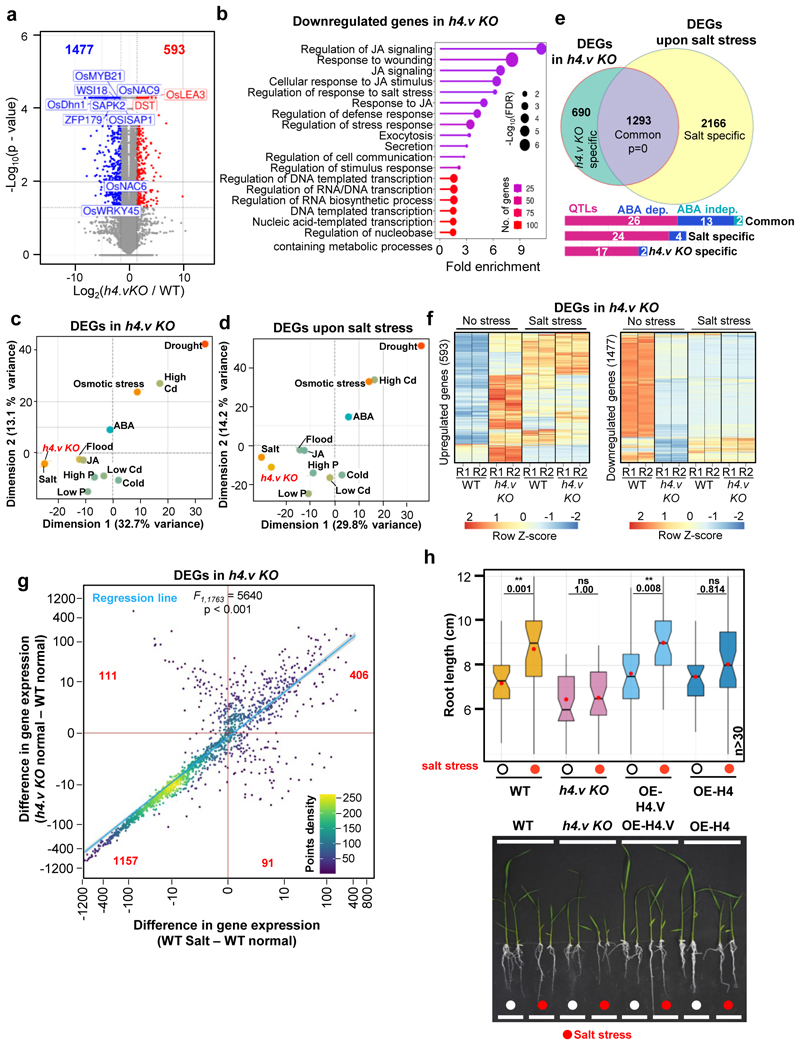
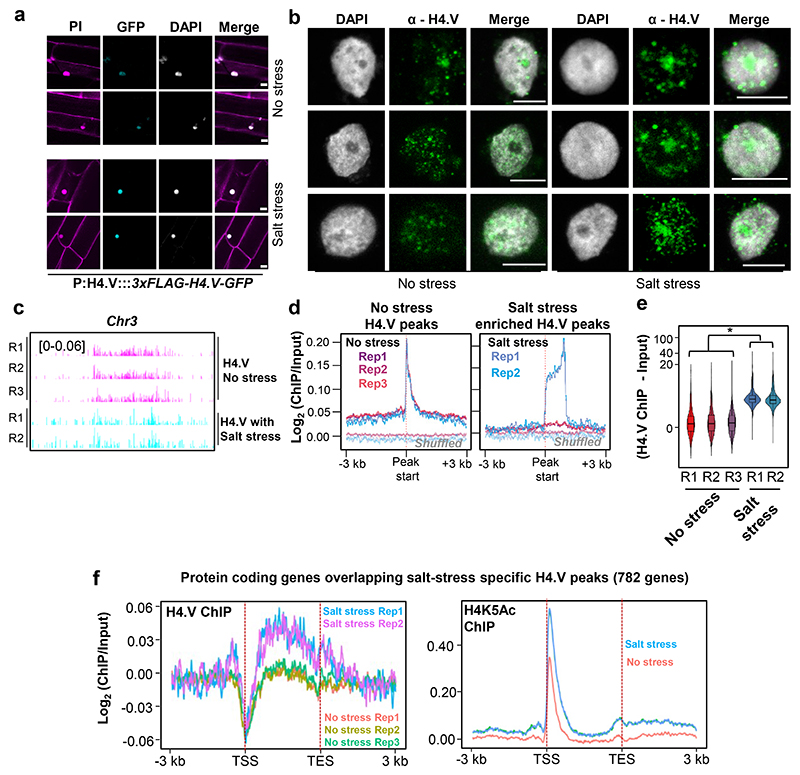
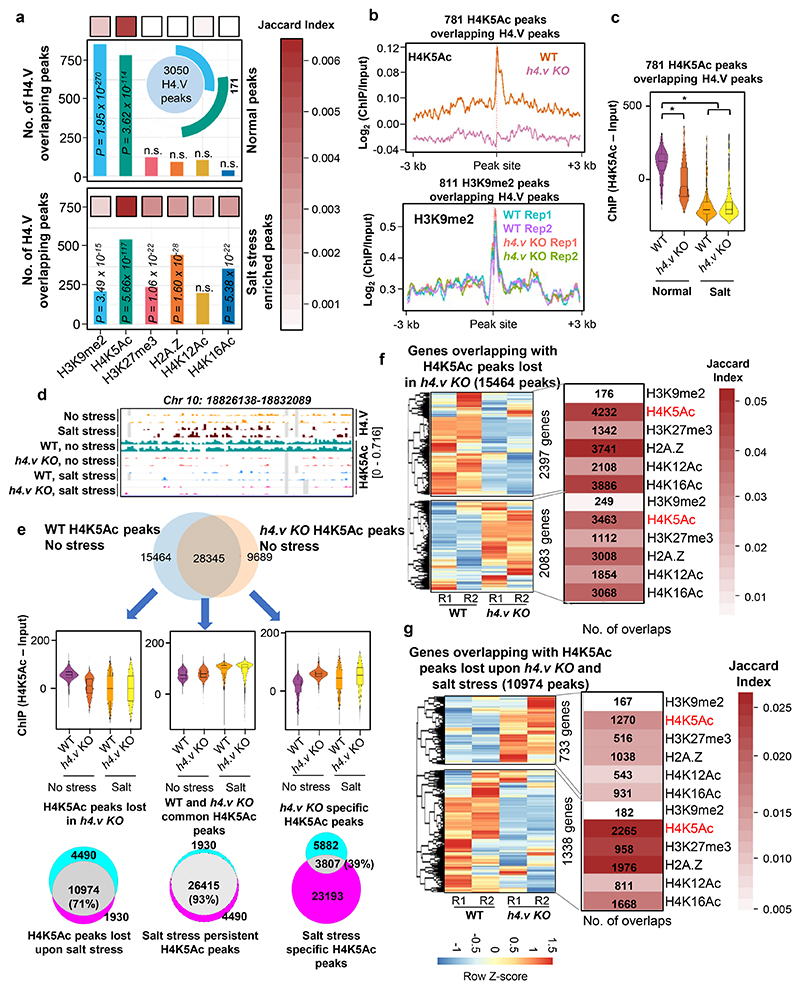
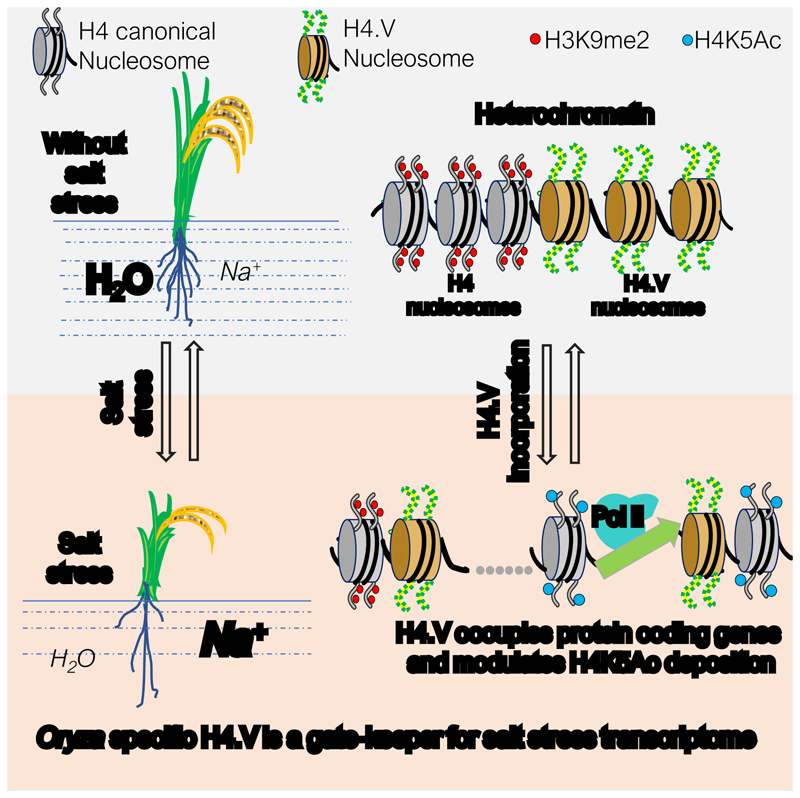
Paralogous variants of canonical histones guide accessibility to DNA and function as additional layers of genome regulation. Across eukaryotes, the mechanism of action and functional significance of several variants of core histones are well known except those of histone H4. Here we show that a variant of H4 (H4.V) expressing tissue-specifically among Oryza members mediated specific epigenetic changes contributing to salt tolerance. H4.V was incorporated into specific heterochromatic sites, where it blocked the deposition of active histone marks. Stress-dependent redistribution of H4.V enabled the incorporation of acetylated H4 lysine 5 (H4K5ac) in the gene bodies. The misexpression of H4.V led to defects in reproductive development and in mounting salt stress responses. H4.V formed homotypic nucleosomes and mediated these alterations by conferring distinct molecular properties to the nucleosomes, as seen with cryo electron microscopy structures and biochemical assays. These results reveal not only an H4 variant among plants but also a chromatin regulation that might have contributed to the adaptation of semi-aquatic Oryza members.


Conflict of interest statement

Competing interests: The authors declare no competing interests.

Figures

Extended Data Fig. 1
Extended Data Fig. 1. H4.V is conserved among Oryza genera members.
(A) Gene model of the H4.V from RAPDB (https://rapdb.dna.affrc.go.jp/). (B) Seq-logo showing conservation of the H4.V among rice species. (C) H4.V presence frequency among the 3001-rice genome project from rice pan-genome browser (https://cgm.sjtu.edu.cn/3kricedb/index.php). (D) RT-PCR amplification of the H4.V transcript across three rice tissues. GAPDH served as control.
Extended Data Fig. 2
Extended Data Fig. 2. H4.V can be incorporated into the Arabidopsis chromatin.
(A-C) Immunostaining of nuclei from Arabidopsis Col-0 plants heterologously over-expressing (CaMV 35S promoter) H4.V (A) or H4.VS (B). Nucleolar regions are shown as insets. (C) Untransformed Col-0 control shows specificity of α − FLAG antibody in immunofluorescence imaging. Scale: 5 μm.
Extended Data Fig. 3
Extended Data Fig. 3. H4.V antibody is specific and does not cross react with H4.
(A) Immunoblots showing reactivity of α-H4.V and α-H4 specifically to their epitopes. Total bacterial lysates from two different E. coli strains are shown. Blots were stripped and re-hybridized. CBB stained duplicate gel served as loading control. Both H3 and H4/H4.V were co-expressed in the same plasmid (Supplemental Table S5). M: size marker. (B) IFL images of nuclei from WT and h4.v KO plants stained using α-H4.V and α-H3K9me2. Scale: 5 μm. (C) ChIP enrichment profiles of H4.V at H4.V peaks from WT, OE-H4.V and h4.v KO. Enrichment profiles at shuffled H4.V peaks served as control. (D) ChIP enrichment profiles at H4.V peaks from H4.V ChIP-seq and H4 ChIP-seq.
Extended Data Fig. 4
Extended Data Fig. 4. Generation of h4.v KO and H4.V perturbed lines in rice.
(A) T-DNA map of the Cas9 construct used for generating the h4.v KO. T0 h4.v KO images of 5-weeks old plants are shown. Scale: 10 inches. (B) Southern blots showing the junction fragment profiles of T0 h4.v KO lines. OE-GFP served as positive control. (C) Mutation profiles of T1 h4.v KO plants compared to WT. Three types of mutations were obtained and the type 1 mutation was taken for the analysis. (D) Junction fragment Southern analysis of the homozygous (-/-) T1 h4.v KO parent (that segregated as single copy transgene) and its T2 progeny. Plants marked in brown are putative parents that are heterozygous for the transgene. (E) Genomic DNA PCR showing the T3 segregants of the T2 parents (marked brown in (D)). Actin was used a loading control and sgRNA region as transgene marker. (A, B and D) Probe (HygR) used for T-DNA junction fragment Southern blots is marked (brown). EtBr-stained gel served as loading control. (F) T-DNA map and the junction fragment (arrow) Southern analyses of transgenic plants overexpressing H4.V, H4.VS and H4 or GFP (3x-FLAG tagged at the N-terminal) or the precursor of amiR. HygR was used as probe (brown bar). EtBr-stained gel is the loading control. (G) RT-PCR (semi-quantitative) gels showing the OE of the transgenes in leaves using specific primers. NTC-no template control. Actin was used as loading control. (H) sRNA northern blots showing the accumulation of the amiR targeting H4.V in h4.v kd plants. U6 served as control.
Extended Data Fig. 5
Extended Data Fig. 5. Cryo-EM data processing of NCPs and DNA interactions in rice NCPs.
(A-J) Data collection and refinement for rice canonical NCP (A-E) and H4.Vs NCP (F-J). Representative cryo-EM micrographs (A, F), representative 2D classes (B, G), Fourier Shell Correlation curves (C, H) showing the resolution estimation of the maps, local resolution maps (D, J) and angular distribution of the particles (E,J) for the NCPs were depicted. (K) Overlay images of Arabidopsis and rice (H4) NCP depicting that the atypical DNA accessibility in plant nucleosomes is due to variations in the H2B. Magnified images depict the residue necessary for the variable DNA wrapping. (L) DNase foot-printing assay of the 188 bp NCPs with the corresponding band intensity profile showing no major distinction in the way DNA is protected by the octamers within the core of the NCPs..
Extended Data Fig. 6
Extended Data Fig. 6. H4.V perturbation does not affect the silencing of transposons but mis-regulate rDNA expression.
(A) Density scatter plots showing expression difference of different categories of transposons. Pearson correlation coefficient (R) and p-values are mentioned. Points density are mentioned with colour gradient. (B) sRNA northern blots showing abundance of repeat-derived sRNAs or other miRNAs. U6 was the loading control. (C) Methylation sensitive Southern blot hybridised with LINE1 probe. EtBr-stained gel served as loading control. (D) IGV screenshots showing occupancy of H4.V at rDNA arrays in chromosome 1. (E - F) RNA blots showing the expression of rRNA precursor regions (precursor structure and probe regions marked in (E)). U6 served as loading control.
Extended Data Fig. 7
Extended Data Fig. 7. Occupancy of H4.V over protein coding genes and repeats
Metaplots showing the occupancy of H4.V, H4K5Ac and H3K9me2 marks over the protein coding genes and other annotated transposons and repeats.
Extended Data Fig. 8
Extended Data Fig. 8. KO of H4.V exhibits a transcriptome similar to salt stressed state.
(A-B) Clustered dendrograms comparing transcriptomes across different stress conditions from TENOR datasets, analyzed for the h4.v KO DEGs (A), or the salt stress DEGs (B). Red dots highlight the h4.v KO profiles and purple dots represent salt stress profiles. Figures 5C and D depict representative examples and replicates are shown here. The tree is clustered into four hierarchical types. (C) Gene Ontology enrichment analysis of salt stress DEGs. Red dots represent categories associated with salt stress responses.
Extended Data Fig. 9
Extended Data Fig. 9. Knockout of H4.V results in misregulation of phytohormonal pathway genes responsive to salt stress.
(A-C) Gene expression levels in WT and h4.v KO with and without salt stress. Gene names are mentioned.
Extended Data Fig. 10
Extended Data Fig. 10. Salt-stress dependent variations in H4.V.
(A) Immunostaining of H4.V showing the persistent occupancy of the H4.V upon salt stress followed by recovery. Salt stress is administered for 14 days followed by recovery. Scale: 5 μm. (B) Metaplots comparing the occupancy of H4.V with or without stress over the peaks identified without salt stress (3050 peaks). Enrichment over the shuffled set of peaks are shown in grey shade. (C) Density distribution plots of the H4.V peak widths. Mean peak width is shown in red and quartiles of size distribution is marked in black.
Extended Data Fig. 11
Extended Data Fig. 11. Salt-stress specific H4.V peaks occupy protein coding genes.
(A) Gene Ontology enrichment analysis of salt stress DEGs. (B) Venn diagram representing the overlap of salt stress DEGs and the genes that are occupied by H4.V upon salt stress. (C) Gene expression levels in WT and h4.v KO with and without salt stress. Gene names are mentioned. These are representative genes that are master-regulators of stress responses that are occupied by H4.V upon salt stress.
Extended Data Fig. 12
Extended Data Fig. 12. Co-occupancy and regulation of H4.V and other histone marks
(A-D) Metaplots showing the occupancy of histone marks (H4.V, H4K5Ac and H3K9me2) over all H4.V peaks (A), all H4K5Ac peaks (B), H4.V peaks overlapping with H3K9me2 peaks (C) and H4.V peaks overlapping with H4K5Ac peaks (D). Enrichment over the shuffled set of peaks are shown as control for background enrichment.
Extended Data Fig. 13
Extended Data Fig. 13. h4.v KO DEGs are not directly occupied by H4.V.
(A) Metaplots showing the occupancy of H4.V, H4K5Ac and H3K9me2 marks over the h4.v KO DEGs. (B) Bar plots showing number of overlaps of h4.v KO DEGs with peak sets of other histone marks. Significance of overlap was tested using hyper-geometric test and p-values are mentioned. Jaccard index (shown as heatmap) represents the strength of overlap.
Extended Data Fig. 14
Extended Data Fig. 14. Perturbation of H4 variant does not lead to global changes in H4K5Ac levels.
(a) IFL images showing occupancy of H4K5Ac marks in WT and h4.v KO seedlings nuclei. Scale: 5 μm. (b) Immunoblots showing the global levels of H4K5Ac marks without and with salt stress. H3 levels and Ponceau stained blots served as loading controls.
Fig. 1
Fig. 1. Rice specific histone H4.V is different from H4.
(a) Pairwise sequence alignment of H4 and H4.V. Line diagram shows histone-fold domains (orange boxes) and H4 residues that attract PTMs (colour coded). Heatmap with BLOSUM62 scores for the substitutions observed. (b) Cumulative variations plot showing positional distribution of variations across protein length from N-terminal end (x-axis). Dotted lines represent the intercepts for 50% and 70% variation. (c) Phylogenetic tree with protein sequence variations of H4 across organisms. Inner track-number of H4 encoding genes; outer track-% identity w.r.t. rice H4. Tree distance is in black. (d) Lollipop plots showing RT-qPCR estimation of H4 and H4.V expression in different rice tissues. Circle diameters represent standard error of the mean (S.E.M.). Y.P.: young panicle. (e) Fluorescent micrographs of seedling roots expressing 3xFLAG-H4.V-GFP driven by H4.V promoter (P:H4.V). (f-g) IFL images of PB1 (f), Oryza species and pokkali (g) nuclei stained using α-H4.V antibody. (h) Gel-mobility shifts of in vitro reconstituted H4.VS and H4 containing NCPs on a native gel (6% acrylamide) and Coomassie brilliant blue (CBB) stained SDS-PAGE gel (15% acrylamide). Human NCPs were used as control. (i) Vennpie chart showing proportion of genic and intergenic regions (beyond +/- 3 kb of genes) overlapped by H4.V peaks. (j) Metagene plots showing enrichment of H4.V ChIP-seq signal in 3 biological replicates of rice seedlings over H4.V peaks. Enrichment at the shuffled set of loci served as control. (k) Chromosome-wide genome browser screenshots showing ChIP enrichment (square brackets) of H4.V and H3K9me2 marks in seedlings. (e-j) DAPI stained DNA; propidium iodide (PI) stained DNA and cell walls. Scale: 5 μm.
Fig. 2
Fig. 2. H4.V nucleosomes are structurally distinct to H4 nucleosomes.
(a) The cryo-EM map of H4 NCP and H4.VS NCP as visualized with Chimera X. Unlike the H4.VS NCP, in H4 NCP about 20 bp of one of the entry/exit DNA regions were not resolved highlighting the contribution of H4.VS in stabilizing the entry/exit DNA regions. (b) Close-up views of the H4.VS amino acid variation at position 33, which contributed to the stabilization of H3 αN Helix, H2A C-terminal tail and DNA entry/exit region. (c) Representation of overlay of the H4 and H4.VS NCP highlighting the region where the Valine 33 of H4.VS stabilizes the H3 and H2A tails. (d) Schematic of the limited MNase digestion of the NCPs with extended (188 bp) Widom 601 sequence (NPS in red, extended DNA in blue). (e) Representative gel showing the DNA size profiles of the MNase digestion over time course. (f) Quantification of fragments highlighted in (e). (g) Length distribution of purified DNA fragments after limited MNase digestion. Quartiles of length are coloured. (h) Coverage plots (difference w.r.t. H4 NCPs) depicting distribution of differential MNase protection of DNA over the extended Widom 601 NPS for H4.VS and H4.VS V33A NCPs.
Fig. 3
Fig. 3. H4.V confers specific properties to nucleosomes.
(a) Mononucleosome-IP assay scheme and immunoblots showing that H4.V occurs as homotypic nucleosomes in planta. H4.V was expressed as N-terminal 3xFLAG tagged transgene and pull downs were performed with untransformed WT as controls. (b) Histone refolding experiments with 6xHis tagged H4 and untagged H4.VS in three combinations are shown. Post-refolding dialyses, pellet, soluble fraction of the dialysate and the SEC fraction corresponding to the octamers were analysed on an SDS-PAGE gel. The octamer fractions of the chromatograms are shaded in pink. SDS-PAGE gel showing the relative proportions of soluble octamers and pellet fractions. (c) Gel filtration chromatograms (24 ml S200 column) of the serially dialysed histone refolding mix containing H4 or H4.VS to purify octamer fractions (green bars) from two independent experiments. Overlay of the chromatograms, zoomed at the octamer elution fraction (green bars) is shown in right. (d) Chromatogram of the octamer purification in a 120 ml S200 column with the H4.VS V33A modification. (e) Schematic for the pulldown using biotinylated peptides (1-17 a.a. residues) of H4 and H4.V (bait) with the NCPs or octamers (prey). (f) Immunoblots showing pulldown products probed with α-H3 or α-H4.V. About 10% of the prey complexes were used as input control. (g) Schematic depicting the stepwise thermal decay of the NCPs. Fluorescent and non-fluorescent versions of the SYPRO Orange dye are shown in red and grey, respectively. Thermal decay rates plotted as a function of temperature. Shaded region signifies 95% confidence interval from 7 replicates. First peak at ~68 °C depicts H2A-H2B dissociation and second peak depicts H3-H4 dissociation.
Fig. 4
Fig. 4. Histone H4.V perturbation leads to phenotypic defects largely attributable to gene mis-regulation.
(a) Seedlings images of WT and h4.v KO plants. (b) Box-violin plots showing shoot length distribution of WT and h4.v KO plants. Number of plants taken is mentioned in italics. (c) Box-violin plots showing seed size distribution taken 5 at a time. Dots represent dimensions of 5 seeds. At least 80 seeds were taken for analysis. (d) Representative image of 15 seeds from different genotypes. (e) Box-violin plots showing percentage of filled grains. Dots represent data from individual panicles. (f) Stacked bar plots showing number of DEGs in different genotypes. (b, c and e) Two-tailed Student’s t-test was used for statistical comparison. (*) p-value< 0.05, (ns) non-significant.
Fig. 5
Fig. 5. H4.V is necessary to prevent precocious salt stress like transcriptome.
(a) Volcano plot showing the DEGs in h4.v KO seedlings. Blue dots represent downregulated and red dots represent upregulated genes. Labelled genes are stress-responsive. (b) GO enrichment categories among the downregulated genes. FDR-false discovery rate. (c-d) PCA plots of selected stress dependent transcriptomes (full list in Extended Data Fig. 8) for the h4.v KO DEGs (c) and salt stress DEGs (d). The first two principal dimensions are plotted and the percentage of variance explained is indicated. (e) Venn diagram representing the overlap between h4.v KO and salt stress DEGs. Hypergeometric test was used for statistical testing of overlaps. Bar plots show no. of genes represented in each category with salt-linked QTLs, ABA dependent/independent salt responsive genes. (f) Clustered heatmaps showing variation in expression across WT and h4.v KO, with and without salt stress across h4.v KO DEGs. (g) Density scatter plots showing resemblance of h4.v KO with salt stress transcriptomes over h4.v KO DEGs. Points density is color coded. Number of points in each quadrant is mentioned in red. Blue line represents the linear regression fit line, and grey shade represents the 95% confidence interval. Difference in gene expression is plotted and x- and y- axes are scaled to inverse sine hyperbolic function. F-test was used for statistical testing of the dependence of two perturbations (salt stress and h4.v KO). (h) Box plots showing root length distribution without and with salt stress (red circles) across genotypes (left panel). Red dots within the boxes represent mean of the values. At least 30 plants were phenotyped for each condition/genotype. Student’s t-test was used for statistical testing. p-values are mentioned across comparisons. Representative image of the plants used for phenotyping are shown (right panel).
Fig. 6
Fig. 6. H4.V occupancy redistributes upon salt stress.
(a) Fluorescent micrographs of seedling roots expressing 3xFLAG-H4.V-GFP. Seedlings grown without and with salt stress are shown. Scale: 5 μm. (b) IFL images of nuclei stained using α-H4.V antibody. Nuclei isolated from seedlings grown without and with salt stress are shown. Scale: 5 μm. (c) Chromosome-wide genome browser screenshots showing ChIP enrichment (square brackets) of H4.V without and with salt stress. (d) Metaplots showing enrichment of H4.V with and without salt stress. (e) Box-violin plots showing enrichment of H4.V over the salt-stress enriched peaks (n=1719). Y-axis is scaled to inverse sine hyperbolic function. Wilcoxon signed rank sum test was used for testing statistical significance. (*) p-value <0.001. (f) Metaplots showing the relative distribution of H4.V and H4K5Ac marks (with and without salt stress) over the protein coding genes that are occupied by H4.V upon salt stress.
Fig. 7
Fig. 7. H4.V binding predisposes occupancy of H4K5Ac marks thereby regulating genes.
(a) Bar plots showing number of overlaps of H4.V peaks (normal and under salt stress) with peak sets of other histone marks. Significance of overlap was tested using hyper-geometric test and p-values are mentioned. The inset plot shows number of peaks that are overlapping with H4.V and other histone marks (overlaps more than 20 are shown). Jaccard index (shown as heatmap) represents the strength of overlap. (b) Metaplot showing enrichment of the H4K5Ac and H3K9me2 marks over the respective peaks that overlap with the H4.V marks. (c) Box-violin plots depicting enrichment of H4K5Ac marks over the H4K5Ac peaks that overlap with the H4.V marks. (d) Genome browser screenshot showing ChIP enrichment (square brackets) of H4.V and H4K5Ac marks. (e) Venn diagrams and H4K5Ac enrichment boxplots for the overlaps and cross-overlaps of H4K5Ac peaks without and with stress and in h4.v KO. Percentage of overlap is shown. (f and g) Heatmaps showing the expression profiles of genes overlapping with perturbed H4K5Ac marks. Number of genes in each hierarchical cluster is mentioned. Adjacent heatmaps represent the number of overlaps and Jaccard indices of strength of overlap with other histone marks that co-occur with the genes.
Fig. 8
Fig. 8. A model for the regulation of salt-stress transcriptome and H4K5Ac marks through the histone H4 variant H4.V.
The rice specific H4.V naturally occupies the H3K9me2 marks enriched heterochromatic loci under normal conditions and forms homotypic nucleosomes. Upon salt stress, H4.V occupies the specific set of protein coding regions in addition to the original loci. At these new loci, H4.V occupies gene bodies and favours incorporation of H4K5Ac marks at the TSS sites, leading to salt stress specific responses.

Similar articles

Cited by

  • Epigenetics in Plant Response to Climate Change.
    Zhou W, Wang M, Wang L, Liu Y, Tian Z, Xie L, Wang Y. Zhou W, et al. Biology (Basel). 2025 May 29;14(6):631. doi: 10.3390/biology14060631. Biology (Basel). 2025. PMID: 40563882 Free PMC article. Review.

References

    1. Kornberg RD. Chromatin structure: a repeating unit of histones and DNA. Science. 1974;184:868–871. - PubMed
    1. Hocher A, Laursen SP, Radford P, Tyson J, Lambert C, Stevens KM, Picardeau M, Sockett RE, Luger K, Warnecke T. Histone-organized chromatin in bacteria. bioRxiv. 2023 doi: 10.1101/2023.01.26.525422. - DOI
    1. Henneman B, van Emmerik C, van Ingen H, Dame RT. Structure and function of archaeal histones. PLoS Genet. 2018;14:e1007582. doi: 10.1371/journal.pgen.1007582. - DOI - PMC - PubMed
    1. Mattiroli F, Bhattacharyya S, Dyer PN, White AE, Sandman K, Burkhart BW, Byrne KR, Lee T, Ahn NG, Santangelo TJ, et al. Structure of histone-based chromatin in Archaea. Science. 2017;357:609–612. doi: 10.1126/science.aaj1849. - DOI - PMC - PubMed
    1. Luger K, Mäder AW, Richmond RK, Sargent DF, Richmond TJ. Crystal structure of the nucleosome core particle at 2.8 Å resolution. Nature. 1997;389:251–260. - PubMed

Publication types

LinkOut - more resources