. 2025 Apr 9;15(1):12072.
doi: 10.1038/s41598-025-96204-2.

Subclonal response heterogeneity to define cancer organoid therapeutic sensitivity

Affiliations

Subclonal response heterogeneity to define cancer organoid therapeutic sensitivity

Jeremy D Kratz et al. Sci Rep. .

Abstract

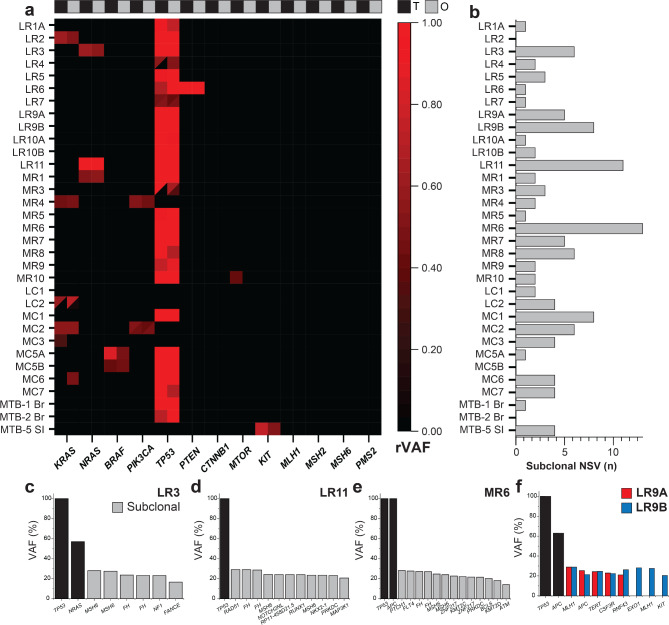
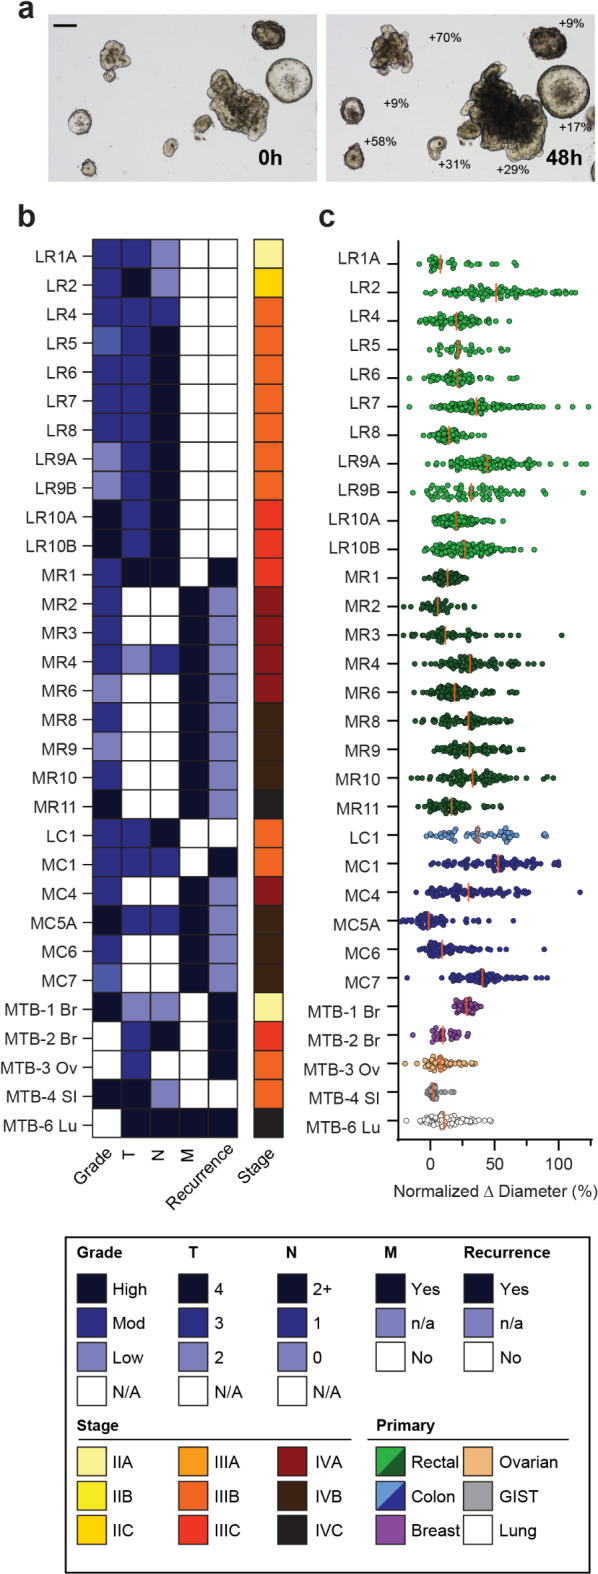
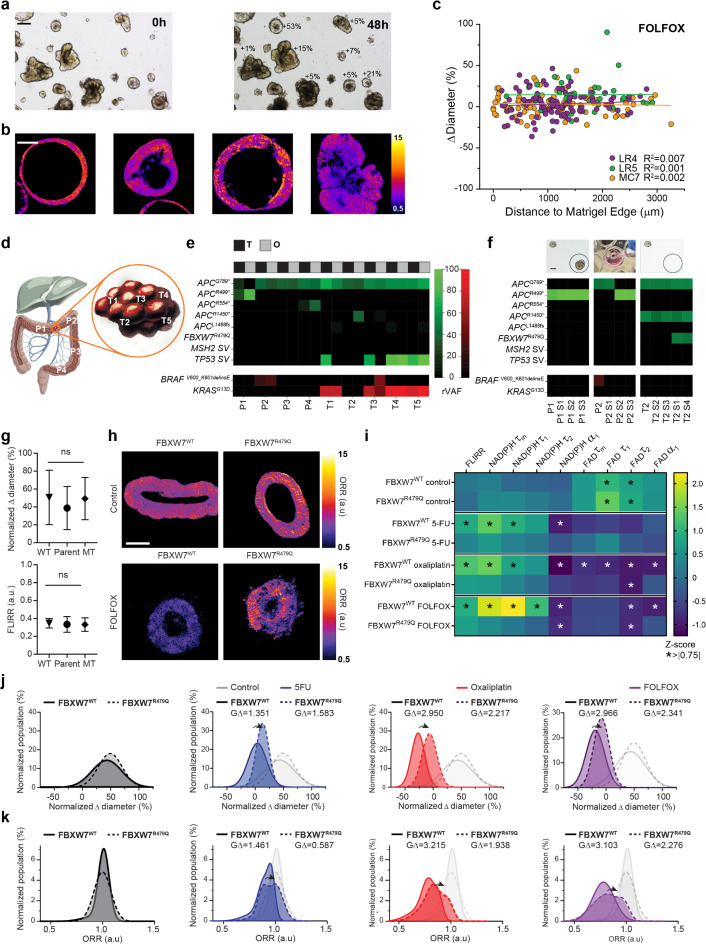
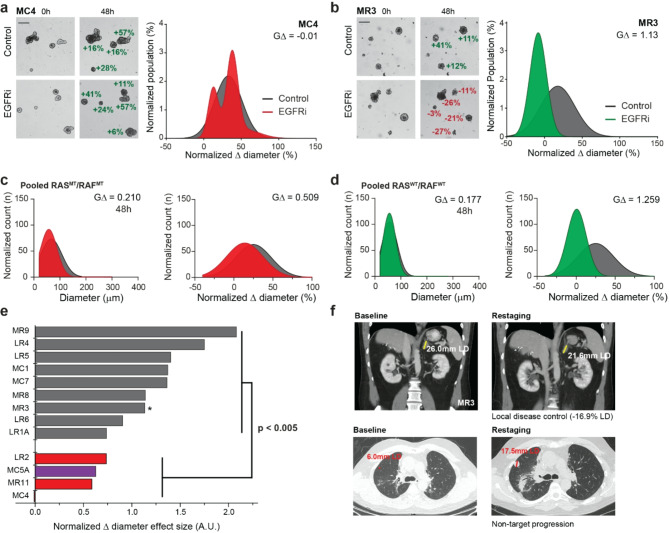
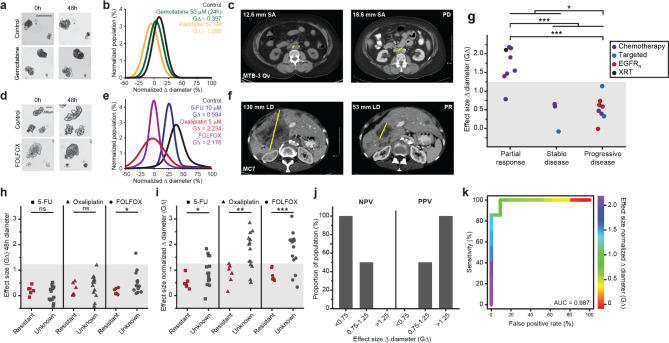
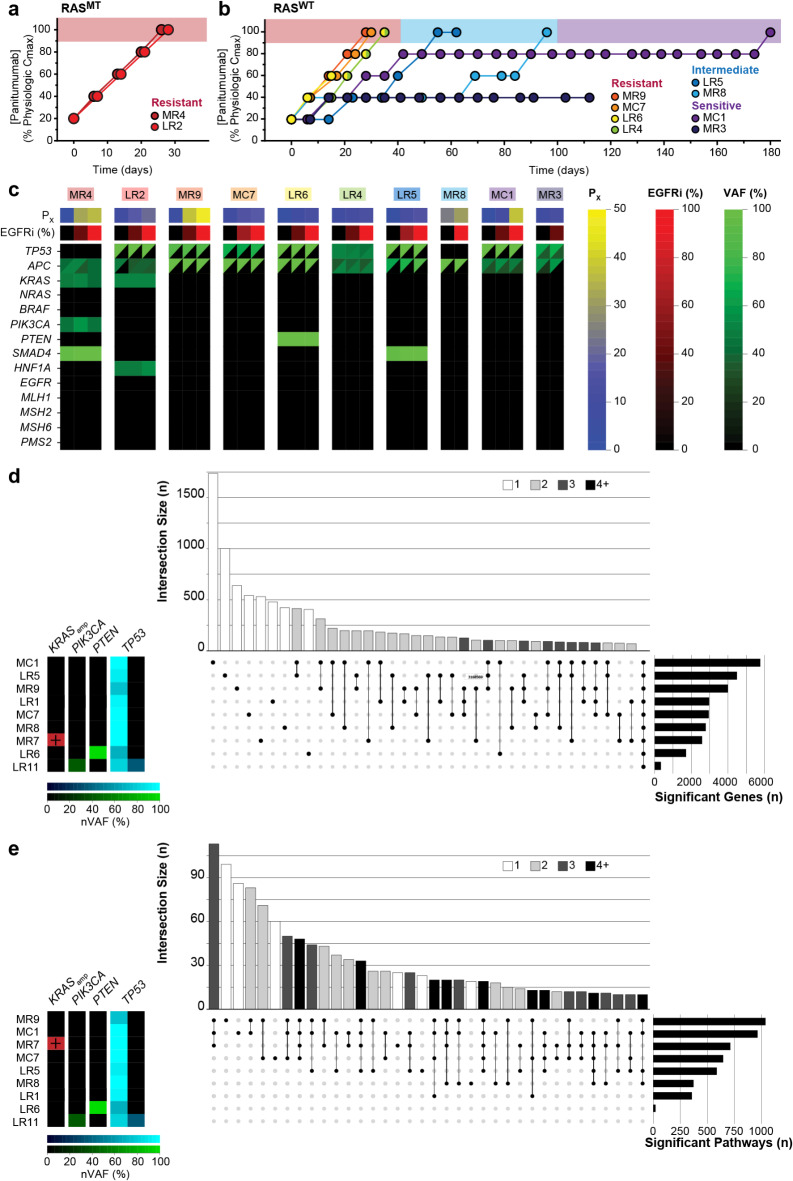
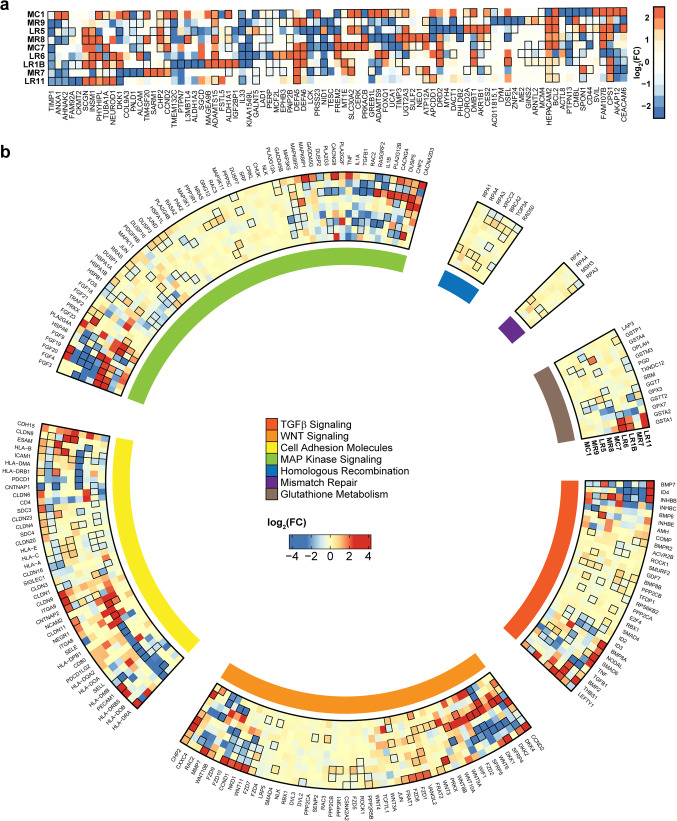
Tumor heterogeneity is predicted to confer inferior clinical outcomes with precision-based strategies, however, modeling heterogeneity in a manner that still represents the tumor of origin remains a formidable challenge. Sequencing technologies are limited in their ability to identify rare subclonal populations and predict response to treatments for patients. Patient-derived organotypic cultures have significantly improved the modeling of cancer biology by faithfully representing the molecular features of primary malignant tissues. Patient-derived cancer organoid (PCO) cultures contain subclonal populations with the potential to recapitulate heterogeneity, although treatment response assessments commonly ignore diversity in the molecular profile or treatment response. Here, we demonstrate the advantage of evaluating individual PCO heterogeneity to enhance the sensitivity of these assays for predicting clinical response. Additionally, organoid subcultures identify subclonal populations with altered treatment response. Finally, dose escalation studies of PCOs to targeted anti-EGFR therapy are utilized which reveal divergent pathway expression when compared to pretreatment cultures. Overall, these studies demonstrate the importance of population-based organoid response assessments, the use of PCOs to identify molecular heterogeneity not observed with bulk tumor sequencing, and PCO heterogeneity for understanding therapeutic resistance mechanisms.

Keywords: Clonal heterogeneity; Colorectal cancer; EGFR; Organoids; Targeted therapy.


Conflict of interest statement

Competing interests: The authors declare no competing interests.

Figures

Fig. 1
Fig. 1
Subclonal molecular heterogeneity in PCOs. (a) Heatmap of pathologic alterations between pairwise tumor (black, T) and expanded PCOs (gray, O) for reported pathologic driver alterations with split designation (triangles) for multiple concurrent gene alterations. All variants colored on heatmap according to relative variant allele frequency (rVAF). All cases were mismatch repair proficient. (b) Analysis of subclonal non-synonymous variants (NSV) defined between 10–30% from cancer hotspot testing in PCOs. (c–e) Representative examples of clonality including clonal (black) and subclonal variance (gray) across representative cancers. (f) Multisite sampling from patient LR9 from endoscopic biopsy with VAF plotted including clonal (black) and discordant subclonal alterations in EXO1, MLH1, and KIT from LR9A (red) and LR9B (blue).
Fig. 2
Fig. 2
PCO heterogeneity in growth. (a) Representative PCO brightfield microscopy (patient MC1, see Supp. Table 2) annotated with percent difference in individual organoid diameter. (b) Baseline clinical characteristics for cultures colored by the key below, including pathologic review of tumor grade and clinical parameters of stage from tumor (T), node (N) and metastases (M) combined to complete diagnostic staging (Stage). Current disease status noted (Recurrence in black). (c) Dot plots colored by the key below for primary tumor type (Primary) for localized rectal (light green), metastatic rectal (dark green), localized colon (light blue), metastatic colon (dark blue), breast (purple), ovarian (beige), gastrointestinal stromal tumor (GIST, gray), and lung (white) with each point representing an individual organoid for normalized Δ diameter at 48 h, median denoted with vertical bar (orange).
Fig. 3
Fig. 3
FOLFOX resistance monitoring reveals subclonal resistance from a patient with familial adenomatous polyposis. (a) Representative therapeutic study (patient LC1) with FOLFOX imaged with brightfield microscopy at 0 h and 48 h annotated with percent difference in individual organoid diameter and (b) representative images of organoids with two-photon ORR at 48 h. (c) Comparison of PCO location perpendicular to the matrix edge correlated against growth with FOLFOX treatment across three independent cultures (LR4, LR5, MC7) along with the coefficient of determinant (R2). (d) Sites of tissue sampling from patient with multiple site polyp (n = 4) and tumor sampling (n = 5). (e) Heatmap of pathologic alterations of PCOs derived from individual polyps (P1–P4) and tumors (T1–T5) compared between primary tissue (black, T) and organoids (gray, O) plotted as relative variant allele frequency (rVAF). Denoted are tumor suppressor genes (green) and oncogenes (red) plotted as a function of rVAR. (f) Heatmap of expanded PCO subclones selected by individual spikes using NGS profiling. (g) Comparison of normalized Δ diameter and FLIRR at 48 h stratified by parent culture, FBXW7WT (wild type, WT), and FBXW7R479Q (mutant, MT) using two-sided student t-test (p > 0.05). (h) Representative PCOs metabolism assessed at 48 h by ORR (NAD(P)H/FAD) for control (top panel) and FOLFOX stratified by FBXW7 profile. Scale bar represents 100 µm. (i) Heatmap of OMI parameters by FBXW7 status stratified with respective Z-score as compared to parent culture. Significance noted for |GΔ| > 0.75 for individual OMI parameters with corresponding positive (black *) or negative (white *) effect size. Z-score defined by formula image (average value of individual OMI parameter for individual PCO culture), formula image (average value of individual OMI parameter across the control population), σpopulation (standard deviation of an individual OMI parameter across the control population) for the control conditions formula image and σpopulation refer to parent culture values. (j,k) Gaussian distribution plots of normalized PCO diameter change assessed from 0 to 48 h including control (gray), 5-FU (blue), oxaliplatin (red), and FOLFOX (purple). Molecular profile at FBXW7 denoted wildtype (WT, solid line) and mutant FBXW7R479Q (MT, dashed line). Response assessed using effect size (GΔ) relative to untreated control stratified by molecular profile at FBXW7 for (j) normalized Δ diameter and (k) ORR at 48 h. Scale bars for brightfield (black bar) represent 200 µm, scale bars for OMI (white bar) represent 100 μm.
Fig. 4
Fig. 4
Assessment of PCO response to EGFR inhibition. (a) Representative brightfield images of therapeutic resistance of KRASA146V MC4 with persistent growth of control and panitumumab from 0 to 48 h in contrast to (b) RASWT MR3 with growth arrest assessed by normalized Δ diameter at the organoid level. (c) Pooled analysis of diameter for four independent lines predicted for resistance to EGFRi: RASMT (LR2, MR11, MC4) and BRAFV600E (MC5A) at 48 h (left panel) and change in diameter at 48 h (right panel) by assessment of individual PCOs normalized to baseline diameter at 0 h with corresponding effect size across distributions (GΔ). (d) Pooled analysis of diameter for nine independent RASWT/BRAFWT PCOs at 48 h (left panel) and change in diameter at 48 h (right panel) by assessment of individual PCOs normalized to baseline diameter at 0 h with corresponding effect size across distributions (GΔ). (e) Line-specific sensitivity plotted by effect size (GΔ) including RASWT/BRAFWT (gray) compared against RASMT (red) and BRAFV600E (violet) using student’s t-test for effect size of normalized Δ diameter. (f) MR3 PCO response of single agent EGFR inhbition (panitumumab) *denoted in (e) represents a prospective clinical assessment tracked on CT scan at a 15-week follow-up showing local disease control at the biopsy site and a non-target progression in the right upper lung. Green lines indicate longest diameter (LD) of adrenal metastasis at baseline and restaging and measurements of non-target disease progression in right lung.
Fig. 5
Fig. 5
Validation of PCO response for clinical prediction. (a) Representative brightfield microscopy from MTB-3 ovarian (Ov) PCOs at baseline and 48 h; scale bar represents 200 μm for each panel. (b) Gaussian distributions for growth at 48 h with respective effect sizes (GΔ) for MTB-3 Ov PCOs treated with gemcitabine 50 μm (24 h, green), paclitaxel 50 nM (48 h, gold) or control (black) as assessed at 48 h. (c) Clinical response from the initial restaging CT scan of subject MTB-3 confirming the disease with enlarging retroperitoneal adenopathy after treatment with single agent gemcitabine on CT imaging. (d) Representative brightfield microscopy for MC7 PCOs treated with control (top panels), or FOLFOX (5-FU 10 μm and oxaliplatin 5 mμ (e) Gaussian distributions of MC7 for Δ diameter over 48 h and respective effect sizes (GΔ) for 5-FU 10 μm (blue), oxaliplatin 5 μm (red), and FOLFOX (violet). (f) Restaging CT scan of MC7 shows partial response after FOLFOX. (g) Experimental sensitivity with clinical outcome or canonical mechanism of resistance labeled by treatment type including chemotherapy (purple), targeted therapy (blue), canonical EGFRi resistance (RASMT or RAFMT, red), and radiation (black) with reported significance by two-sided student t-test. (h,i) Comparison of FOLFOX effect size (GΔ) between PCOs with disease progression after FOLFOX chemotherapy versus subjects without prior drug exposure assessed using two-sided student t-test with prior established sensitivity thresholds (shaded region). (h) Absolute diameter effect size assessed at 48 h for single agent 5-FU (ns), oxaliplatin (ns) and FOLFOX (*p < 0.05) between clinically resistant and unknown cohorts. (i Effect size of growth (percent Δ diameter) tracked from 0 to 48 h for single agent 5-FU (*p < 0.05), oxaliplatin (**p < 0.005) and FOLFOX (***p < 0.0005) between clinically resistant and unknown cohorts. (j) Bar plot of negative predictive value (NPV) and positive predictive value (PPV) for prospectively treated subjects. (k) Receiver operator curve (ROC) in response prediction plotted as false positive rate versus sensitivity with the colored line showing the continuum of effect size (GΔ) for change in diameter and corresponding area under the curve (AUC).
Fig. 6
Fig. 6
Generation and molecular profiling of CRC PCOs with ex vivo resistance to EGFRi. (a,b) Time course of dose escalation stratified by RAS mutation profile including MT and WT. (c) Serial molecular profiling by cancer hotspot next generation sequencing of PCOs over the course of dose escalation with heat map labeling of absolute passage (Px, blue-yellow), physiologic Cmax of EGFRi (black-red), and alteration variant allele frequency (VAF, black-green) with split cells (triangle) representing multiple gene-specific alterations. (d) Upset plot for individual genes from RNASeq transcriptional profiles compared in triplicate between control and resistance to EGFRi panitumumab. Shown are clinical molecular profiles obtained at time of PCO profiling including designation for KRAS amplification (red +) and nVAF in PIK3CA (green), PTEN (green), all with concurrent alterations in TP53 (light blue). Size of intersection shown colored by comparison for unique genes for a single PCO (white), two PCOs (light gray), three PCOs (dark gray) or shared between 4 + lines (black) ordered in descending order. Black circles denote comparisons with individual gene alterations plotted for individual lines. Significance defined by padj < 0.05. (e) Upset plot for GSVAs plotted against molecular profile as outlined in (d) with significance defined by padj < 0.1 accounting for sign change using -log10(padj)*sign(FC). FC, fold change.
Fig. 7
Fig. 7
Heterogeneity in transcriptional resistance to EGFR inhibition in RASWT/RAFWT CRC PCOs. (a) Heatmap for pairwise comparison from base culture to resistance under selection of Cmax panitumumab with differential expression (n = 3) with significance shown with black box defining differential expression for individual genes if padj < 0.05 plotted as function of log2(FC). (b) Circa plot of KEGG pathway enrichment in RASWT/RAFWT CRC organoids. Each contiguous arc represents individual PCO lines with differential expression at EGFR inhibitor resistance organized by pathways grouped by individual colors including TGFβ (red), WNT signaling (orange), cell adhesion molecules (yellow), MAP kinase signaling (green), homologous recombination (blue), mismatch repair (violet), and glutathione metabolism (brown). Significance shown with black box defining differential expression for individual genes if padj < 0.05 and plotted as function of log2(FC).

Similar articles

Cited by

References

    1. Sato, T. et al. Long-term expansion of epithelial organoids from human colon, adenoma, adenocarcinoma, and Barrett’s epithelium. Gastroenterology141, 1762–1772 (2011). - PubMed
    1. Boj, S. F. et al. Organoid models of human and mouse ductal pancreatic cancer. Cell160, 324–338 (2015). - PMC - PubMed
    1. van de Wetering, M. et al. Prospective derivation of a living organoid biobank of colorectal cancer patients. Cell161, 933–945 (2015). - PMC - PubMed
    1. Rosenbluth, J. M. et al. Organoid cultures from normal and cancer-prone human breast tissues preserve complex epithelial lineages. Nat. Commun.11, 1–14 (2020). - PMC - PubMed
    1. Broutier, L. et al. Human primary liver cancer–derived organoid cultures for disease modeling and drug screening. Nat. Med.23, 1424 (2017). - PMC - PubMed