. 2025 Apr 8;15(1):12016.
doi: 10.1038/s41598-025-97172-3.

Novel digital markers of sleep dynamics: causal inference approach revealing age and gender phenotypes in obstructive sleep apnea

Affiliations

Novel digital markers of sleep dynamics: causal inference approach revealing age and gender phenotypes in obstructive sleep apnea

Michal Bechny et al. Sci Rep. .

Abstract

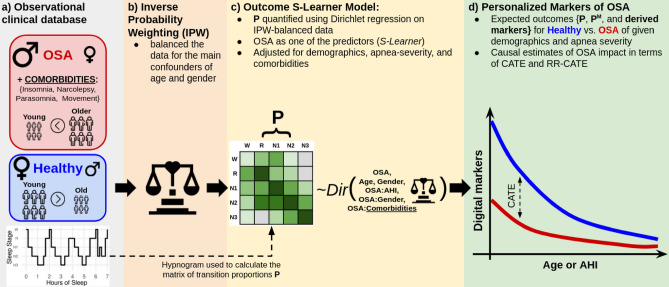
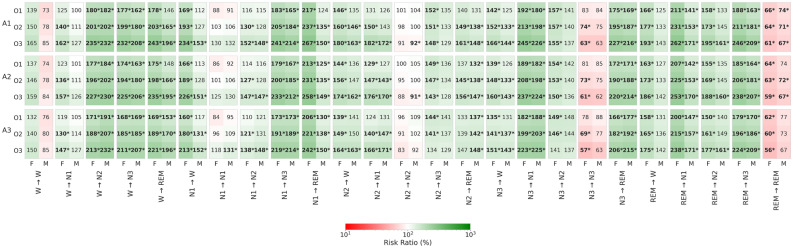
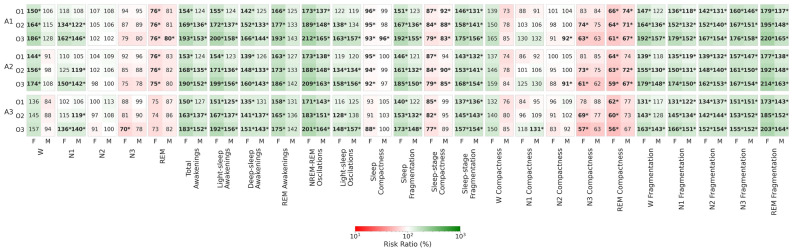
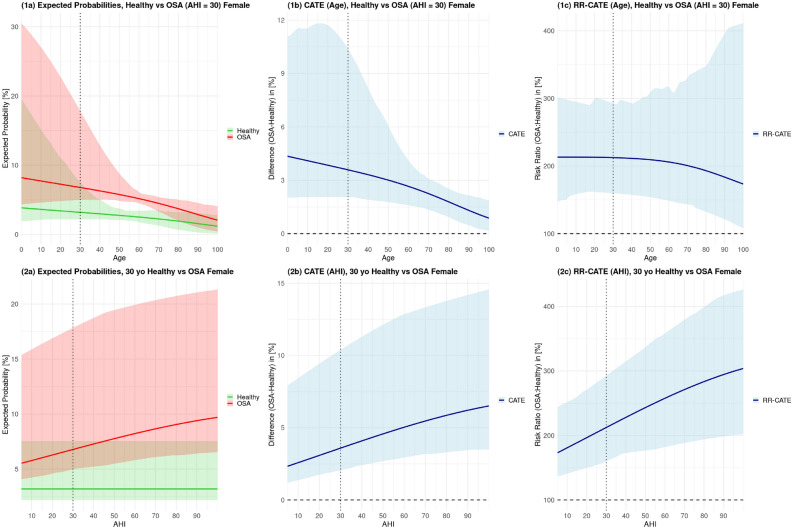
Despite evidence that sleep-disorders alter sleep-stage dynamics, only a limited amount of these parameters are included and interpreted in clinical practice, mainly due to unintuitive methodologies or lacking normative values. Leveraging the matrix of sleep-stage transition proportions, we propose (i) a general framework to quantify sleep-dynamics, (ii) several novel markers of their alterations, and (iii) demonstrate our approach using obstructive sleep apnea (OSA), one of the most prevalent sleep-disorder and a significant risk factor. Using causal inference techniques, we address confounding in an observational clinical database and estimate markers personalized by age, gender, and OSA-severity. Importantly, our approach adjusts for five categories of sleep-wake-related comorbidities, a factor overlooked in existing research but present in 48.6% of OSA-subjects in our high-quality dataset. Key markers, such as NREM-REM-oscillations and sleep-stage-specific fragmentations, were increased across all OSA-severities and demographic groups. Additionally, we identified distinct gender-phenotypes, suggesting that females may be more vulnerable to awakenings and REM-sleep-disruptions. External validation of the transition markers on the SHHS database confirmed their robustness in detecting sleep-disordered-breathing (average AUROC = 66.4%). With advancements in automated sleep-scoring and wearable devices, our approach holds promise for developing low-cost screening tools for sleep-, neurodegenerative-, and psychiatric-disorders exhibiting altered sleep patterns.

Keywords: Causal inference; Digital markers; Dirichlet regression; Obstructive sleep apnea; Polysomnography; Sleep disorders; Sleep dynamics.


Conflict of interest statement

Declarations. Competing interest: Mr Akifimi Kishi is supported by JST FORESTO program (grant no. JPMJFR2156), outside the submitted work. All authors declare no financial or non-financial competing interests.

Figures

Fig. 1
Fig. 1
Graphical overview of the implemented approach for quantifying sleep-stage dynamics. Part (a): The study utilized observational data, including hypnograms of subjects with a conclusive diagnosis of either obstructive sleep apnea (OSA) or healthy status. The illustration highlights differences in the overall prevalence of OSA (OSA-affected > healthy) concerning gender (male predominance in OSA), age (higher OSA prevalence in older subjects), and comorbidities (not present in healthy subjects). Part (b): Inverse Probability Weighting (IPW) is applied to balance the data for the primary confounders of age and gender, having distributional overlap between OSA and healthy subjects. Part (c): A sleep fingerprint matrix formula image of sleep-stage transition proportions is modelled using Dirichlet regression within a causal S-Learner framework to capture the effects of OSA, its severity (Apnea-Hypopnea Index, AHI), age, gender, and comorbidities. Part (d): the framework quantifies digital markers of OSA (raw formula image, formula image as the normalized Markovian formula image, and derived quantities such as sleep fragmentation), personalized for subjects’ demographics, OSA severity, and comorbidities, and presented in terms of conditional average treatment effect (CATE) and risk-ratio CATE (RR-CATE).
Fig. 2
Fig. 2
Heatmap of risk-ratio conditional-average-treatment-effects (RR-CATE) of OSA (compared to a matched healthy subject) on individual dimensions of sleep-fingerprint matrix formula image of sleep-stage transition proportions, per gender (F, M), age (A1, A2, A3), and OSA-severity (O1, O2, O3). Decreased (i.e., RR < 100%) and increased (i.e., RR > 100%) risk-ratios are depicted with red and green shaded backgrounds, respectively. Significant effects are in bold and highlighted with a star (*).
Fig. 3
Fig. 3
Heatmap of risk-ratio conditional-average-treatment-effects (RR-CATE) of OSA (compared to a matched healthy subject) on PSG-markers derived from matrix formula image of sleep-stage transition proportions, per gender (F, M), age (A1, A2, A3), and OSA-severity (O1, O2, O3). Decreased (i.e., RR < 100%) and increased (i.e., RR > 100%) risk-ratios are depicted with red and green shaded backgrounds, respectively. Significant effects are in bold and highlighted with a star (*).
Fig. 4
Fig. 4
Effects of age and OSA-severities on NREM-REM oscillations, formula image, in females. The left plots (1a, 2a) depict expected probabilities for varying age with fixed AHI = 30, and for varying AHI with fixed age = 30. Based on that, the central (1b, 2b) and right (1c, 2c) plots depict age- and AHI-related CATE and RR-CATE.
Fig. 5
Fig. 5
Heatmap of risk-ratio conditional-average-treatment-effects (RR-CATE) of OSA (compared to a matched healthy subject) on individual dimensions of row-normalized Markovian transition matrix formula image, per gender (F, M), age (A1, A2, A3), and OSA-severity (O1, O2, O3). Decreased (i.e., RR < 100%) and increased (i.e., RR > 100%) risk-ratios are depicted with red and green shaded backgrounds, respectively. Significant effects are in bold and highlighted with a star (*).

Similar articles

References

    1. Berry, R. B. et al. Aasm scoring manual version 2.2 updates: new chapters for scoring infant sleep staging and home sleep apnea testing (2015). - PMC - PubMed
    1. Redline, S. et al. The effects of age, sex, ethnicity, and sleep-disordered breathing on sleep architecture. Arch. Intern. Med.164, 406–418 (2004). - PubMed
    1. Carskadon, M. A. et al. Normal human sleep: An overview. Prin. Pract. Sleep Med.4, 13–23 (2005).
    1. Sahlin, C., Franklin, K. A., Stenlund, H. & Lindberg, E. Sleep in women: normal values for sleep stages and position and the effect of age, obesity, sleep apnea, smoking, alcohol and hypertension. Sleep Med.10, 1025–1030 (2009). - PubMed
    1. Luca, G. et al. Age and gender variations of sleep in subjects without sleep disorders. Ann. Med.47, 482–491 (2015). - PubMed

Grants and funding