. 2025 Apr 8;15(1):12044.
doi: 10.1038/s41598-025-96405-9.

PCYT2 mediates ovarian epithelial cancer metastasis by regulating cell membrane fluidity through the AMPK/FOXO1 signalling pathway

Affiliations

PCYT2 mediates ovarian epithelial cancer metastasis by regulating cell membrane fluidity through the AMPK/FOXO1 signalling pathway

Hailin Chen et al. Sci Rep. .

Abstract

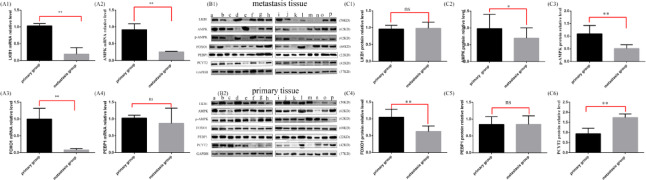
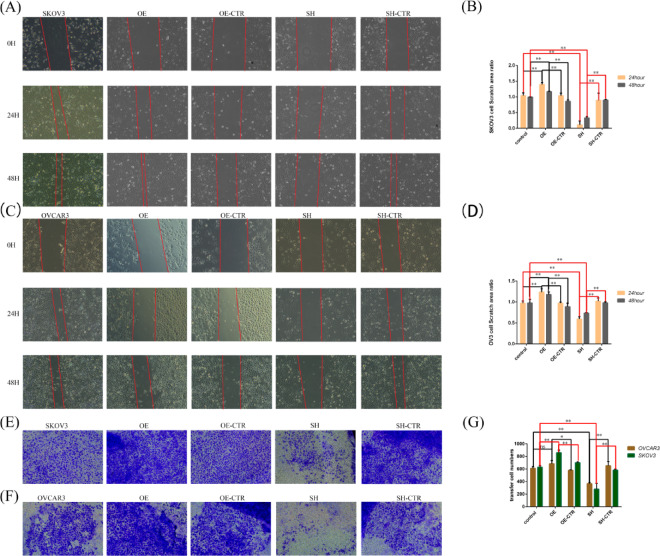
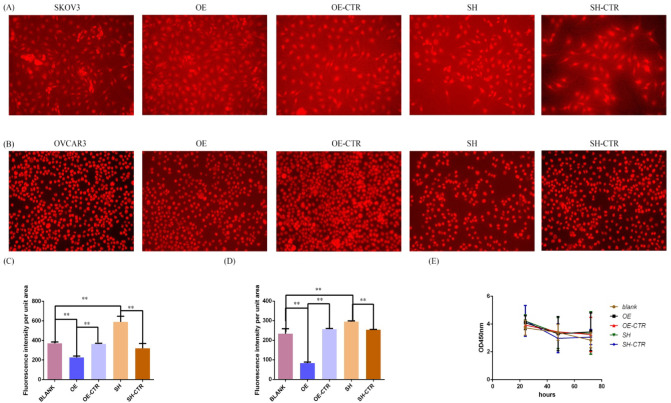
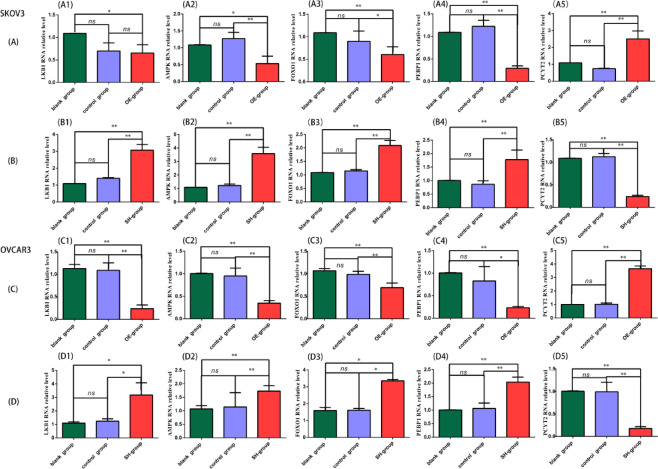
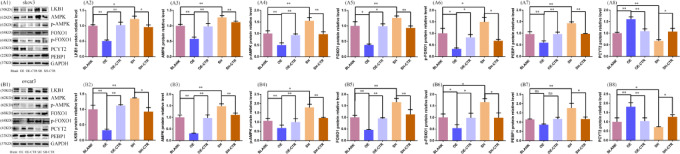
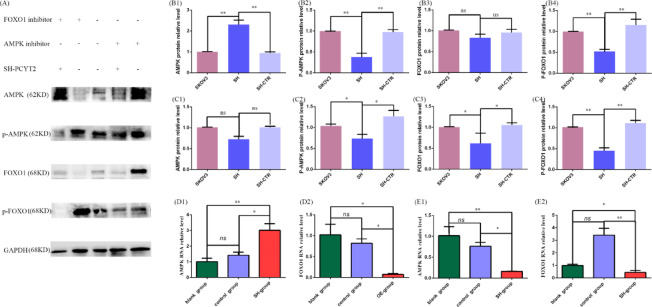
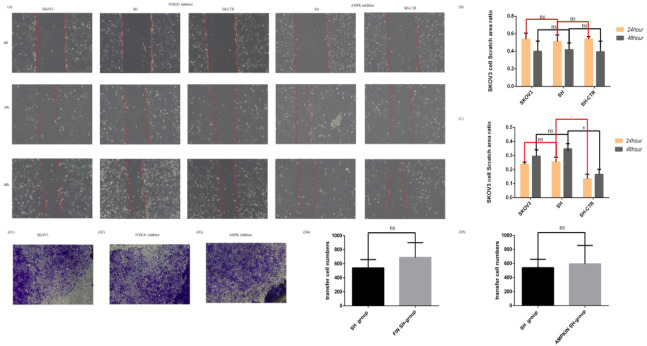
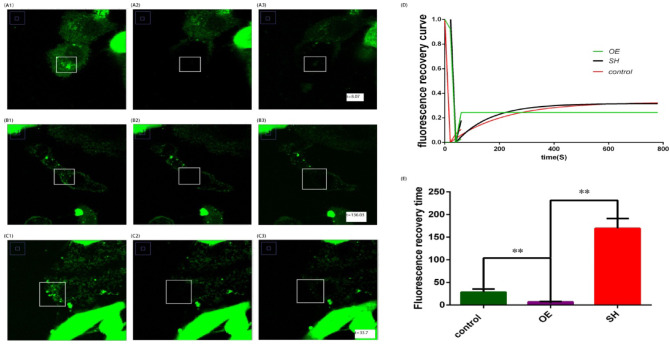
This study investigates the role of phosphatidylethanolamine cytidylyltransferase 2 (PCYT2) in ovarian epithelial cancer, specifically examining its effects on cell migration and membrane fluidity. To achieve this, we will examine how the AMPK and FOXO1 pathways regulate these processes. Our analysis revealed a significant upregulation of PCYT2 expression in metastatic ovarian cancer tissues compared to primary cancer sites, which correlates with altered membrane fluidity. Our data indicate that PCYT2 is essential for modulating the invasive characteristics of ovarian cancer cells. It does this by regulating the expression levels of AMPK and FOXO1, suggesting its role as an upstream regulator in this signaling pathway. Experiments that either inhibit or enhance PCYT2 activity suggest that it may influence cancer cell infiltration by changing membrane fluidity. These findings provide valuable insights into the molecular mechanisms of ovarian cancer metastasis and highlight PCYT2 as a promising therapeutic target. Future research should validate these findings in larger cohort studies, and also explore the therapeutic potential of targeting PCYT2 in ovarian cancer treatment. In conclusion, although there have been substantial advancements in ovarian cancer therapies, the intricate nature of its metastatic behavior remains a major challenge. Our research clearly demonstrates the critical role of PCYT2, urging the scientific community to deepen their understanding of its involvement in cancer progression and to develop innovative treatment strategies.

Keywords: AMPK/FOXO1 signalling pathway; Cell membrane fluidity; Metastasis.; Ovarian epithelial cancer; PCYT2.


Conflict of interest statement

Declarations. Informed consent statement: Written informed consent, covering the use of clinical data and tumour tissue for research purposes, was obtained from all participating patients. Institutional review board statement: The study protocol received approval from the Institutional Review Board (IRB) of Qingpu Branch of Zhongshan Hospital (IRB No. 2022-39) and was conducted in accordance with the ethical principles outlined in the 1975 Declaration of Helsinki (6th revision, 2008). Competing interests: The authors declare no competing interests.

Figures

Fig. 1
Fig. 1
Expression of key molecules in the AMPK/FOXO1 pathway in clinical samples. In this figure the X-axis of the bar graph, the primary group (black column) represents the primary foci of ovarian epithelial carcinoma, while the metastasis group (grey column) represents the metastatic foci. Graphs (A1) to (A4) show the relative mRNA expression levels of LKB1, AMPK, FOXO1 and PEBP1 in the metastatic foci of high-grade ovarian plasma adenocarcinoma. The X-axis of the bar graph indicates the different subgroups and the Y-axis indicates the relative expression of mRNAs. Figures (B1) and (B2) present the immunoblotting results for protein expression levels of LKB1, AMPK, p-AMPK, FOXO1, PEBP1 and PCYT2 in both metastatic and primary tissues. Figure (B1) display protein expression maps for the primary foci of high-grade ovarian adenocarcinoma, labeled from a top, corresponding to the metastatic foci (graph (B2)). Figures (C1) to (C6) present quantitative analyses of protein expression levels for LKB1, AMPK, p-AMPK, FOXO1, PEBP1 and PCYT2 in the metastatic foci of high-grade ovarian plasma adenocarcinoma. The X-axis of the bar graph indicates the different subgroups and the Y-axis indicates the relative expression of proteins.36 WB blot plots for pairs of primary and metastatic samples are shown in SUPPLEMENTARY FIGURE, with primary and metastatic blots corresponding to each other(*p < 0.05, **p < 0.001, ns = no significant difference).
Fig. 2
Fig. 2
PCYT2 regulates ovarian cancer cell invasion and metastasis. This figure presents several graphs, where SKOV3/OVCAR3/control denotes the untreated cell line, and OE indicates the SKOV3/OVCAR3 cell line that overexpresses the PCYT2 gene, OE-CTR is SKOV3/OVCAR3 cell line transfected with control plasmid corresponding to the overexpression plasmid, SH refers to SKOV3 /OVCAR3 cell line knocked out of the PCYT2 gene and SH-CTR refers to SKOV3/OVCAR3 cell line transfected with control plasmid corresponding to the silence-expression plasmid. The figure displays healing area maps of cell scratches taken at various time points. 0 H represents the cell scratch area at time point 0 h, while 24 H indicates the area after 24 h of cell culture after scratched. 48 H is the cell scratch area taken again after 48 h of cell culture of the scratched. (A) Shows the healing of cell scratches in SKOV3 cells at 0, 24, and 48 h after PCYT2 overexpression and knockdown, compared to the blank and control groups. (C) Shows the healing of cell scratches in OVCAR3 cells at 0 h, 24 h, and 48 h following the overexpression and knockdown of PCYT2, compared to the blank and control groups. (E) and (F) how a transwell experiment result for SKOV3 and OVCAR3 cells that either overexpress or have knocked down PCYT2 expression. (B) and (D) present statistical plots illustrating the scratch healing ratios of SKOV3 and OVCAR3 cells before and after adjusting PCYT2 expression, respectively. The x-axis shows the different sub-groups and the y-axis shows the ratio of healed scratches. Yellow bars represent the percentage of the scratch-healed area of cells at 24 h, while grey bars represent the percentage at 48 h. (G) Illustrates the statistical differences in invasion ability between SKOV3 and OVCAR3 cells after PCYT2 regulation. The x-axis represents the different subgroups. The y-axis represents the number of cells invaded. The earthy yellow bar represents the number of infiltrating OVCAR3 cells, while the green bar indicates the number of infiltrating SKOV3 cells.
Fig. 3
Fig. 3
PCYT2 regulation of apoptosis in ovarian cancer cells. In this figure, the following abbreviations are used: SKOV3/OVCAR3/Blank represents the untreated cell line, OE denotes the cell line overexpressing the PCYT2 gene, OE-CTR indicates the cell line transfected with a control plasmid for PCYT2 overexpression, SH refers to the cell line with PCYT2 gene knockout, and SH-CTR is the cell line transfected with a control plasmid for PCYT2 knockout. Fluorescent staining of apoptotic SKOV3 and OVCAR3 cells is shown in figures (A) and (B). Figures (C) and (D) show statistical plots of the apoptosis rates of the two groups of cells after PCYT2 expression regulation. In the bar graphs (C) and (D), the x-axis represents experimental subgroups related to PCYT2 modulation. The y-axis indicates the fluorescence intensity per unit area. In line graph (E), the x-axis represents time points, and the y-axis shows the absorbance value at 450 nm. Different colors represent the OD450 of cells measured at 24 h, 48 h, and 72 h. The colors in the graph denote specific groups: yellow for the untreated group (Blank), black for the PCYT2 overexpression group (OE), red for the control plasmid of the overexpression group (OE-CTR), green for the PCYT2 knockdown group (SH), and blue for the control plasmid of the knockdown group (SH-CTR).
Fig. 4
Fig. 4
PCYT2 is involved in the regulation of the AMPK/FOXO1 signalling pathway. (A) and (C) correspond to SKOV3/OVCAR3 cells overexpressing PCYT2 and (B) and (D) correspond to SKOV3/OVCAR3 cells knocking down PCYT2. Graphs (A1) and (B4), showing the relative mRNA expression levels of LKB1, AMPK, FOXO1 and PEBP1 in SKOV3 cells. These levels were measured after the overexpression and knockdown of PCYT2. Graphs (C1) and (D4) illustrate the relative mRNA expression levels of LKB1, AMPK, FOXO1 and PEBP1 in OVCAR3 cells after the overexpression and knockdown of PCYT2. In the figure x-axis indicates the grouping and the y-axis indicates the relative expression of mRNAs for each bar. The groups are defined as follows: the blank group (green column) consists of cells not transfected with any plasmid; the control group (purple column) includes cells transfected with a control plasmid; the OE group (red column) refers to cells transfected with a plasmid that overexpresses PCYT2; and the SH group (red column) consists of cells transfected with a plasmid that knocks down PCYT2 expression.
Fig. 5
Fig. 5
PCYT2 regulates the expression of key proteins of the AMPK/FOXO1 signalling pathway. This figure displays immunoblotting plots in graphs (A1) and (B1).These plots show the expression of key molecular proteins in the AMPK/FOXO1 pathway, which is regulated by PCYT2 in SKOV3 and OVCAR3 cells. The right side of the blot indicates the molecular weight of the target protein, while the left side lists the target protein’s name. Graphs (A2) to (A8) display the relative expression levels of LKB1, AMPK p-AMPK, FOXO1, p-FOXO1 and PEBP1 proteins in SKOV3 cells after PCYT2 overexpression and knockdown. The relative expression levels of LKB1, AMPK, p-AMPK, FOXO1, p-FOXO1 and PEBP1 proteins in OVCAR3 cells are depicted in Figures (B2) to (B8), highlighting the effects of PCYT2 overexpression and knockdown. In the figures x-axis indicates the grouping and the y-axis indicates the relative expression of proteins for each bar. The blank group consists of cells that were not transfected with any plasmid. The OE-CTR/SH-CTR group includes cells transfected with a control plasmid. The OE group contains cells that overexpress the PCYT2 plasmid, while the SH group includes cells with a plasmid that reduces PCYT2 expression. All experiments were repeated three times.
Fig. 6
Fig. 6
Pathway inhibitor reverses AMPK/FOXO1 signalling pathway activation by PCYT2. (A) Presents the immunoblotting results which PCYT2 gene has been knockdown in SKOV3 ovarian cancer cells, then additioned AMPK or FOXO1 inhibitors to evaluate proteins expression levels. (A), the upper half indicates that the presence of the FOXO1 or AMPK inhibitor is marked with a+, while their absence is marked with a−.The knockout of the PCYT2 gene is represented as SH-PCYT2+, while the wild-type PCYT2 gene is represented as SH-PCYT2-.The left side of the figure displays the names and molecular weights of the target proteins. Figures (B1) to (B4)show the level of FOXO1 and p-FOXO1 expression in PCYT2 knockdown SKOV3 cells after treatment with FOXO1 inhibitors. Figures (C1) to (C4)show the level of AMPK, p-AMPK, FOXO1 and p-FOXO1 expression in PCYT2 knockdown SKOV3 cells treated with an AMPK inhibitor. In figures (B1) to (C4), the x-axis shows the different groups, and the y-axis displays the relative protein expression for each bar.SKOV3 refers to cells that were not with any plasmid.SH indicates that a plasmid transfected to knock down PCYT2 expression in SKOV3 cells.SH-CTR denotes cells transfected with a control plasmid. Figures (D1) and (D2) show the relative mRNA expression levels of AMPK and FOXO1 in SKOV3 cells with PCYT2 knockdown after treatment with a FOXO1 inhibitor. Figures (E1) and (E2) show the relative expression of AMPK and FOXO1 mRNA in PCYT2 knockdown SKOV3 cells after adding AMPK inhibitors to the culture medium. In Figures (D1) to (E2), the x-axis represents the groupings, while the y-axis shows the relative mRNA expression for each bar. Blank group indicates the group of cells that were not transfected with any plasmid, the control group indicates the group of cells that were transfected with a control plasmid, and the SH-group indicates the group of cells that were transfected to knock down the expression of the PCYT2 plasmid.
Fig. 7
Fig. 7
Pathway inhibitors reverse PCYT2-induced invasion and metastatic activation. This figure displays graphs showing the SKOV3 cell line (untreated), the SH/SH group (with knocked-down PCYT2 expression), and the SH-CTR group (transfected with a control plasmid corresponding to the knockdown plasmid). Graph (A) depicts the healing of cell scratches observed at 24 and 48 h after the application of FOXO1 and AMPK inhibitors, in the context of PCYT2 gene knockdown. The first column of the scratch plot shows the healing progress of the SKOV3 cell line at 0, 24, and 48 h after the scratching. The second and third columns display scratch healing at 0, 24, and 48 h after the addition of the FOXO1 inhibitor to the SH and SH-CTR cells, respectively. The fourth and fifth columns show scratch healing at 0 h, 24 h and 48 h after addition of AMPK inhibitor to SH cells and SH-CTR cells, respectively. In figures (B) and (C), the x-axis represents the groups, while the y-axis shows the ratio of the scratch healing area SKOV3 identifies non-transfected plasmid cells, SH-CTR identifies cells transfected with a control plasmid, and SH identifies cells transfected with a plasmid for PCYT2 expression knockdown. (B) Presents a statistical plot illustrating the healing area ratio of scratches in SKOV3 cells with PCYT2 gene knockdown following the addition of the FOXO1 inhibitor. Graph (C) presents a statistical plot showing the ratio of scratch healing area in SKOV3 cells with PCYT2 gene knockdown after AMPK inhibitor treatment. (D1) to (D3) illustrate the number of ovarian cancer cells that migrated to the opposite side of the transwell chamber membrane after 48 h of treatment. This treatment involved FOXO1 and AMPK inhibitors while PCYT2 gene knockdown was present. (D1) Displays transwell plots of untreated SKOV3 cells, (D2) Shows plots for SKOV3 with PCYT2 knockdown and cultured with the FOXO1 inhibitor, and (D3) presents plots for SKOV3 with PCYT2 knockdown and treated with the AMPK inhibitor. (D4) and (D5) Illustrate the impact of FOXO1 inhibitor and AMPK inhibitor on the migration of ovarian cancer cells with PCYT2 knockdown. In (D4) and (D5), “FIN” stands for FOXO1 inhibitor, while “AMPKIN” denotes AMPK inhibitor. All experiments were conducted in triplicate to ensure reliability of the results.
Fig. 8
Fig. 8
Interference with PCYT2 expression affects cell membrane fluidity. This figure includes three subfigures: (A) a fluorescence bleach plot of SKOV3 cells overexpressing PCYT2, (B) a plot of SKOV3 cells with reduced PCYT2 expression, this figure comprises three experimental panels (AC) with corresponding membrane dynamics analysis (DE). (AC) Show sequential fluorescence patterns in SKOV3 cells: (A) PCYT2-overexpressing (OE), (B) PCYT2-knockdown (SH), and (C) non-transfected control cells. Each main panel contains three subpanels: pre-bleach images (A1-C1), immediate post-bleach capture (A2-C2), and membrane recovery phases (A3-C3).Time-to-half-recovery (t1/2)values are annotated in the lower right corners of recovery subpanels. (D) Quantifies fluorescence recovery kinetics through normalized intensity curves: green (OE), black (SH), and red (control).The x-axis represents time post-bleach (seconds), while the y-axis indicates relative fluorescence intensity. Corresponding t1/2 values are compared in (E), demonstrating significant differences between experimental groups (OE vs. SH vs. control, **P < 0.001).The horizontal axis represents the experimental groups: Control for untreated SKOV3 cells (Green Column), OE for SKOV3 cells that overexpress PCYT2(Purple Column), and SH for SKOV3 cells with PCYT2 knockdown (Red Column).The vertical axis shows the time required to restore the original fluorescence intensity. In the figure, he control group are SKOV3 cells that were not transfected with any plasmid, the OE group are the cells transfected with a plasmid that overexpresses PCYT2, and the SH group are the cells transfected with a plasmid that knocks down the expression of PCYT2.

Similar articles

References

    1. Bachmayr-Heyda, A. et al. Small RNAs and the competing endogenous RNA network in high grade serous ovarian cancer tumor spread. Oncotarget7(26), 39640–39653 (2016). - PMC - PubMed
    1. Kriplani, D. & Patel, M. M. Immunohistochemistry: A diagnostic aid in differentiating primary epithelial ovarian tumors and tumors metastatic to the ovary. South. Asian J. Cancer. 2(4), 254–258 (2013). - PMC - PubMed
    1. McGowan, L. Pathology of the ovary. Curr. Opin. Obstet. Gynecol.3(4), 580–586 (1991). - PubMed
    1. Li, X. Q. et al. Angiotensin-converting enzyme-dependent intrarenal angiotensin II contributes to CTP: phosphoethanolamine cytidylyltransferase downregulation, mitochondrial membranous disruption, and reactive oxygen species overgeneration in diabetic tubulopathy. Antioxid. Redox Signal. (2024). - PubMed
    1. Gulshan, K., Shahi, P. & Moye-Rowley, W. S. Compartment-specific synthesis of phosphatidylethanolamine is required for normal heavy metal resistance. Mol. Biol. Cell.21(3), 443–455 (2010). - PMC - PubMed

MeSH terms

Substances