

Spatio-temporal modelling and prediction of malaria incidence in Mozambique using climatic indicators from 2001 to 2018
- PMID: 40200072
- PMCID: PMC11978812
- DOI: 10.1038/s41598-025-97072-6
Spatio-temporal modelling and prediction of malaria incidence in Mozambique using climatic indicators from 2001 to 2018
Abstract
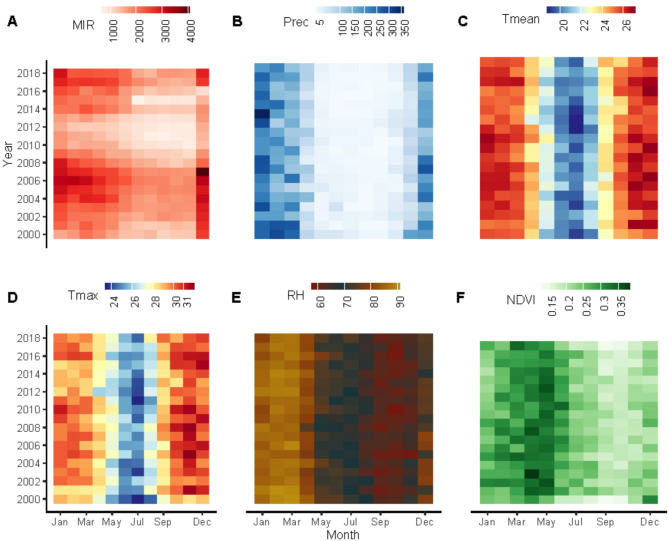
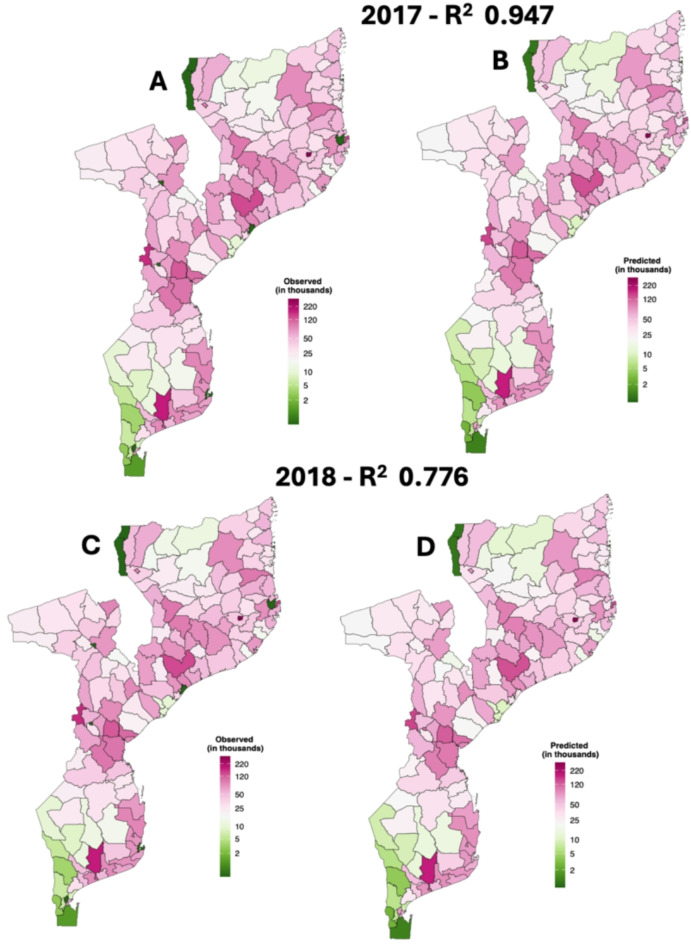
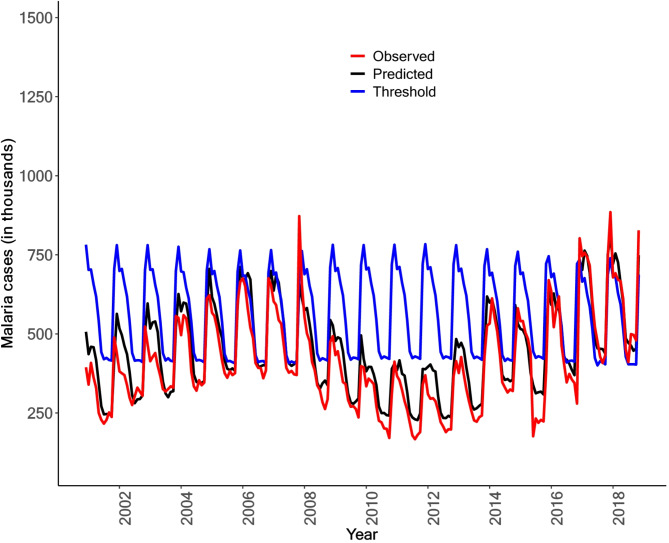
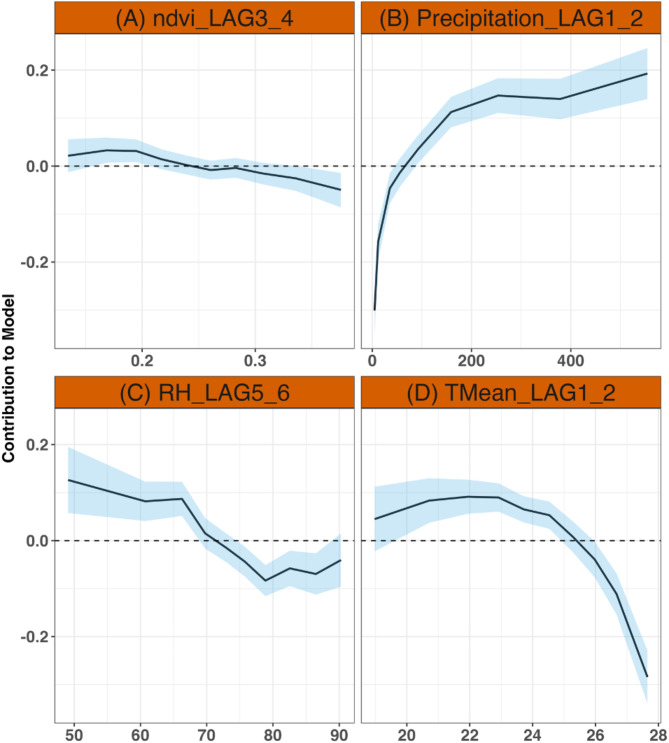
Accurate malaria predictions are essential for implementing timely interventions, particularly in Mozambique, where climate factors strongly influence transmission. This study aims to develop and evaluate a spatial-temporal prediction model for malaria incidence in Mozambique for potential use in a malaria early warning system (MEWS). We used monthly data on malaria cases from 2001 to 2018 in Mozambique, the model incorporated lagged climate variables selected through Deviance Information Criterion (DIC), including mean temperature and precipitation (1-2 months), relative humidity (5-6 months), and Normalized Different Vegetation Index (NDVI) (3-4 months). Predictive distributions from monthly cross-validations were employed to calculate threshold exceedance probabilities, with district-specific thresholds set at the 75th percentile of historical monthly malaria incidence. The model's ability to predict high and low malaria seasons was evaluated using receiver operating characteristic (ROC) analysis. Results indicated that malaria incidence in Mozambique peaks from November to April, offering a predictive lead time of up to 4 months. The model demonstrated high predictive power with an area under the curve (AUC) of 0.897 (0.893-0.901), sensitivity of 0.835 (0.827-0.843), and specificity of 0.793 (0.787-0.798), underscoring its suitability for integration into a MEWS. Thus, incorporating climate information within a multisectoral approach is essential for enhancing malaria prevention interventions effectiveness.
Keywords: Climate; Early warning; Malaria; Mozambique; Prediction.
© 2025. The Author(s).
Conflict of interest statement
Declarations. Competing interests: The authors declare no competing interests.
Figures
References
-
- CDC, Malaria is a serious disease (2023).
-
- Organization, W. H. World Malaria Report 2022 (World Health Organization, 2022).
MeSH terms
LinkOut - more resources
Full Text Sources
Medical
Miscellaneous
