

Single-cell transcriptome sequencing reveals the mechanism of Realgar improvement on erythropoiesis in mice with myelodysplastic syndrome
- PMID: 40200265
- PMCID: PMC11978147
- DOI: 10.1186/s12935-025-03768-0
Single-cell transcriptome sequencing reveals the mechanism of Realgar improvement on erythropoiesis in mice with myelodysplastic syndrome
Abstract
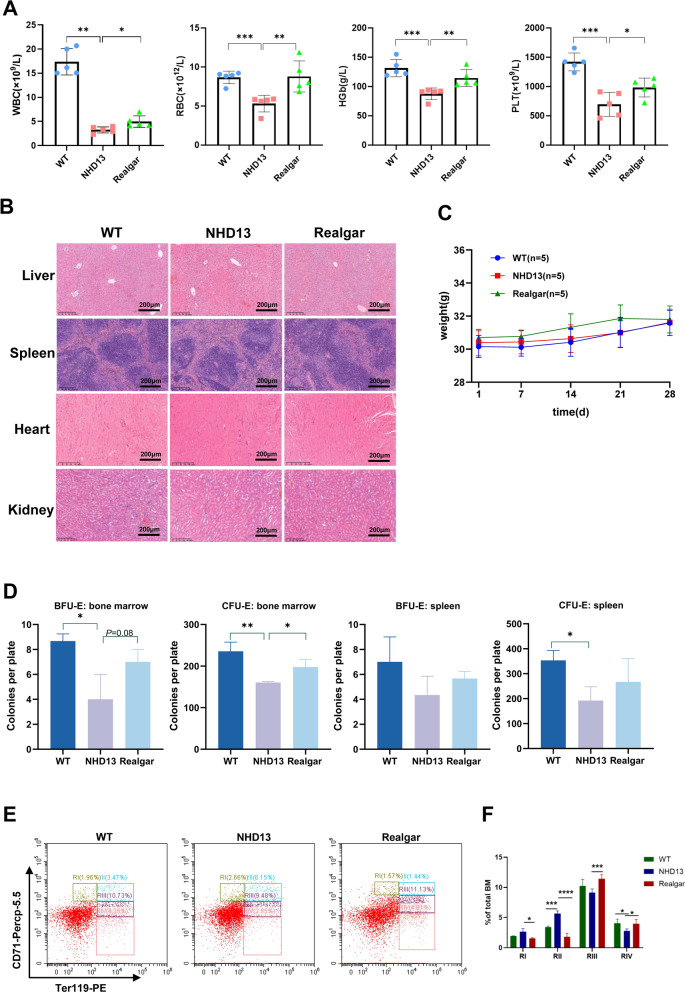
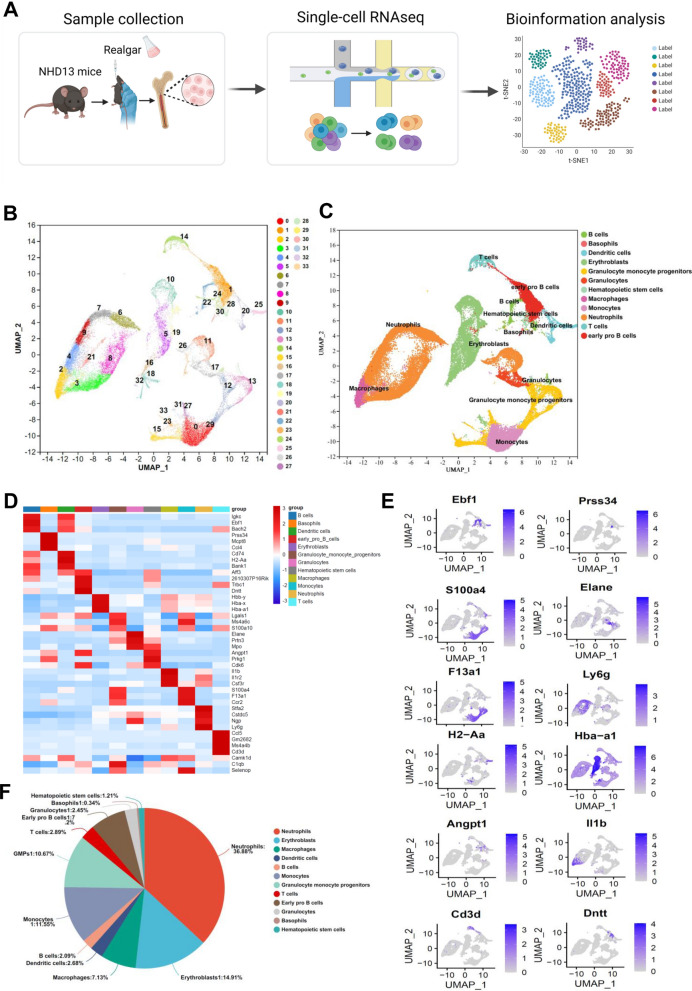
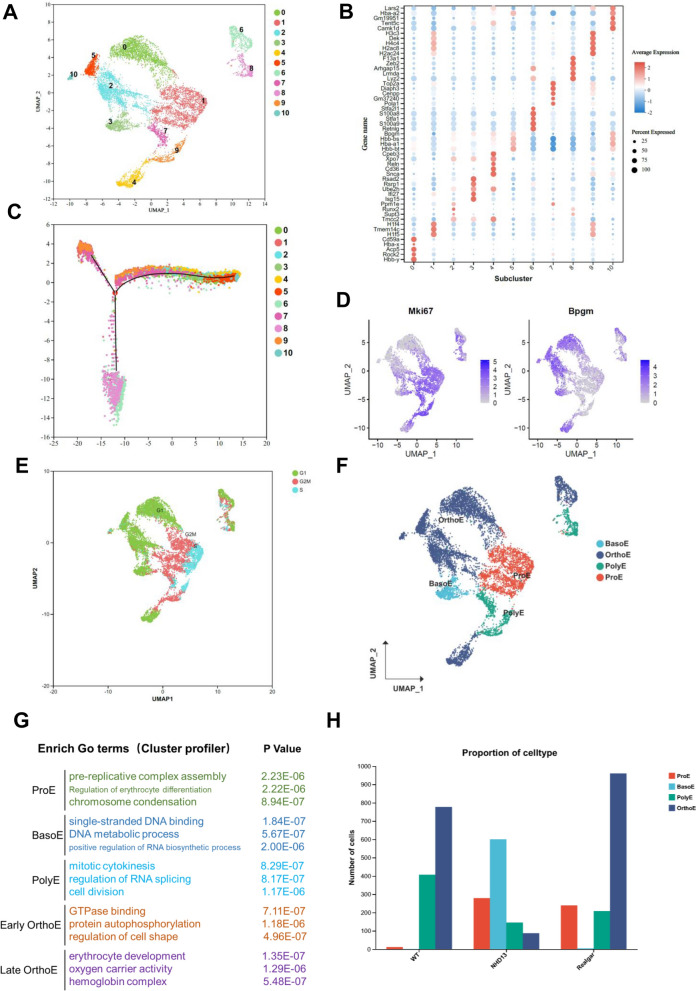
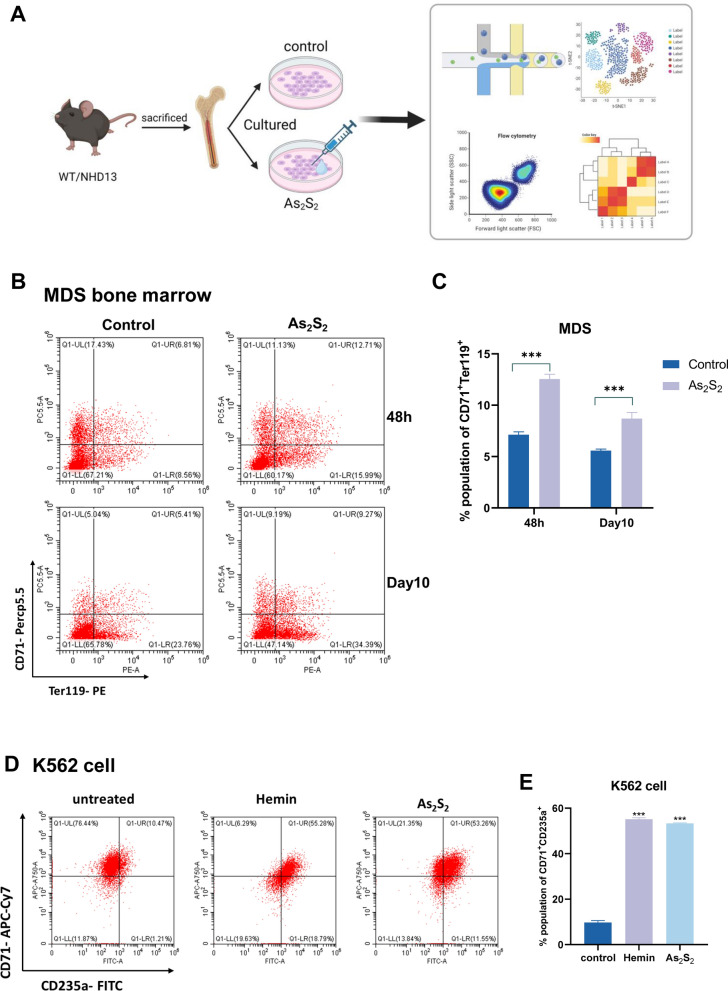
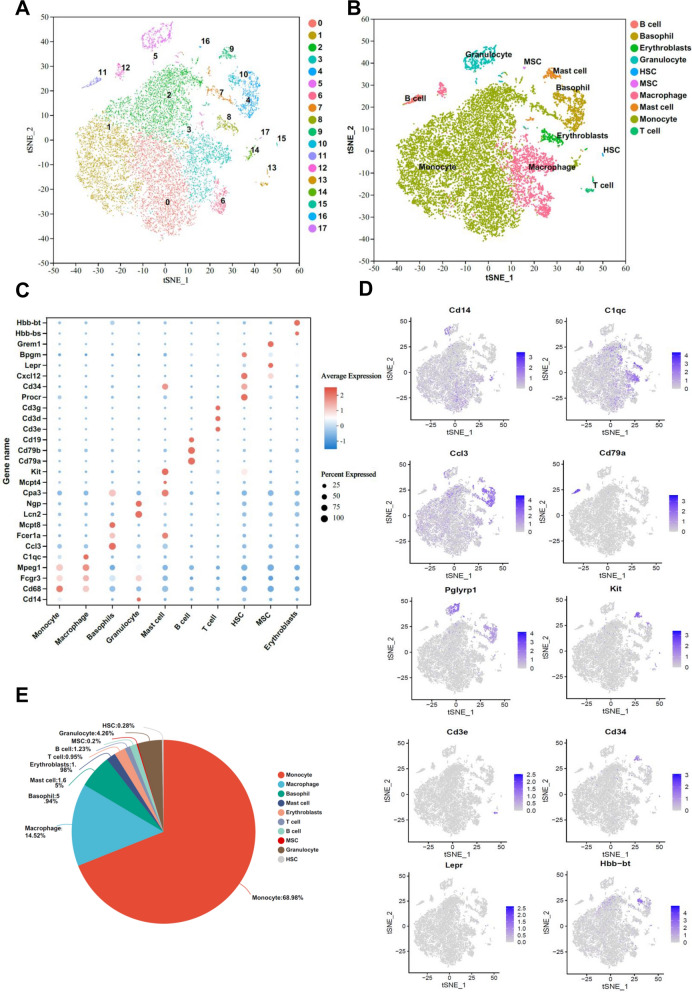
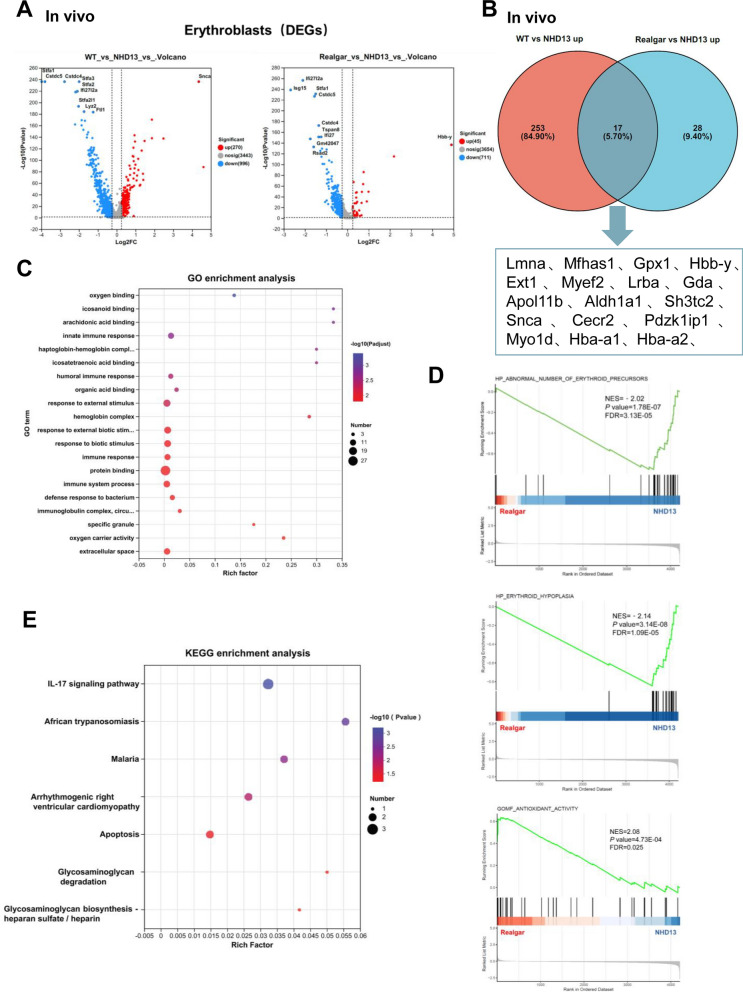
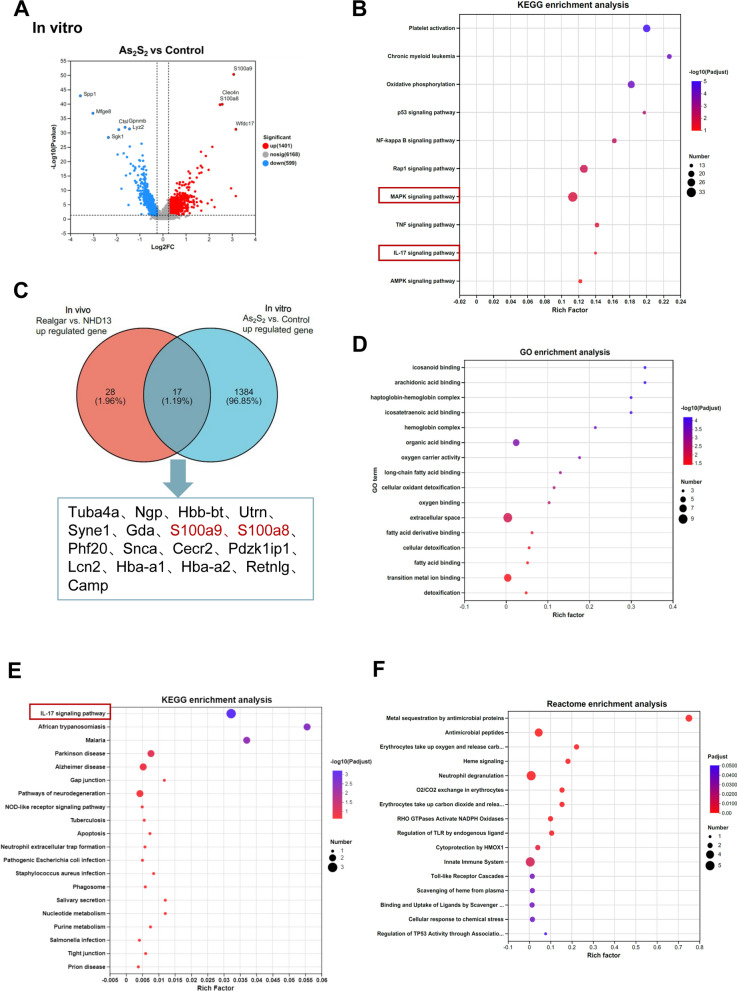
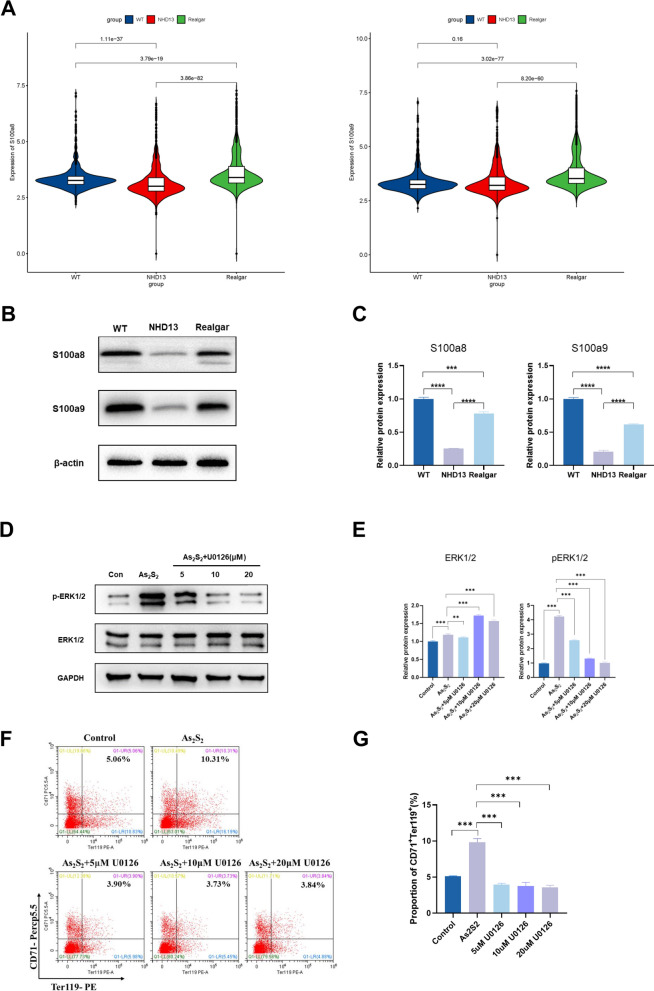
Myelodysplastic syndrome (MDS) is a malignant hematologic disorder with limited curative options, primarily reliant on hematopoietic stem cell transplantation. Anemia, a prevalent symptom of MDS, has few effective treatment strategies. Realgar, though known for its therapeutic effects on MDS, remains poorly understood in terms of its mechanism of action. In this study, both in vivo and in vitro experiments were conducted using Realgar and its primary active component, As2S2, to examine their impact on mouse erythroblasts at the single-cell level. Realgar treatment significantly altered the transcriptional profiles and cellular composition of bone marrow in mice, both in vivo and in vitro. Differentially expressed genes in erythroblasts regulated by Realgar were identified, unveiling potential regulatory functions and signaling pathways, such as heme biosynthesis, hemoglobin production, oxygen binding, IL-17 signaling, and MAPK pathways. These findings suggest that Realgar enhances the differentiation of erythroblasts in mouse bone marrow and improves overall blood cell counts. This work offers preliminary insights into Realgar's mechanisms, expands the understanding of this mineral medicine, and may inform strategies to optimize its therapeutic potential in hematologic diseases.
Keywords: Erythropoiesis; MDS; Myelodysplastic syndrome; Realgar.
© 2025. The Author(s).
Conflict of interest statement
Declarations. Ethics approval and consent to participate: The animal experiments were approved by the Experimental Animal Ethics Committee of the Municipal Hospital of Traditional Chinese Medicine, Shanghai University of Traditional Chinese Medicine. Consent for publication: Not applicable. Competing interests: The authors declare no competing interests.
Figures
Similar articles
-
Realgar induces apoptosis by inhibiting glycolysis via regulating STAT3 in myelodysplastic syndrome.J Ethnopharmacol. 2025 Feb 11;341:119339. doi: 10.1016/j.jep.2025.119339. Epub 2025 Jan 7. J Ethnopharmacol. 2025. PMID: 39788167
-
Effects of arsenic disulfide on apoptosis, histone acetylation, toll like receptor 2 activation, and erythropoiesis in bone marrow mononuclear cells of myelodysplastic syndromes patients in vitro.Leuk Res. 2017 Nov;62:4-11. doi: 10.1016/j.leukres.2017.09.010. Epub 2017 Sep 19. Leuk Res. 2017. PMID: 28963909
-
Physician Education: Myelodysplastic Syndrome.Oncologist. 1996;1(4):284-287. Oncologist. 1996. PMID: 10388004
-
Dyserythropoiesis of myelodysplastic syndromes.Curr Opin Hematol. 2017 May;24(3):191-197. doi: 10.1097/MOH.0000000000000325. Curr Opin Hematol. 2017. PMID: 28072603 Review.
-
Realgar (α-As4S4) Treats Myelodysplastic Syndromes through Reducing DNA Hypermethylation.Chin J Integr Med. 2022 Mar;28(3):281-288. doi: 10.1007/s11655-020-3263-8. Epub 2020 May 16. Chin J Integr Med. 2022. PMID: 32418175 Review.
References
-
- Arber DA, Orazi A, Hasserjian R, et al. The 2016 revision to the World Health Organization classification of myeloid neoplasms and acute leukemia. Blood. 2016;127(20):2391–405. - PubMed
-
- Fenaux P, Haase D, Santini V, et al. Myelodysplastic syndromes: ESMO Clinical Practice Guidelines for diagnosis, treatment and follow-up(dagger). Ann Oncol. 2021;32(2):142–56. - PubMed
-
- Zhu HH, Hu J, Lo-Coco F, et al. The simpler, the better: oral arsenic for acute promyelocytic leukemia. Blood. 2019;134(7):597–605. - PubMed
Grants and funding
- 21Y31920400/Shanghai Science Technology and Innovation Action Plan
- 21Y31920400/Shanghai Science Technology and Innovation Action Plan
- 21Y31920400/Shanghai Science Technology and Innovation Action Plan
- 21Y31920400/Shanghai Science Technology and Innovation Action Plan
- 21Y31920400/Shanghai Science Technology and Innovation Action Plan
- 21Y31920400/Shanghai Science Technology and Innovation Action Plan
- 21Y31920400/Shanghai Science Technology and Innovation Action Plan
- 21Y31920400/Shanghai Science Technology and Innovation Action Plan
- 21Y31920400/Shanghai Science Technology and Innovation Action Plan
- 21Y31920400/Shanghai Science Technology and Innovation Action Plan
- 82474260/National Natural Science Foundation of China
- 82474260/National Natural Science Foundation of China
- 82474260/National Natural Science Foundation of China
- 82474260/National Natural Science Foundation of China
- 82474260/National Natural Science Foundation of China
- 82474260/National Natural Science Foundation of China
- 82474260/National Natural Science Foundation of China
- 82474260/National Natural Science Foundation of China
- 82474260/National Natural Science Foundation of China
- 82474260/National Natural Science Foundation of China
- WL-HBMS-2021009K/Future planning project of Shanghai Municipal Hospital of Traditional Chinese Medicine
- WL-HBMS-2021009K/Future planning project of Shanghai Municipal Hospital of Traditional Chinese Medicine
- WL-HBMS-2021009K/Future planning project of Shanghai Municipal Hospital of Traditional Chinese Medicine
- WL-HBMS-2021009K/Future planning project of Shanghai Municipal Hospital of Traditional Chinese Medicine
- WL-HBMS-2021009K/Future planning project of Shanghai Municipal Hospital of Traditional Chinese Medicine
- WL-HBMS-2021009K/Future planning project of Shanghai Municipal Hospital of Traditional Chinese Medicine
- WL-HBMS-2021009K/Future planning project of Shanghai Municipal Hospital of Traditional Chinese Medicine
- WL-HBMS-2021009K/Future planning project of Shanghai Municipal Hospital of Traditional Chinese Medicine
- WL-HBMS-2021009K/Future planning project of Shanghai Municipal Hospital of Traditional Chinese Medicine
- WL-HBMS-2021009K/Future planning project of Shanghai Municipal Hospital of Traditional Chinese Medicine
- 2022079/The Leading Talent Project of the Oriental Talent Program
- 2022079/The Leading Talent Project of the Oriental Talent Program
- 2022079/The Leading Talent Project of the Oriental Talent Program
- 2022079/The Leading Talent Project of the Oriental Talent Program
- 2022079/The Leading Talent Project of the Oriental Talent Program
- 2022079/The Leading Talent Project of the Oriental Talent Program
- 2022079/The Leading Talent Project of the Oriental Talent Program
- 2022079/The Leading Talent Project of the Oriental Talent Program
- 2022079/The Leading Talent Project of the Oriental Talent Program
- 2022079/The Leading Talent Project of the Oriental Talent Program
LinkOut - more resources
Full Text Sources
Research Materials
Miscellaneous
