. 2025 Apr 8;23(1):173.
doi: 10.1186/s12964-025-02165-4.

The dynamics of chemoattractant receptors redistribution in the electrotaxis of 3T3 fibroblasts

Affiliations

The dynamics of chemoattractant receptors redistribution in the electrotaxis of 3T3 fibroblasts

Jagoda Gorzkowska et al. Cell Commun Signal. .

Abstract

Background: Electrotaxis, the directed cell movement in direct current electric field (dcEF), is crucial for wound healing and development. We recently proposed a biphasic electrotaxis mechanism, where an initial rapid response is driven by ionic mechanisms, while redistribution of membrane components come into play during prolonged exposure to dcEF.

Methods: To verify this hypothesis, we studied the redistribution dynamics of EGFR, PDGFRα/β, and TGFβR1 in dcEF. For this purpose, we utilized cells transfected with plasmids encoding fluorescently tagged receptors, which were exposed to dcEF in a custom-designed electrotactic chamber. Fluorescent images were captured using wide-field or TIRF microscopy, enabling precise quantitative analysis of receptor redistribution. Additionally, the functional significance of these selected receptors in electrotaxis was evaluated by silencing their expression using an siRNA library.

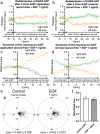
Results: Although EGFR moved immediately to cathode after dcEF application, maximum distribution asymmetry was reached after 30-40 min. This process was more efficient at higher dcEF intensities, specifically, asymmetry was greater at 3 V/cm compared to 1 V/cm, consistent with the biphasic mechanism observed only under the stronger dcEF. Additionally, redistribution was more effective under alkaline conditions and near the cell base, but decreased when glass was coated with poly-L-lysine, indicating electroosmosis as a key factor. Importantly, EGFR redistribution did not correlate with the rapid reaction of 3T3 cells to dcEF reversal, which occurred within 1-2 min, when receptor orientation was not yet reversed. PDGFRα exhibited similar but less marked cathodal redistribution, while PDGFRβ and TGFβR1 did not redistribute. siRNA knockdown experiments confirmed the importance of EGFR and ErbB4 in the electrotaxis. EGFR's role was largely ligand-independent, and it had a significant impact on the response of 3T3 cells to dcEF during the first hour of the experiment, but was not involved in the fastest response, which was Kir-dependent.

Conclusions: Our study suggests that EGFR redistribution may play a role in the early stages and partially contribute to the long-term electrotaxis of 3T3 fibroblasts. However, this mechanism alone does not fully explain rapid responses to dcEF orientation changes indicating a more complex, multimodal mechanism of electrotaxis in these cells.

Keywords: EGFR; Electric field; Electroosmosis; Electrotaxis; Receptor redistribution; dcEF.


Conflict of interest statement

Declarations. Ethics approval and consent to participate: Not applicable. Consent for publication: Not applicable. Competing interests: The authors declare no competing interests.

Figures

Fig. 1
Fig. 1
Schematic representation of cell sectioning for quantitative analysis of fluorescence intensity and cell region area changes. (a) Fluorescence images were automatically segmented, and (b) cells were sectioned into three equal regions along the 0X axis, parallel to the direction of dcEF lines (if present), based on the farthest points to the right and left. Each region comprised one-third of the line segment spanning from the farthest points projected onto the 0X axis. (c) The right and left sides of the cell were selected for further analysis, while the central region was excluded. For fluorescence intensity measurements, cell sectioning was performed at each time step, whereas for area analysis, sectioning was only executed at time t = 0 min (denoting dcEF application or reversal)
Fig. 2
Fig. 2
Visualization of EGFR-GFP redistribution in response to dcEF. 3T3 fibroblasts transfected with a plasmid encoding EGFR-GFP were observed using fluorescence microscopy before and during the application of a dcEF (3 V/cm). The succession of presented images is annotated with arrows. Initially, a 10-minute recording captured cells in isotropic conditions (a) (10 min before EF application (-10 min), at the moment of EF application (0 min)). Subsequently, the dcEF was applied with the cathode placed on the right side for 60 min (b). Following this, the dcEF polarity was reversed by replacing the electrodes and placing the cathode on the left side (c). The line profiles illustrate the relative distribution of fluorescence within the cell, normalized to the brightest pixel along the line. A scale bar of 50 μm is applicable to all images within the figure
Fig. 3
Fig. 3
Quantitative analysis of EGFR-GFP redistribution and dynamics of 3T3 fibroblasts electrotaxis following dcEF application and reversal (a) - redistribution of the fluorescent protein after the application of dcEF (3 V/cm) at the 0-minute time point, with the cathode placed on the right side of the field of view. Fluorescence intensities were measured every 30 s for both the right and left sides of the cell (designated at each time point). The values were subsequently normalized by dividing them with the average fluorescence intensity of the entire cell, and are presented as orange and green lines, respectively. (b) - redistribution of the fluorescent protein following the reversal of the dcEF (3 V/cm) polarity at the 0-minute time point, achieved by replacing the electrodes and transferring the cathode to the left side of the field of view. The graph was constructed as previously (a). The graphs (a, b) represent average values (± SEM) for n = 17 cells from 4 independent experiments; (c) - variations in the areas of the cell regions after the application of a dcEF (3 V/cm) at the 0-minute time point, with the cathode placed on the right side of the field of view. The areas of fluorescent cell regions were measured every 30 s for both the right and left sides of the cell (designated at time point 0 min). These values were subsequently normalized to 1 at the time of sectioning and are presented as orange and green lines, respectively. (d) - variations in cell region areas after reversing the dcEF polarity at the 0-minute time point, achieved by replacing the electrodes and transferring the cathode to the left side of the field of view. The graph was constructed using the same methodology as in (c). The graphs (c, d) represent average values (± SEM) for n = 6 cells from 3 independent experiments. Throughout these experiments, the culture medium pH was maintained consistently at 7
Fig. 4
Fig. 4
Visualization of 3T3 fibroblasts electrotaxis dynamics. Cells expressing GFP were recorded with fluorescence microscopy after the application (a) and reversal (b) of a 3 V/cm dcEF. The green image of the cell at the specified time point was overlayed with the red image of the cell at the reference time point, where the dcEF of 3 V/cm was applied (a) or reversed (b). As a result, green color denotes a region covered, while red color denotes a region released by the cell between the reference time and the specified time. The scale bar is 50 μm. The complete image series recorded at 30-second intervals can be found in Supplementary Movie 2 (Additional file 2)
Fig. 5
Fig. 5
Quantitative analysis of EGFR-GFP redistribution following 1 V/cm dcEF application and reversal (a) - redistribution of the fluorescent protein after the application of 1 V/cm dcEF at the 0-minute time point, with the cathode placed on the right side of the field of view. Fluorescence intensities were measured every 30 s for both the right and left sides of the cell (designated at each time point). The values were subsequently normalized by dividing them with the average fluorescence intensity of the entire cell, and are presented as orange and green lines, respectively. (b) - redistribution of the fluorescent protein following the reversal of the dcEF (1 V/cm) polarity at the 0-minute time point, achieved by replacing the electrodes and transferring the cathode to the left side of the field of view. The graph was constructed as previously (a). The culture medium pH was maintained at 7. The graphs represent average values (± SEM) for n = 16 cells from 3 independent experiments
Fig. 6
Fig. 6
Impact of culture medium pH on EGFR-GFP redistribution (a, b) - redistribution of the fluorescent protein following the application of dcEF (3 V/cm) at the 0-minute time point, with cathode placed on the right side of the field of view. Fluorescence intensities were measured every 30 s for both the right and left sides of the cell (designated at each time point). The values were then normalized by dividing them by the average fluorescence intensity of the entire cell, and are depicted as orange and green lines, respectively. (c, d) - redistribution of the fluorescent protein after reversing the dcEF (3 V/cm) polarity at the 0-minute time point, achieved by replacing the electrodes and transferring the cathode to the left side of the field of view. The graphs were constructed following the same methodology as in (a) and (b). In both sets of experiments, the culture medium pH was adjusted and maintained at either 6 (a, c) or 8 (b, d). The graphs represent average values (± SEM) for n = 20 cells (pH 6) and n = 15 cells (pH 8), each group derived from 3 independent experiments
Fig. 7
Fig. 7
Quantitative analysis of TIRFM observed EGFR-GFP redistribution near the substratum following dcEF application and reversal - the involvement of electroosmosis near the substratum (a, b) - redistribution of the fluorescent protein after the application of dcEF: (a) - glass substratum; (b) - coated with poly-L-lysine (0.1 mg/ml). At the 0-minute time point, the cathode was placed on the right side of the field of view. Fluorescence intensities were measured every 30 s for both the right and left sides of the cell (designated at each time point). The values were subsequently normalized by dividing them by the average fluorescence intensity of the entire cell, and are presented as orange and green lines, respectively. (c, d) - redistribution of the fluorescent protein following the reversal of the dcEF polarity: (c) - glass substratum; (d) - coated with poly-L-lysine (0.1 mg/ml). At the 0-minute time point electrodes were replaced, transferring the cathode to the left side of the field of view. The graphs were constructed as previously (a, b). The graphs show average values (± SEM) for n = 6 cells on glass substratum and n = 6 cells on poly-L-lysine coated surfaces, each group derived from 5 independent experiments
Fig. 8
Fig. 8
Quantitative analysis of PDGF receptors redistribution following 3 V/cm dcEF application and reversal (a, b) – PDGFRα; (c, d)– PDGFRβ; (a, c) - redistribution of the fluorescent proteins after the application of 3 V/cm dcEF at the 0-minute time point, with the cathode placed on the right side of the field of view. Fluorescence intensities were measured every 30 s for both the right and left sides of the cell (designated at each time point). The values were subsequently normalized by dividing them with the average fluorescence intensity of the entire cell, and are presented as orange and green lines, respectively. (b, d) - redistribution of the fluorescent protein following the reversal of the dcEF (3 V/cm) polarity at the 0-minute time point, achieved by replacing the electrodes and transferring the cathode to the left side of the field of view. The graphs were constructed as previously (a, c). The culture medium pH was consistently maintained at 7. The graphs represent average values (± SEM) for n = 10 cells (PDGFRα) and n = 9 cells (PDGFRβ), each group derived from 3 independent experiments
Fig. 9
Fig. 9
Quantitative analysis of TGFβ receptor 1 distribution following 3 V/cm dcEF application and reversal (a) - redistribution of TGFβ R1-GFP after the application of dcEF (3 V/cm) at the 0-minute time point, with the cathode placed on the right side of the field of view. Fluorescence intensities were measured every 30 s for both the right and left sides of the cell (designated at each time point). The values were subsequently normalized by dividing them with the average fluorescence intensity of the entire cell, and are presented as orange and green lines, respectively. (b) - redistribution of the fluorescent protein after the reversal of the dcEF (3 V/cm) polarity at the 0-minute time point, achieved by replacing the electrodes and transferring the cathode to the left side of the field of view. The graph was constructed as previously (a). The graphs (a, b) represent average values (± SEM) for n = 8 cells from 3 independent experiments
Fig. 10
Fig. 10
The effect of silencing specific RTK genes (with targeted siRNA) on the electrotaxis of 3T3 fibroblasts. (a) Circular diagrams showing composite trajectories of individual cell migration under a dcEF of 3 V/cm. The initial point of each trajectory (constructed from the subsequent 48 cell centroid positions, recorded at 5-minute intervals) was set at the beginning of the coordinate system. The cathode of the dcEF is located on the right side of the diagram. The scale is in µm. (b) Circular diagrams, constructed as previously described, showing cells’ electrotaxis 48 h after silencing of specified RTKs with targeted siRNA. (c) directionality of cell migration (presented as mean directional cos γ), calculated as the mean (± SEM) for n = 30 cells per condition. Control cells were treated with non-targeting siRNA. *Statistically significant differences relative to control (p < 0.05)
Fig. 11
Fig. 11
Redistribution of EGFR-GFP and dynamics of 3T3 fibroblasts electrotaxis following dcEF application and reversal in serum-free conditions (a) - redistribution of the fluorescent protein after the application of dcEF (3 V/cm) at the 0-minute time point, with the cathode placed on the right side of the field of view. Fluorescence intensities were measured every 30 s for both the right and left sides of the cell (designated at each time point). The values were subsequently normalized by dividing them with the average fluorescence intensity of the entire cell, and are presented as orange and green lines, respectively. (b) - redistribution of the fluorescent protein following the reversal of the dcEF (3 V/cm) polarity at the 0-minute time point, achieved by replacing the electrodes and transferring the cathode to the left side of the field of view. The graph was constructed as previously (a). The graphs (a, b) represent average values (± SEM) for n = 15 cells from 3 independent experiments; (c) - variations in the areas of the cell regions after the application of a dcEF (3 V/cm) at the 0-minute time point, with the cathode placed on the right side of the field of view. The areas of fluorescent cell regions were measured every 30 s for both the right and left sides of the cell (designated at time point 0 min). These values were subsequently normalized to 1 at the time of sectioning and are presented as orange and green lines, respectively. (d) - variations in cell region areas after reversing the dcEF polarity at the 0-minute time point, achieved by replacing the electrodes and transferring the cathode to the left side of the field of view. The graph was constructed using the same methodology as in (c). The graphs (c, d) represent average values (± SEM) for n = 8 cells from 3 independent experiments. Throughout these experiments, the culture medium pH was maintained consistently at 7
Fig. 12
Fig. 12
The influence of EGF on the redistribution of EGFR-GFP, long term electrotaxis of 3T3 fibroblasts and its dynamics following dcEF application and reversal (a) - redistribution of the EGFR-GFP in the presence of EGF (1 ng/ml) after the application of dcEF (3 V/cm) at the 0-minute time point, with the cathode placed on the right side of the field of view. (b) - redistribution of the EGFR-GFP in the presence of EGF (1 ng/ml) following the reversal of the dcEF (3 V/cm) polarity at the 0-minute time point. The graphs (a, b) were constructed as previously (Fig. 11), and represent average values (± SEM) for n = 15 cells from 3 independent experiments; (c) - variations in the areas of the cell regions after the application of a dcEF (3 V/cm) at the 0-minute time point, with the cathode placed on the right side of the field of view. (d) - variations in cell region areas after reversing the dcEF polarity at the 0-minute time point, achieved by replacing the. The graphs (c, d) were constructed using the same methodology as in Fig. 11, and represent average values (± SEM) for n = 6 cells from 3 independent experiments. Throughout these experiments, the culture medium pH was maintained consistently at 7. (e) - Circular diagrams showing composite trajectories of individual cell migration under a dcEF of 3 V/cm in serum-free conditions, or additionally treated with EGF (1 ng/ml). The initial point of each trajectory (constructed from the subsequent 36 cell centroid positions, recorded at 5-minute intervals) was set at the beginning of the coordinate system. The cathode of the dcEF is located on the right side of both diagrams. The scale is in µm. (f) - directionality of cell migration (presented as mean directional cos γ), calculated as the mean (± SEM) for n = 50 cells per condition
Fig. 13
Fig. 13
The effect of silencing specific RTK genes (with targeted siRNA) on the dynamics of electrotaxis of 3T3 fibroblasts. Directionality of cell migration (presented as mean directional cos γ), calculated as the mean (± SEM) for n = 30 cells per condition, split to (a) the initial (1st hour) and (b) remaining (2nd to 4th hour) stage of the experiment. Control cells were treated with non-targeting siRNA. *Statistically significant differences relative to control (p < 0.05)
Fig. 14
Fig. 14
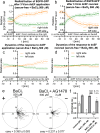
The influence of BaCl2 on the redistribution of EGFR-GFP, long term electrotaxis of 3T3 fibroblasts and its dynamics following dcEF application and reversal (a) - redistribution of the EGFR-GFP in the presence of BaCl2 (500 µM) after the application of dcEF (3 V/cm) at the 0-minute time point, with the cathode placed on the right side of the field of view. (b) - redistribution of the EGFR-GFP in the presence of BaCl2 (500 µM) following the reversal of the dcEF (3 V/cm) polarity at the 0-minute time point. The graphs (a, b) were constructed as previously (Fig. 11), and represent average values (± SEM) for n = 15 cells from 3 independent experiments; (c) - variations in the areas of the cell regions after the application of a dcEF (3 V/cm) at the 0-minute time point, with the cathode placed on the right side of the field of view. (d) - variations in cell region areas after reversing the dcEF polarity at the 0-minute time point. The graphs (c, d) were constructed using the same methodology as in Fig. 11, and represent average values (± SEM) for n = 6 cells from 3 independent experiments. Throughout these experiments, the culture medium pH was maintained consistently at 7. (e) - Circular diagrams showing composite trajectories of individual cell migration under a dcEF of 3 V/cm in serum-free conditions in the presence of BaCl2 (500 µM), or additionally treated with EGF inhibitor– AG1478 (3 µM). The initial point of each trajectory (constructed from the subsequent 36 cell centroid positions, recorded at 5-minute intervals) was set at the beginning of the coordinate system. The cathode of the dcEF is located on the right side of both diagrams. The scale is in µm. (f) - directionality of cell migration (presented as mean directional cos γ), split to the initial (1st hour) and remaining (2nd to 3rd hour) stage of the experiment, calculated as the mean (± SEM) for n = 50 cells per condition. Serum-free control data originated from Fig. 12.*Statistically significant differences relative to control (p < 0.05)

Similar articles

References

    1. Martin-Granados C, McCaig CD. Harnessing the electric spark of life to cure skin wounds. Adv Wound Care (New Rochelle). 2013;3:127–38. 10.1089/wound.2013.0451. - PMC - PubMed
    1. McCaig CD, Song B, Rajnicek AM. Electrical dimensions in cell science. J Cell Sci. 2009;122:4267–76. 10.1242/jcs.023564. - PubMed
    1. Campetelli A, Bonazzi D, Minc N. Electrochemical regulation of cell Polarity and the cytoskeleton. Cytoskeleton. 2012;69:601–12. 10.1002/cm.21047. - PubMed
    1. Messerli MA, Graham DM. Extracellular electrical fields direct wound healing and regeneration. Biol Bull. 2011;221:79–92. 10.1086/BBLv221n1p79. - PubMed
    1. Nuccitelli R. A role for endogenous electric fields in wound healing. Curr Top Dev Biol. 2003;58:1–26. 10.1016/s0070-2153(03)58001-2. - PubMed

MeSH terms

Substances

LinkOut - more resources