. 2025 Jun;12(21):e2415948.
doi: 10.1002/advs.202415948. Epub 2025 Apr 8.

Mechanisms of Baicalin Alleviates Intestinal Inflammation: Role of M1 Macrophage Polarization and Lactobacillus amylovorus

Affiliations

Mechanisms of Baicalin Alleviates Intestinal Inflammation: Role of M1 Macrophage Polarization and Lactobacillus amylovorus

Shunfen Zhang et al. Adv Sci (Weinh). 2025 Jun.

Abstract

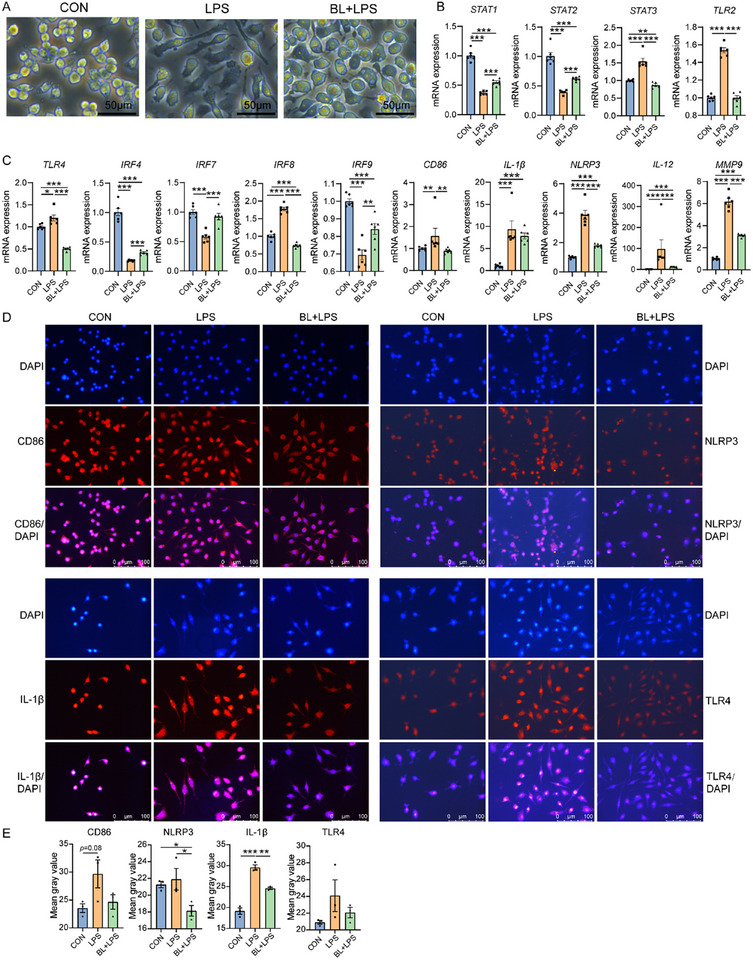
Baicalin has been widely used for its anti-inflammatory pharmacological properties, yet its effects on bacterial intestinal inflammation and the mechanisms remain unclear. This study revealed that baicalin alleviates bacterial intestinal inflammation through regulating macrophage polarization and increasing Lactobacillus amylovorus abundance in colon. Specifically, transcriptomic analysis showed that baicalin restored Escherichia coli-induced genes expression changes including T helper cell 17 differentiation-related genes, macrophage polarization related genes, and TLR/IRF/STAT signaling pathway. Subsequent microbial and non-targeted metabolomic analysis revealed that these changes may be related to the enhancement of Lactobacillus amylovorus and the upregulation of its metabolites including chrysin, lactic acid, and indoles. Furthermore, whole-genome sequencing of Lactobacillus amylovorus provided insights into its functional potential and metabolic annotations. Lactobacillus amylovorus supplementation alleviates Escherichia coli-induced intestinal inflammation in mice and similarly inhibited M1 macrophage polarization through TLR4/IRF/STAT pathway. Additionally, baicalin, Lactobacillus amylovorus, or chrysin alone could regulate macrophage polarization, highlighting their independent anti-inflammatory potential. Notably, this study revealed that baicalin alleviates intestinal inflammation through TLR4/IRF/STAT pathway and increasing Lactobacillus amylovorus abundance and the synthesis of chrysin. These findings provide new insights into the therapeutic potential of baicalin and Lactobacillus amylovorus in preventing and treating intestinal inflammation, offering key targets for future interventions.

Keywords: E. coli; Lactobacillus amylovorus; TLR4; baicalin; intestinal inflammation; macrophages polarization.


Conflict of interest statement

The authors declare no conflict of interest.

Figures

Figure 1
Figure 1
Baicalin alleviates E. coli‐induced colon damage and inflammation. A) Colonic length (n = 8). B) Hematoxylin and eosin (H&E) sections of colon. Scale bar: 500 µm. C) Representative AB‐PAS staining of colon tissue sections. Scale bar: 500 µm. D) Colonic goblet cell count (n = 8). E) mRNA expression of IL‐1β, TNF‐α, IFN‐γ, IL‐10 (n = 6). F) Western blotting analyses of the expression of NLRP3, IL‐1β, occludin, and ACTB in the colon, and the ratio of cleaved to full‐length forms for these proteins was calculated (n = 4). ACTB was used as a loading control. Data are presented as mean ± SEM and statistical analysis was performed using one‐way ANOVA followed by the LSD test. * means p  <  0.05, ** means p <  0.01.
Figure 2
Figure 2
Baicalin regulates E. coli‐induced colon gene expression (n = 5). A) Scatter plot of expression difference (Fold change >1.8, p < 0.05). Each dot represents a gene, where red dots highlight significantly upregulated genes, blue dots indicate significantly downregulated genes, and gray dots represent genes with no significant differential expression. B) Clustering heat map, trend analysis and enriched GO terms for all differential genes in E. coli versus CON and BL + E. coli versus E. coli group. C) KEGG enrichment analysis of differential genes in E. coli versus CON; D) and BL + E. coli versus E. coli group. E) Fold change heatmap of key genes in Th17 cell differentiation pathways. F) Glycine‐threonine metabolism diagram. G) Western blotting was conducted to measure the expression of CD163, STAT2, TLR4, FOXP3, RORγt, IL‐17F, and ACTB in the colon, H) and the ratio of cleaved to full‐length forms for these proteins was calculated (n = 4). ACTB was used as a loading control. I) mRNA expression of TLR4, TLR9, CD25, FOXP3, RORγt, IL‐17F, and IL‐17A (n = 6). Data are presented as mean ± SEM and statistical analysis was performed using one‐way ANOVA followed by the LSD test. * means p < 0.05, ** means p < 0.01.
Figure 3
Figure 3
Baicalin inhibits LPS‐induced M1 macrophage polarization in vitro. A) Macrophages in CON, LPS, and BL + LPS group. B) mRNA expression of STAT1, STAT2, STAT3, and TLR2 in CON, LPS, and BL + LPS group (n = 4). C) mRNA expression of TLR4, IRF4, IRF7, IRF8, IRF9, CD86, IL‐1β, NLRP3, IL‐12, and MMP9 in CON, LPS, and BL + LPS group (n = 4). D) Immunofluorescence analyses of CD86, IL‐1β, NLRP3, and TLR4 protein expression in RAW264.7 cells. Nuclei are counterstained with DAPI (blue). (E) Mean gray value of CD86, IL‐1β, NLRP3, and TLR4 in immunofluorescence analyses (n = 3).
Figure 4
Figure 4
Baicalin regulates the colonic microbial composition (n = 8). A) PCoA analysis of microbiota in colon based on Weighted Unifrac distance metrics. B) Alpha‐diversity (Sobs and Shannon index) of microbiota. * means p < 0.05. C) Relative abundance of top 30 microbiota at genus level, D) and species level. E) Analysis of different microbiota among groups at genus level, F) and species level. The top 10 differential bacteria in abundance were shown. Intergroup differences were assessed using the Wilcoxon rank–sum test. * means p < 0.05, ** means p < 0.01.
Figure 5
Figure 5
Lactobacillus amylovorus SKLAN202301ZF alleviates intestinal morphological damage and inflammation. A) The morphology of Lactobacillus amylovorus SKLAN202301ZF after malachite green staining under an oil immersion microscope. B) Circular genomic map of Lactobacillus amylovorus SKLAN202301ZF. The outermost circle of the circular diagram represents the genome size. The second and third circles represent the CDS on the positive and negative strands, with different colors indicating the COG functional categories of the CDS. The fourth circle represents rRNA and tRNA. The fifth circle shows the GC content, with the red sections pointing outward indicating regions with a higher GC content than the average GC content of the whole genome, and the blue sections pointing inward indicating regions with a lower GC content than the average GC content. The innermost circle represents the GC‐skew value, calculated as (G‐C)/(G+C). C) KEGG pathway annotation classification statistics of Lactobacillus amylovorus SKLAN202301ZF. D) Spatial location of Lactobacillus amylovorus SKLAN202301ZF in the piglet colon was examined using fluorescent in situ hybridization (FISH). Bacteria are shown in red, and DNA in blue. Scale bars = 200 µm. E) Body weight (n = 12). F) Body weight gain (n = 12). G) Colon length (n = 12). H) Colonic morphology. I) Staining profiles by H&E of colon (scale bars: 500 µm). J) Colonic crypt depth (n = 12). K) Colonic inflammation score (n = 12). L) Colonic epithelial damage score (n = 12). M) Spatial location of Lactobacillus amylovorus SKLAN202301ZF in the piglet colon was examined using fluorescent in situ hybridization (FISH). Bacteria are shown in red, and DNA in blue. Scale bars = 200 µm.
Figure 6
Figure 6
Lactobacillus amylovorus SKLAN202301ZF regulates macrophage polarization and T cell differentiation. A) mRNA expression of STAT1, STAT2, STAT3, TLR2, TLR3, TLR4, IRF7, and IRF8 (n = 12). B) mRNA expression of IRF9, PIAS1, PIAS3, CD226, Unc93b1, RORγt, CD86, and CD163 (n = 12). C) mRNA expression of NLRP3, IL‐1β, IL‐17A, IL‐17F, IL‐18, CCL17, MMP9 (n = 12). D) Western blotting was conducted to measure the expression of CTLA4, IRF4, IRF7, TLR9, FOXP3, RORγt, IL‐1β, NLRP3, and ACTB in the colon, E) and the ratio of cleaved to full‐length forms for these proteins was calculated (n = 4). ACTB was used as a loading control.
Figure 7
Figure 7
Lactobacillus amylovorus SKLAN202301ZF and chrysin regulates macrophage polarization in vitro (n = 3). A) Cellular morphology of RAW264.7 cells in each group. B) Immunofluorescence analyses and mean gray value of CD86, C) CD163, D) IL‐1β, and E) TLR4 protein expression in Raw264.7 cells. Nuclei are counterstained with DAPI (blue).
Figure 8
Figure 8
Baicalin regulates colonic metabolism disrupted by E. coli infection (n = 6). A) Volcano of differential metabolites in BL + E. coli versus E. coli of the piglets. Each dot corresponds to a single metabolite. Red dots indicate metabolites that are significantly upregulated, blue dots represent those that are significantly downregulated, and gray dots denote metabolites with no significant differential expression. B) Expression profile and VIP analysis of metabolites for BL + E. coli and E. coli group of the piglets. C) LC‐MS analysis of chrysin in piglets. D) Chrysin content in Lactobacillus amylovorus SKLAN202301ZF and its culture. E) Volcano of differential metabolites in L. am + E. coli versus E. coli of the mice. F) Expression profile and VIP analysis of metabolites for L. am + E. coli and E. coli group of the mice. G) Top 50 metabolites in Lactobacillus amylovorus SKLAN202301ZF culture. H) Expression profile and VIP analysis of metabolites for Lactobacillus amylovorus SKLAN202301ZF culture and MRS broth medium.

References

    1. W. H. Organization , Diarrhoeal disease, https://www.who.int/news‐room/fact‐sheets/detail/diarrhoeal‐disease (accessed: March 2024).
    1. Liu L., Oza S., Hogan D., Perin J., Rudan I., Lawn J. E., Cousens S., Mathers C., Black R. E., Lancet 2015, 385, 430. - PubMed
    1. Zhu X., Cui J., Yi L., Qin J., Tulake W., Teng F., Tang W., Wei Y., Dong J., Mediators Inflamm. 2020, 2020, 7835284. - PMC - PubMed
    1. Gan Z., Zhao M., Xia Y., Yan Y., Ren W., Trends Endocrinol. Metab. 2024, 35, 62. - PubMed
    1. Siebeler R., de Winther M. P. J., Hoeksema M. A., J. Allergy Clin. Immunol. 2023, 152, 326. - PubMed

LinkOut - more resources