. 2025 Mar 7;28(4):112166.
doi: 10.1016/j.isci.2025.112166. eCollection 2025 Apr 18.

Spatial transcriptomics delineates potential differences in intestinal phenotypes of cardiac and classical necrotizing enterocolitis

Affiliations

Spatial transcriptomics delineates potential differences in intestinal phenotypes of cardiac and classical necrotizing enterocolitis

Kathryn Y Burge et al. iScience. .

Abstract

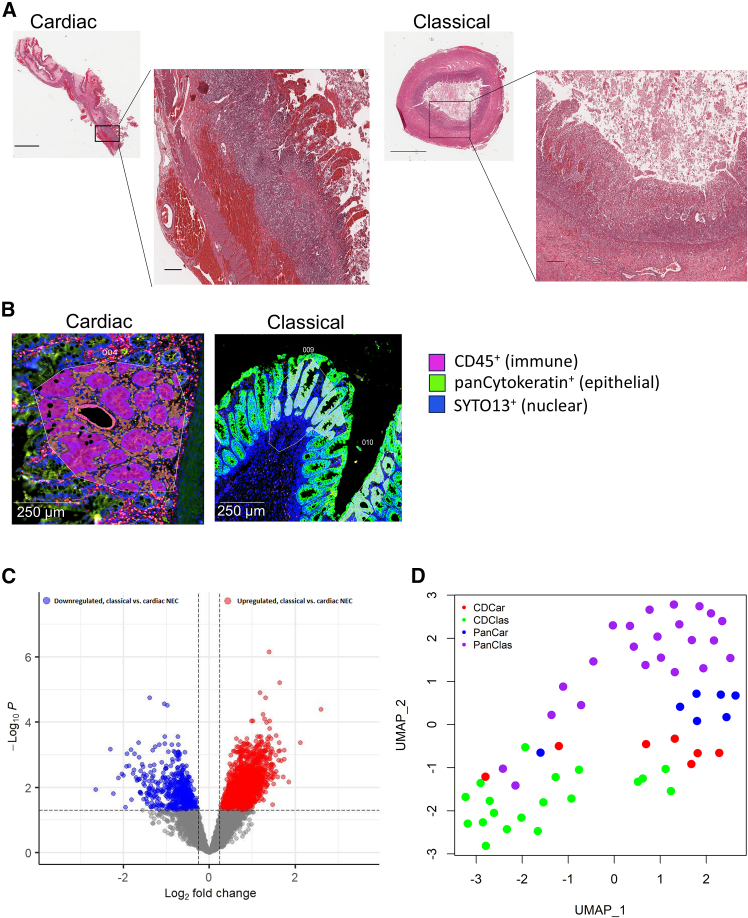
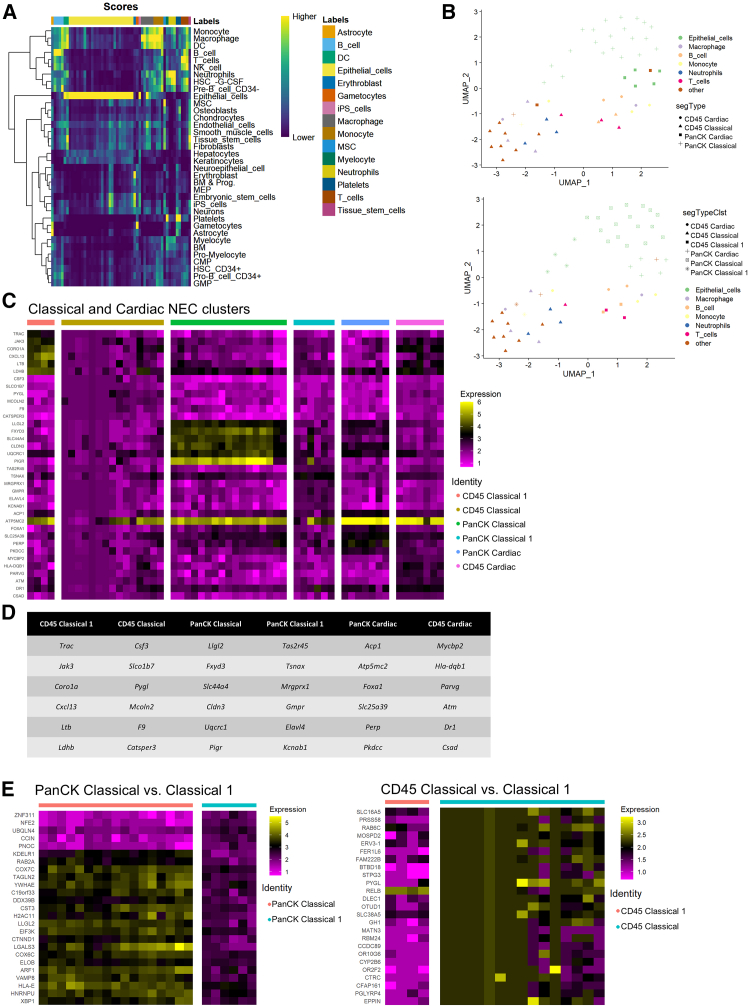
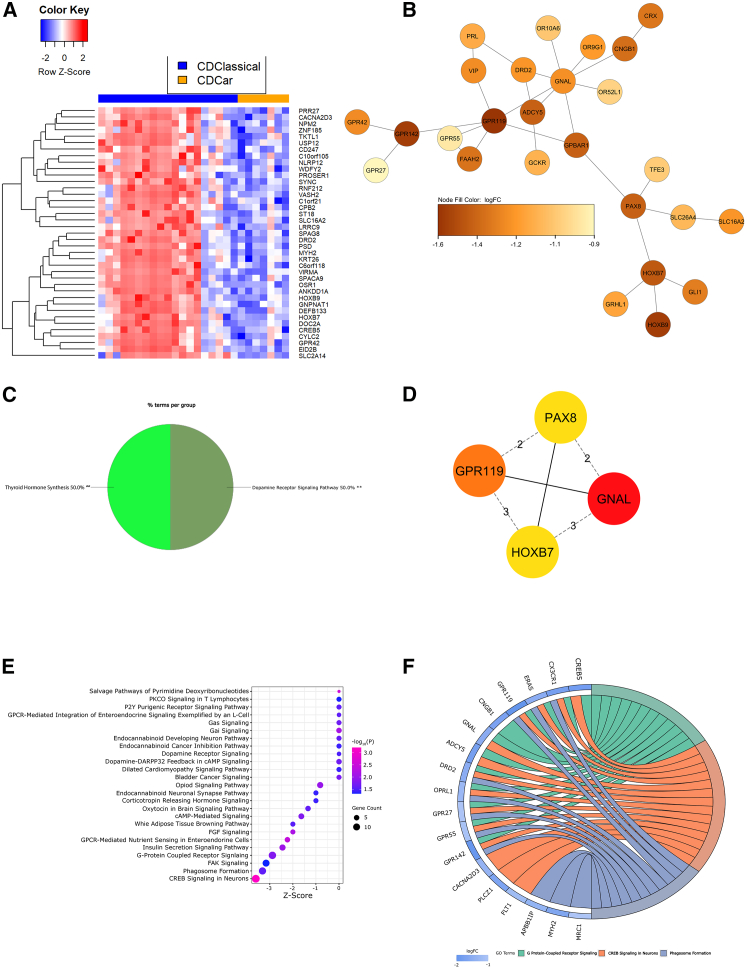
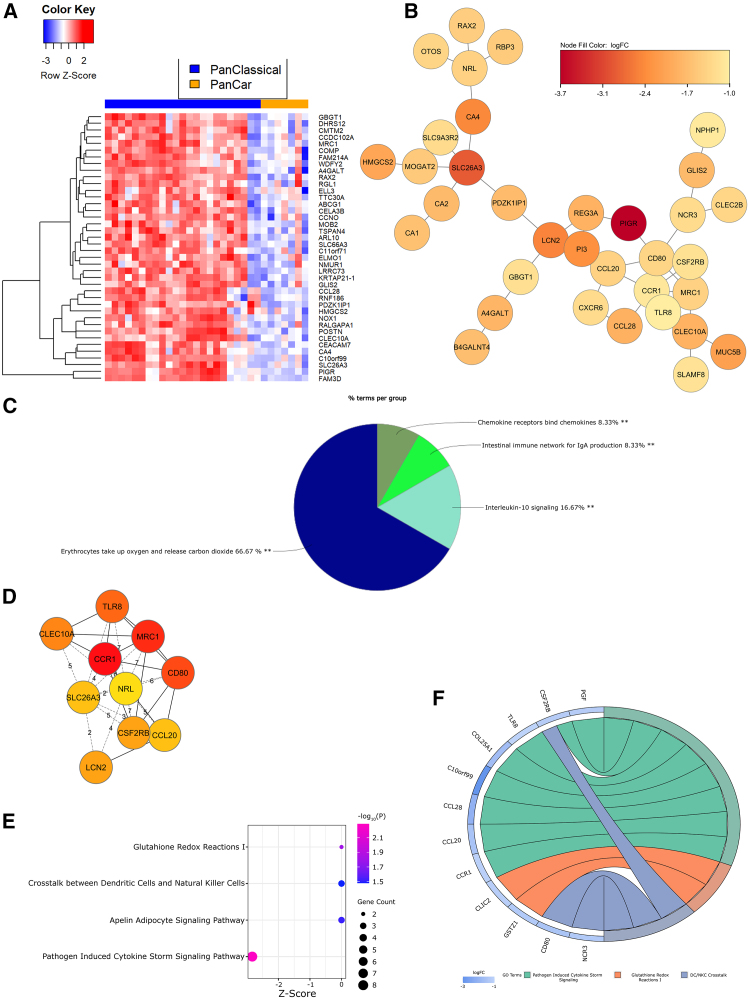
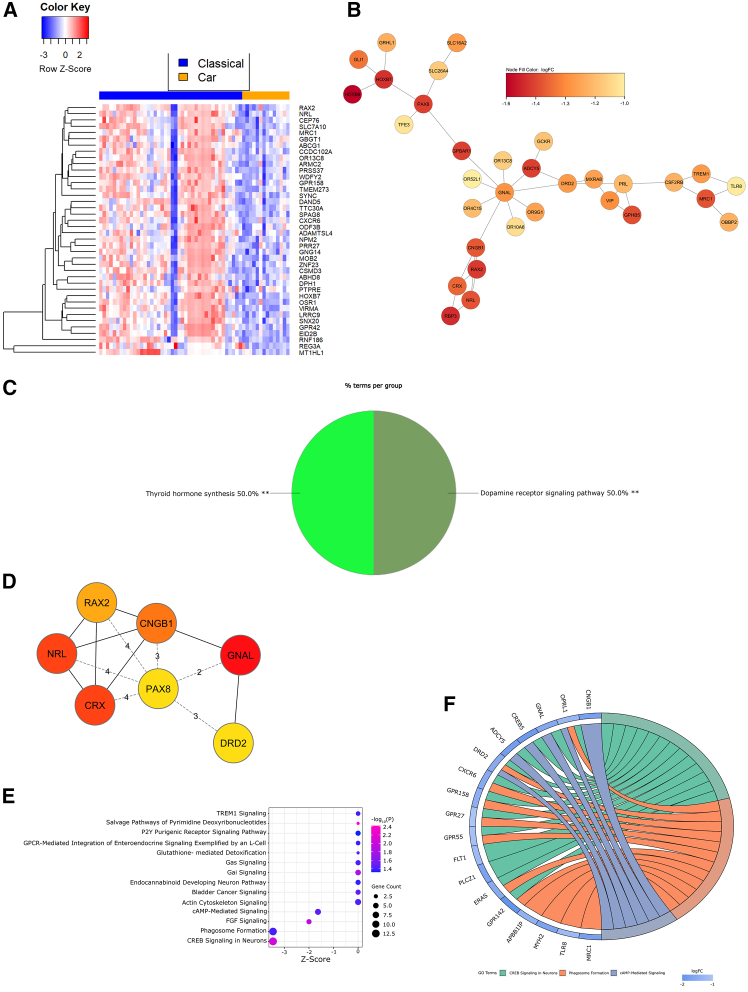
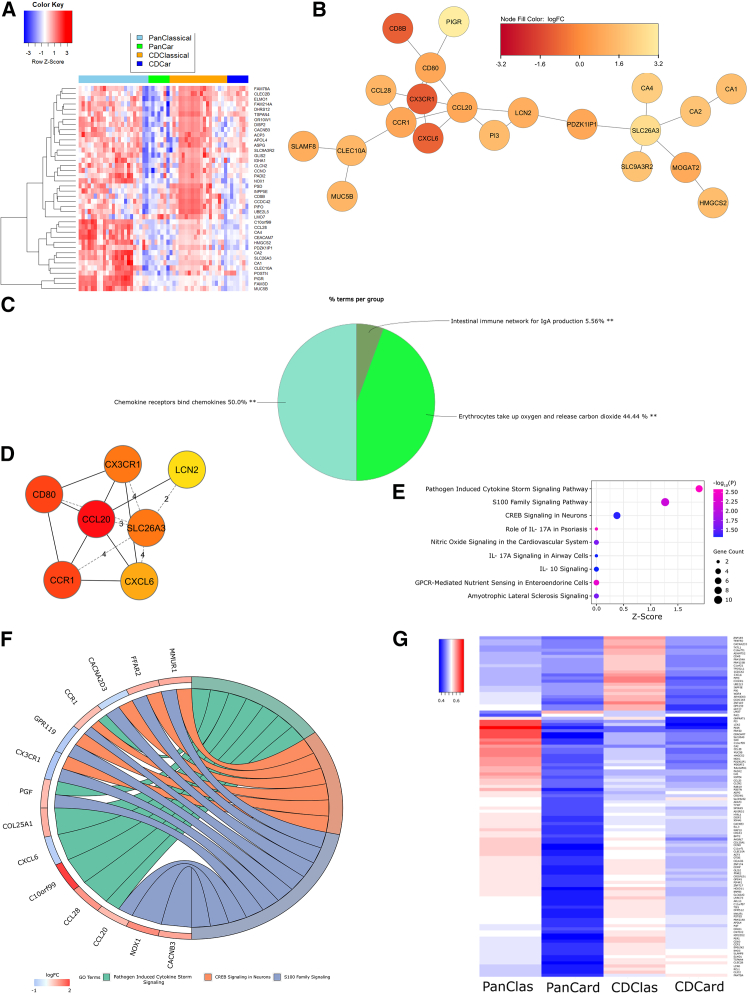
Necrotizing enterocolitis (NEC) is a devastating neonatal gastrointestinal disease, often resulting in multi-organ failure and death. While classical NEC is strictly associated with prematurity, cardiac NEC is a subset of the disease occurring in infants with comorbid congenital heart disease. Despite similar symptomatology, the NEC subtypes vary slightly in presentation and may represent etiologically distinct diseases. We compared ileal spatial transcriptomes of patients with cardiac and classical NEC. Epithelial and immune cells cluster well by cell-type segment and NEC subtype. Differences in metabolism and immune cell activation functionally differentiate the cell-type makeup of the NEC subtypes. The classical NEC phenotype is defined by dysbiosis-induced inflammatory signaling and metabolic acidosis, while that of cardiac NEC involves reduced angiogenesis and endoplasmic reticulum stress-induced apoptosis. Despite subtype-associated clinical and demographic variability, spatial transcriptomics has substantiated pathway and network differences within immune and epithelial segments between cardiac and classical NEC.

Keywords: Components of the immune system; Disease; Gastroenterology; Pediatrics; Proteomics; Transcriptomics.


Conflict of interest statement

H.C. is a scientific advisory board member for the NEC Society (501c-3).

Figures

Figure 1
Figure 1
Cardiac and classical NEC appear transcriptionally distinct (A) Representative H&E histology of cardiac (left; diffuse ischemic changes and areas of hemorrhagic necrosis) and classical (right; transmural necrosis and marked inflammatory infiltrates) NEC samples. Magnification: 4× (left), 20× (right); Scale bar: 2 mm (left), 200 μm (right). (B) Representative immunofluorescent staining (scale bars: 250 μm) and ROI masking of CD45 (magenta), panCK (green), and nuclei (blue) in representative cardiac CD45+ ROI (left) and classical PanCK+ ROI (right) NEC sections. (C) Volcano plot demonstrating upregulated (red) or downregulated (blue) DEGs in classical (n = 5) compared to cardiac (n = 2) NEC (FDR-adjusted p < 0.05 and log2 fold change ≥0.25). (D) UMAP 2D visualization of ROI transcriptional signatures differentiated by NEC subtype and cell-type segment. Red: cardiac NEC immune; green: classical NEC immune; blue: cardiac NEC epithelial; purple: classical NEC epithelial. NEC, necrotizing enterocolitis; H&E, hematoxylin and eosin; ROI, region of interest; panCK, pancytokeratin; FDR, false discovery rate; DEGs, differentially expressed genes; UMAP, uniform manifold approximation and projection. Also see Table S1 and Figures S1–S6.
Figure 2
Figure 2
Cell deconvolution and ROI clustering based on cell-type abundances (A) Estimated cell-type composition per ROI (HPCA reference; see STAR Methods). Each column shows one ROI estimated cell-type distribution. The cell type corresponding with the highest expression intensity was designated the ROI cell-type identity and denoted by column label at top of heatmap. (B) UMAP representation of Seurat guided clustering with initial 4 NEC subtype and cell-type segments (top) and eventual 6 suggested clusters (bottom). (C) Heatmap showing expression profile variation across all ROIs for top 6 marker genes characterizing each of the six NEC subtype and cell-type clusters. Cluster identities are specified by column blocks and top heatmap labels. (D) Table of marker genes for 6 clusters illustrated in heatmap (C). (E) Expression profile of marker genes differentiating PanCK+ (left) and CD45+ (right) clusters within classical NEC. ROI, region of interest; HPCA, Human Primary Cell Atlas; DC, dendritic cells; iPS, inducible pluripotent stem cells; MSC, mesenchymal stem cells; UMAP, uniform manifold approximation and projection; PanCK, pancytokeratin; NEC, necrotizing enterocolitis. Also see Figures S7–S8.
Figure 3
Figure 3
Dopaminergic and VEGF signaling characterize CD45+ transcriptional differences in cardiac and classical NEC (A) Heatmap of Z-scored normalized expression of the top 40 DEGs (FDR-adjusted p < 0.15). (B) Largest PPI subnetwork determined by STRING analysis in CytoScape. (C) ClueGO pie chart of GO term functional enrichment (% terms/group); ∗∗adjusted p < 0.01. (D) Top 4 hub genes identified through CytoHubba (red = strongest associations). (E) Bubble plot of IPA-defined differentially enriched pathways. Bubble size correlates with gene overlap (≥2), color indicates significance (-log10(P)) of pathway enrichment, and x axis represents Z score. (F) Chord diagram illustrating composition of 3 differentially regulated pathways (by Z score and gene count) annotated in (E). Pathways are shown on the right and gene fold change is indicated on the left. Chords connecting genes to pathways indicate gene inclusion within the pathway. VEGF, vascular endothelial growth factor; NEC, necrotizing enterocolitis; DEGs, differentially expressed genes; FDR, false discovery rate; PPI, protein-protein interaction; STRING, search tool for the retrieval of interacting genes/proteins; GO, gene ontology; IPA, ingenuity pathway analysis. Also see Figures S11A, S13, S19A, S20A–S20C, Table S4, Figures S23 and S24.
Figure 4
Figure 4
Classical NEC PanCK+ ROIs are defined by pathogen-induced cytokine storm signaling (A) Heatmap of Z scored normalized expression of the top 40 DEGs (FDR-adjusted p < 0.01) (B) Largest PPI subnetwork determined by STRING analysis in CytoScape. (C) ClueGO pie chart of GO term functional enrichment (% terms/group); ∗∗adjusted p < 0.01. (D) Top 10 hub genes identified through CytoHubba (red = most connections). (E) Bubble plot of IPA-defined differentially enriched pathways. Bubble size correlates with gene overlap (≥2), color indicates significance (-log10(P)) of pathway enrichment, and x axis represents Z score. (F) Chord diagram illustrating composition of 3 differentially regulated pathways (by Z score and gene count) annotated in (E). Pathways are shown on the right and gene fold change is indicated on the left. Chords connecting genes to pathways indicate gene inclusion within the pathway. NEC, necrotizing enterocolitis; PanCK, pancytokeratin; ROIs, regions of interest; DEGs, differentially expressed genes; FDR, false discovery rate; PPI, protein-protein interaction; STRING, search tool for the retrieval of interacting genes/proteins; GO, gene ontology; IPA, ingenuity pathway analysis. Also see Figures S11B, S14, S19B, S20D, Table S4, and Figures S5–S26.
Figure 5
Figure 5
The cardiac NEC transcriptome reflects ER stress while a classical NEC phenotype of inflammatory mucosal acidosis is prominent in directionally concordant DEGs (A) Heatmap of Z scored normalized expression of the top 40 DEGs (FDR-adjusted p < 0.15). (B) Largest PPI subnetwork determined by STRING analysis in CytoScape. (C) ClueGO pie chart of GO term functional enrichment (% terms/group); ∗∗adjusted p < 0.01. (D) Top 7 hub genes identified through CytoHubba (red = most connections). (E) Bubble plot of IPA-defined differentially enriched pathways. Bubble size correlates with gene overlap (≥2), color indicates significance (-log10(P)) of pathway enrichment, and x axis represents Z score. (F) Chord diagram illustrating composition of 3 differentially regulated pathways (by Z score and gene count) annotated in (E). Pathways are shown on the right and gene fold change is indicated on the left. Chords connecting genes to pathways indicate gene inclusion within the pathway. NEC, necrotizing enterocolitis; DEG, differentially expressed gene; PanCK, pancytokeratin; ROIs, regions of interest; FDR, false discovery rate; PPI, protein-protein interaction; STRING, search tool for the retrieval of interacting genes/proteins; GO, gene ontology; IPA, ingenuity pathway analysis. Also see Figures S11C, S15, S19C, S21A, S21B, Table S4, Figures S27 and S28.
Figure 6
Figure 6
Gene interactions differentiate NEC subtypes via pathogen-induced cytokine storm signaling (A) Heatmap of Z scored normalized expression of the top 40 DEGs (FDR-adjusted p < 0.05). (B) Largest PPI subnetwork determined by STRING analysis in CytoScape. (C) ClueGO pie chart of GO term functional enrichment (% terms/group); ∗∗adjusted p < 0.01. (D) Top 7 hub genes identified through CytoHubba (red = most connections). (E) Bubble plot of IPA-defined differentially enriched pathways. Bubble size correlates with gene overlap (≥2), color indicates significance (-log10(P)) of pathway enrichment, and x axis represents Z score. (F) Chord diagram illustrating composition of 3 differentially regulated pathways (by Z score and gene count) annotated in (E). Pathways are shown on the right and gene fold change is indicated on the left. Chords connecting genes to pathways indicate gene inclusion within the pathway. (G) Heatmap of Z scored normalized expression of interacting DEGs (FDR-adjusted p < 0.05), averaged across cell-type segment and NEC subtype. NEC, necrotizing enterocolitis; DEGs, differentially expressed genes; FDR, false discovery rate; PPI, protein-protein interaction; STRING, search tool for the retrieval of interacting genes/proteins; GO, gene ontology; IPA, ingenuity pathway analysis. Also see Figures S11D, S16, S19D, S21D, S22, Table S4, Figures S29 and S30.

Similar articles

References

    1. Cotten C.M. Modifiable Risk Factors in Necrotizing Enterocolitis. Clin. Perinatol. 2019;46:129–143. doi: 10.1016/j.clp.2018.10.007. - DOI - PubMed
    1. Neu J., Walker W.A. Necrotizing enterocolitis. N. Engl. J. Med. 2011;364:255–264. doi: 10.1056/NEJMra1005408. - DOI - PMC - PubMed
    1. Jones I.H., Hall N.J. Contemporary Outcomes for Infants with Necrotizing Enterocolitis-A Systematic Review. J. Pediatr. 2020;220:86–92.e3. doi: 10.1016/j.jpeds.2019.11.011. - DOI - PubMed
    1. Neu J. Necrotizing Enterocolitis: The Future. Neonatology. 2020;117:240–244. doi: 10.1159/000506866. - DOI - PubMed
    1. Neu J., Modi N., Caplan M. Necrotizing enterocolitis comes in different forms: Historical perspectives and defining the disease. Semin. Fetal Neonatal Med. 2018;23:370–373. doi: 10.1016/j.siny.2018.07.004. - DOI - PubMed

LinkOut - more resources