. 2025 Mar 6;28(4):112170.
doi: 10.1016/j.isci.2025.112170. eCollection 2025 Apr 18.

A competition network connects Rab5 and Rab11 GTPases at the surface of endocytic structures

Affiliations

A competition network connects Rab5 and Rab11 GTPases at the surface of endocytic structures

Elsi Ferro et al. iScience. .

Abstract

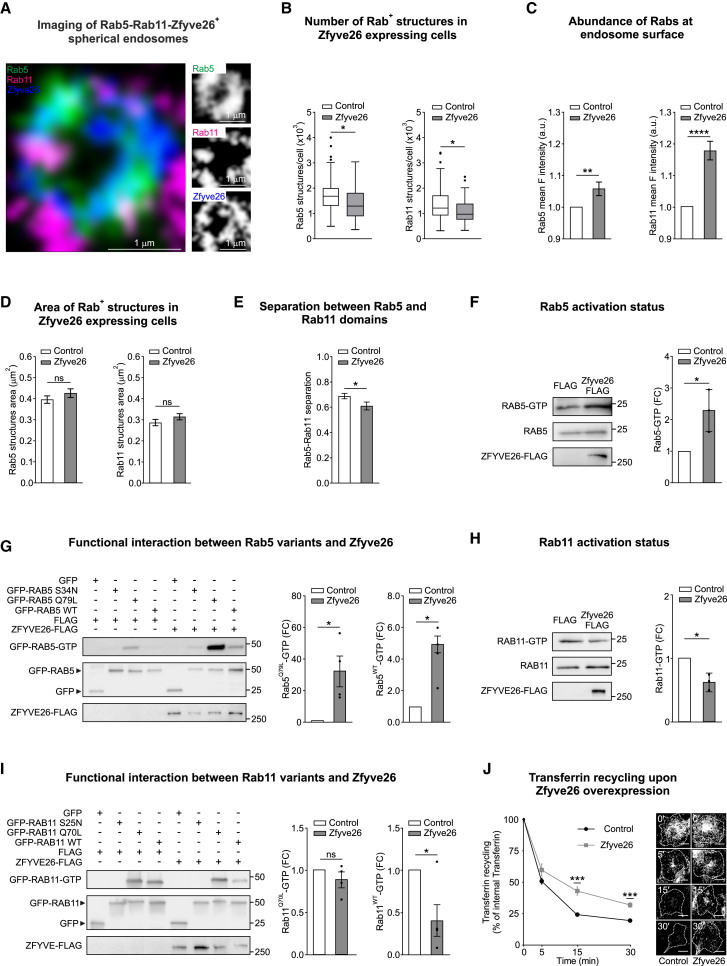
Specificity in membrane trafficking relies on the interaction between Rab small GTPase proteins and their molecular effectors. However, the evidence that different Rab proteins can bind to common effectors challenges this view. Here, we show that molecular competition between distinct Rab GTPases for a shared protein can link diverse membrane trafficking pathways. Theoretical analysis and experimental data support a role for Zfyve26 as a part of a competitive network that modulates changes in Rab5-Rab11 abundance, activation status, and correlation at the surface of single endocytic structures. By leveraging on the Loop index, a novel metric that couples the GTP-bound fraction and the total amount of Rab GTPase, we infer the saturation of Zfyve26 molecules at the endocytic surface from time-lapse imaging data. Our findings establish that transduction in the endocytic system is governed by stoichiometric constraints determining the trade-off between different trafficking pathways at the surface of a membrane-bound organelle.

Keywords: Cell biology; Functional aspects of cell biology; Molecular interaction; Organizational aspects of cell biology.


Conflict of interest statement

EH is a founder of Kither Biotech, a company involved in the development of PI3K inhibitors. E.H. and C.C.C. own patents related to quantification of Rab11 activity.

Figures

None
Graphical abstract
Figure 1
Figure 1
Design and analysis of artificial Rab interaction network by using a shared effector (A) Schematic representation of competitive (left panel) and cascade (right panel) artificial functional interactions between distinct Rab activation modules (colored circles) characterized by a shared effector (gray square). (B) Schematic representation of Rab shuttling from cytosol to endosomal membrane in the artificial Rab network (top panel). Schematic representation of self-regulatory loops used in this study (bottom panel). Gray and white circles represent either GDP or GTP-loaded Rabs, respectively. pFBL: positive feedback loop; nFBL: negative feedback loop; cFFL: coherent feedforward loop; iFFL: incoherent feedforward loop. (C) Schematic representation of Pearson correlation analysis used for the characterization of artificial Rab network. (D) Scoring of artificial Rab network based on correlation analysis as a function of Rab stoichiometry (Rabs ratio) and effector abundance (E = 50 and E = 400).
Figure 2
Figure 2
Correlation analysis of artificial Rab interaction network (A) Schematic representation of circuit topologies of artificial Rab interaction network. (B) Pearson correlation quantification between membrane-bound RabX and RabY at low (E = 50) and high (E = 400) effector level for the 32 distinct artificial network topologies (left panel). Representation of artificial network topologies sharing similar Pearson correlation coefficient changes as a function of effector level variation (right panel). (C) Pearson correlation quantification between GTP-bound RabX and RabY at low (E = 50) and high (E = 400) effector level for the 32 distinct artificial network topologies (left panel). Representation of artificial network topologies sharing similar Pearson correlation coefficient changes as a function of effector level variation (right panel). (D) Quantification of Loop index (IDX) between the membrane-bound and the GTP-bound RabX fraction at low (E = 50) and high (E = 400) effector level for the 32 distinct artificial network topologies (top, left panel). Representation of artificial network topologies sharing similar Pearson correlation coefficient changes as a function of effector level variation (top, right panel). Quantification of Loop index (IDX) between the membrane-bound and the GTP-bound RabY fraction at low (E = 50) and high (E = 400) effector level for the 32 distinct artificial network topologies (bottom, right panel). Representation of artificial network topologies sharing similar Pearson correlation coefficient changes as a function of effector level variation (bottom, right panel).
Figure 3
Figure 3
Measure of Rab5 and Rab11 functional interactions using FRET imaging and correlation analysis (A) Schematic representation of the imaging procedure employed to measure Rab5 and Rab11 functional interaction using Rab5 and Rab11 fluorescent probes and activity sensors. The square box represents the magnification of schematic spherical endosomes with Rab5 and Rab11 fluorescent tagged proteins. (B) Representative localization images of both Rab5 FRET biosensor (green) and mCherry-Rab11 (magenta) in the same single Cos-7 cell. Scale bars for whole cell (left panel) and the enlarged spherical endosome (right panel) are shown. (C) Quantification of both Rab5-positive (top panel) and Rab11-positive (bottom panel) structures motility in Cos-7 cells (mean square displacement, MSD). n = 198 Rab5-positive structures ans n = 322 Rab11-positive structures. Black arrow indicates static structures used for subsequent analysis. (D) Representative correlation profiles computed for different combinations of both Rab5 and Rab11 fluorescence intensity (I) and FRET efficiency (E) values measured at the surface of a single spherical endosomes. Dashed and solid lines represent control and Rab11FIP5 expressing cells, respectively (4 trajectories per condition are displayed). n = 12 endosomes for cells co-transfected with Rab5 FRET biosensor, mCherry-Rab11 and either control or Rab11FIP5 plasmids. n = 13 endosomes for cells co-transfected with Rab11 FRET biosensor, mCherry-Rab5 and control plasmid; n = 11 endosomes for cells co-transfected with Rab11 FRET biosensor, mCherry-Rab5 and Rab11FIP5. (E) Representative correlation profiles computed for different combinations of both Rab5 and Rab11 fluorescence intensity (I) and FRET efficiency (E) values measured at the surface of a single spherical endosomes. Dashed and solid lines represent control and Zfyve26 expressing cells, respectively (4 trajectories per condition are displayed). n = 16 endosomes for cells co-transfected with Rab5 FRET biosensor, mCherry-Rab11 and either control or Zfyve26 plasmids. n = 8 endosomes for cells co-transfected with Rab11 FRET biosensor, mCherry-Rab5 and control plasmid. n = 9 endosomes for cells co-transfected with Rab11 FRET biosensor, mCherry-Rab5 and Zfyve26 plasmids.
Figure 4
Figure 4
Functional impact of Zfyve26 on endogenous Rab5 and Rab11 (A) Representative images of spherical endosomes stained for endogenous Rab5 (green), endogenous Rab11 (magenta) and GFP-Zfyve26 (blue). Scale bars for merged image (left panel) and single channels (right panels) are displayed. (B) Number of Rab5 (left panel) and Rab11 (right panel) structures per single cell. Boxplots indicate median (middle line), 25th, 75th percentile (box) and 5th and 95th percentile (whiskers) as well as outliers (single points). ∗ p value <0.05 (Kolmogorov-Smirnov test), n = 102 cells in GFP expressing condition (control), n = 97 cells in GFP-Zfyve26 expressing condition (Zfyve26). (C) Quantification of Rab5 (left panel) and Rab11 mean intensity (right panel) per single spherical endosome. Error bars indicate mean ± S.E.M. ∗∗ p value <0.01, ∗∗∗∗ p value <0.0001 (Student’s t test), n = 26 spherical endosomes in GFP expressing condition (control) and n = 22 spherical endosomes GFP-Zfyve26 expressing condition (Zfyve26). (D) Quantification of Rab5 (left panel) and Rab11 structures area (right panel) per single spherical endosomes. Error bars indicate mean ± S.E.M. ns = not significant, n = 26 spherical endosomes in GFP expressing condition (Control) and n = 22 spherical endosomes in GFP-Zfyve26 expressing condition (Zfyve26). (E) Quantification of Rab5-Rab11 separation per single spherical endosome. Rab5-Rab11 separation is computed as 1 minus Rab5-Rab11 Mander’s coefficient. Error bars indicate mean ± S.E.M. ∗ p value <0.05 (Student’s t test), n = 26 spherical endosomes in GFP expressing condition (Control) and n = 22 spherical endosomes in GFP-Zfyve26 expressing condition (Zfyve26). (F) Quantification of endogenous Rab5-GTP content in cells upon Zfyve26 expression by using Rab5 activation pull-down assay. Representative western blot images (left panel) and quantification (right panel). FC indicate fold-change over control. Error bars indicate mean ± S.E.M. ∗ p value <0.05 (Student’s t test), n = 3 independent experiments. (G) Quantification of transfected Rab5-GTP content in cells upon expression of Rab5 variants and/or Zfyve26 by using Rab5 activation pull-down assay. Representative western blot images (left panel) and quantification (right panels). FC indicate fold-change over control. Error bars indicate mean ± S.E.M. ∗ p value <0.05 (Student’s t test), n = 4 independent experiments. (H) Quantification of endogenous Rab11-GTP content in cells upon Zfyve26 expression by using Rab11 activation pull-down assay. Representative western blot images (left panel) and quantification (right panel). FC indicate fold-change over control. Error bars indicate mean ± S.E.M. ∗ p value <0.05 (Student’s t test), n = 3 independent experiments. (I) Quantification of transfected Rab11-GTP content in cells upon expression of Rab11 variants and/or Zfyve26 by using Rab11 activation pull-down assay. Representative western blot images (left panel) and quantification (right panels). FC indicates fold-change over control. Error bars indicate mean ± S.E.M. ns = not significant, ∗ p value <0.05 (Student’s t test), n = 4 independent experiments. (J) Quantification of transferrin recycling using Alexa Fluor 647-conjugated human transferrin upon GFP (control) or GFP-Zfyve26 overexpression. Representative images (left panels) and quantification (right panel) (scale bar, 10 μm). Data represents mean ± S.E.M., ∗∗∗ p value <0.001 (Student’s t test), n = 3 independent experiments.
Figure 5
Figure 5
Zfyve26 localization on endosomes relies on phosphatidylinositol 3-phosphate (A) Quantification of fluorescence recovery after photo bleaching (FRAP) on GFP-Zfyve26-positive spherical endosomes. Representative image of a cell expressing GFP-Zfyve26 (left). Quantification and representative time course images of a photobleaching experiments (right panels). Gray area represents standard error of mean (SEM) of data. n = 20 GFP-Zfyve26-positive spherical endosomes. (B) Representative western blot of Zfyve26 binding to recombinant GDP- or GTPγS-bound Rab5 by pull-down assay (left panel), n = 3 independent experiments. Representative western blot of Zfyve26 binding to recombinant GDP- or GTPγS-bound Rab11 by pull-down assay (right panel), n = 3 independent experiments. (C) Quantification of the number of GFP-Zfyve26 positive structures per single cell upon treatment with VPS34-IN1, a PIK3C3 inhibitor. Representative images of GFP-Zfyve26 positive structures in control (vehicle, top left panel) or treated (VPS34-IN1, bottom left panel) conditions and quantification (right panel). Boxplots indicate median (middle line), 25th, 75th percentile (box) and 5th and 95th percentile (whiskers). ∗∗∗∗ p value <0.0001 (Kolmogorov-Smirnov test), n = 61 cells in control condition, n = 67 cells in treated cells. (D) Quantification of the number of GFP-Zfyve26 structures in cells co-expressing GFP-Zfyve26/mCherry (control), GFP-Zfyve26/mCherry-Rab5(S34N) (Rab5(S34N)), GFP-Zfyve26/mCherry-Rab5(Q79L) (Rab5(Q79L)),treated with either DMSO (vehicle) or VPS34-IN1 inhibitor (VPS34-IN1). Boxplots indicate median (middle line), 25th, 75th percentile (box) and 5th and 95th percentile (whiskers) as well as outliers (single points). ∗∗∗∗ p value <0.0001 (Kolmogorov-Smirnov test), n = 50 cells in control condition (vehicle), n = 48 cells in Rab5(S34N) condition (vehicle), n = 48 cells in Rab5(Q79L) condition (vehicle), n = 50 cells in control condition (VPS34-IN1), n = 55 cells in Rab5(S34N) condition (VPS34-IN1), n = 50 cells in Rab5(Q79L) condition (VPS34-IN1).
Figure 6
Figure 6
Correlations analysis captures Zfyve26 saturation at the endocytic surface by using loop index (A) Representative magnification of the Rab5 Loop IDX at the surface of a single endocytic organelle resulting from kymograph data in both control (top panels) and Zfyve26 expressing cells (bottom panels). Black-to-green, blue-to-yellow and blue-to-orange gradients represent Rab5 abundance, Rab5 FRET efficiency and Rab5 Loop IDX, respectively. (B) Representative magnification of the Rab11 Loop IDX at the surface of a single endocytic organelle resulting from kymograph data in both control (top panels) and Zfyve26 expressing cells (bottom panels). Black-to-magenta, blue-to-yellow and blue-to-orange gradients represent Rab11 abundance, Rab11 FRET efficiency and Rab11 Loop IDX, respectively. (C) Scatterplot of both Rab5 activity (i.e., Rab5 (E)) and Rab5 Loop IDX measured for both control and Zfyve26 expressing cells transfected with Rab5 activity sensor. White-to-green gradient represents data density for control cells. White-to-dark green gradient represents data density for Zfyve26 expressing cells. Lines represent the correlation (Saturation, Sat.) values (n = 10800 subsampled values). (D) Scatterplot of subsampled RabX activity and RabX Loop IDX at different effector level (0, 50, 200, and 400) using model III. Data magnification for high (top left, 400) and low (bottom left, 50) effector values are displayed. Dots of different green shades represent values obtained at different effector level. (n simulations = 5 × 10, subsampled in batches of n = 50). (E) Scatterplot of both Rab11 activity (i.e., Rab11 (E)) and Rab11 Loop IDX measured for both control and Zfyve26 expressing cells transfected with Rab11 activity sensor. White-to-magenta gradient represents data density for control cells. White-to-dark magenta gradient represents data density for Zfyve26 expressing cells. Lines represent the correlation (Saturation, Sat.) values (n = 10800 subsampled values). (F) Scatterplot of subsampled RabY activity and RabY Loop IDX at different effector level (0, 50, 200, and 400) using model III. Data magnification for high (top left, 400) and low (bottom left, 50) effector values are displayed. Dots of different magenta shades represent values obtained at different effector level. (n simulations = 5 × 10, subsampled in batches of n = 50).

References

    1. Zerial M., McBride H. Rab proteins as membrane organizers. Nat. Rev. Mol. Cell Biol. 2001;2:107–117. doi: 10.1038/35052055. - DOI - PubMed
    1. Sönnichsen B., De Renzis S., Nielsen E., Rietdorf J., Zerial M. Distinct membrane domains on endosomes in the recycling pathway visualized by multicolor imaging of Rab4, Rab5, and Rab11. J. Cell Biol. 2000;149:901–914. doi: 10.1083/jcb.149.4.901. - DOI - PMC - PubMed
    1. Grosshans B.L., Ortiz D., Novick P. Rabs and their effectors: achieving specificity in membrane traffic. Proc. Natl. Acad. Sci. USA. 2006;103:11821–11827. doi: 10.1073/pnas.0601617103. - DOI - PMC - PubMed
    1. Campa C.C., Hirsch E. Rab11 and phosphoinositides: A synergy of signal transducers in the control of vesicular trafficking. Adv. Biol. Regul. 2017;63:132–139. doi: 10.1016/j.jbior.2016.09.002. - DOI - PubMed
    1. Kholodenko B.N. Cell-signalling dynamics in time and space. Nat. Rev. Mol. Cell Biol. 2006;7:165–176. doi: 10.1038/nrm1838. - DOI - PMC - PubMed

LinkOut - more resources