. 2025 Apr 7;7(2):e00226.
doi: 10.1097/BS9.0000000000000226. eCollection 2025 Jun.

Integrated bioinformatics analysis to develop diagnostic models for malignant transformation of chronic proliferative diseases

Affiliations

Integrated bioinformatics analysis to develop diagnostic models for malignant transformation of chronic proliferative diseases

Hua Liu et al. Blood Sci. .

Abstract

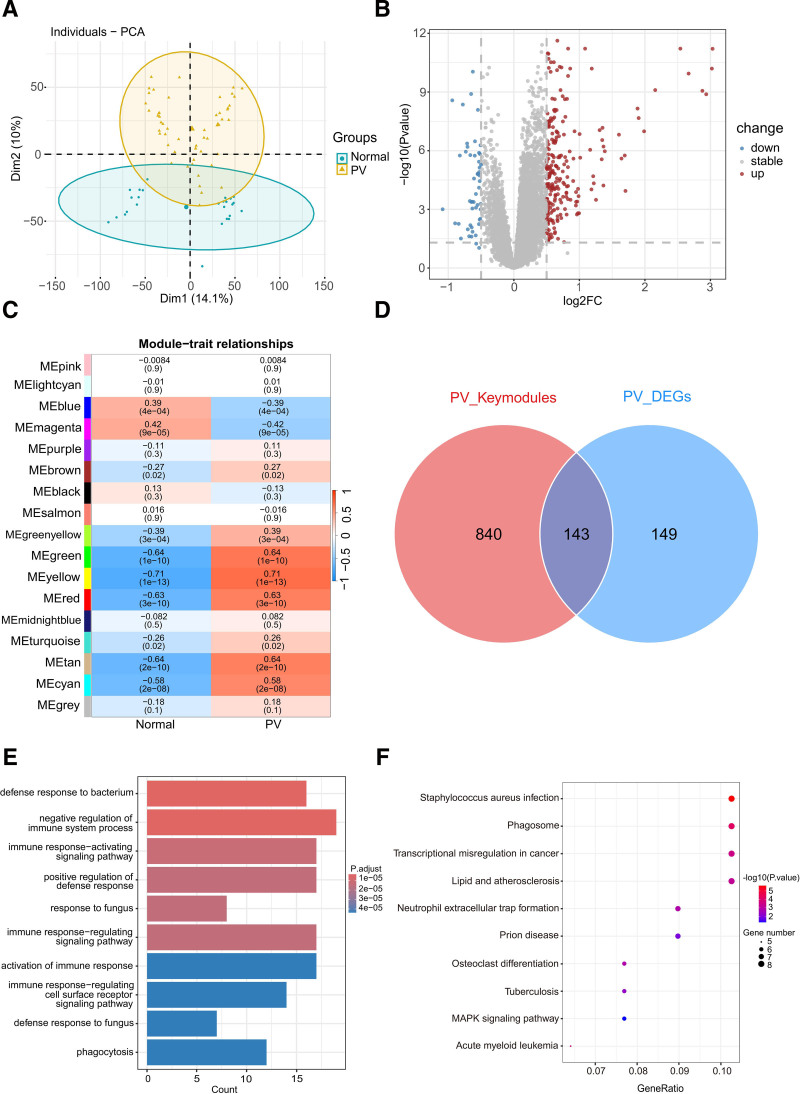
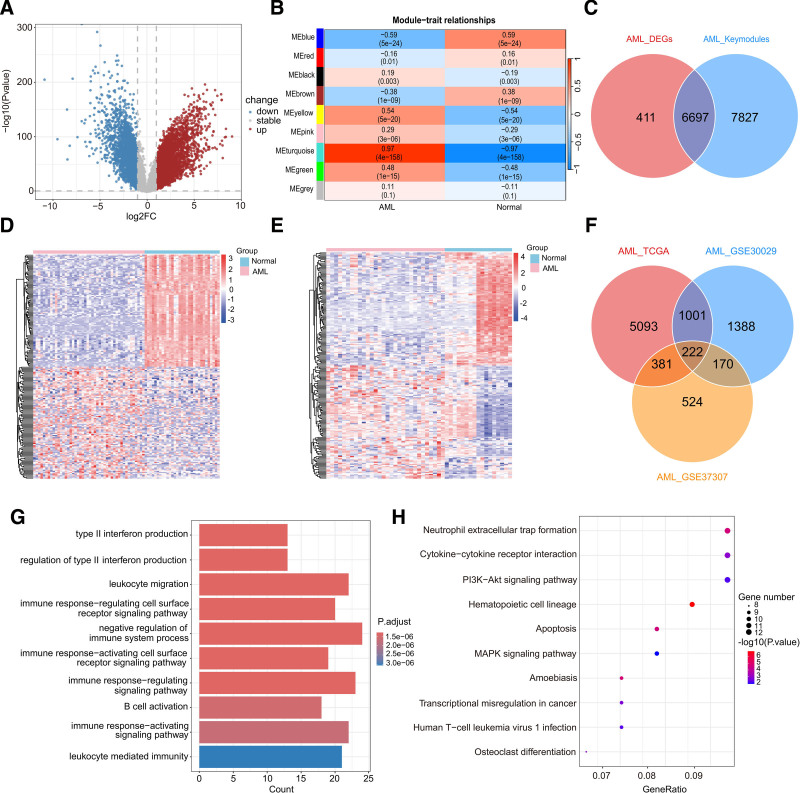
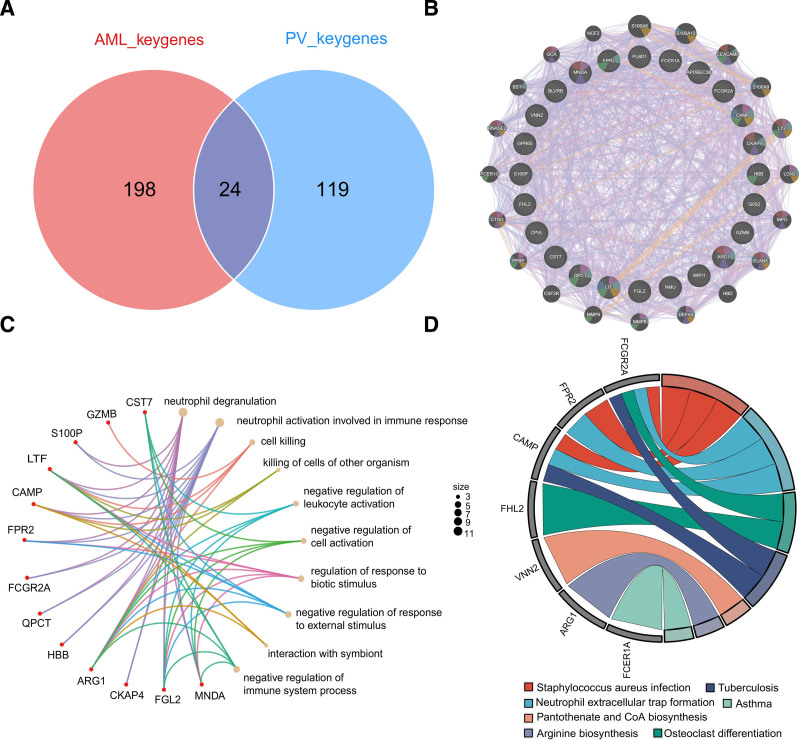
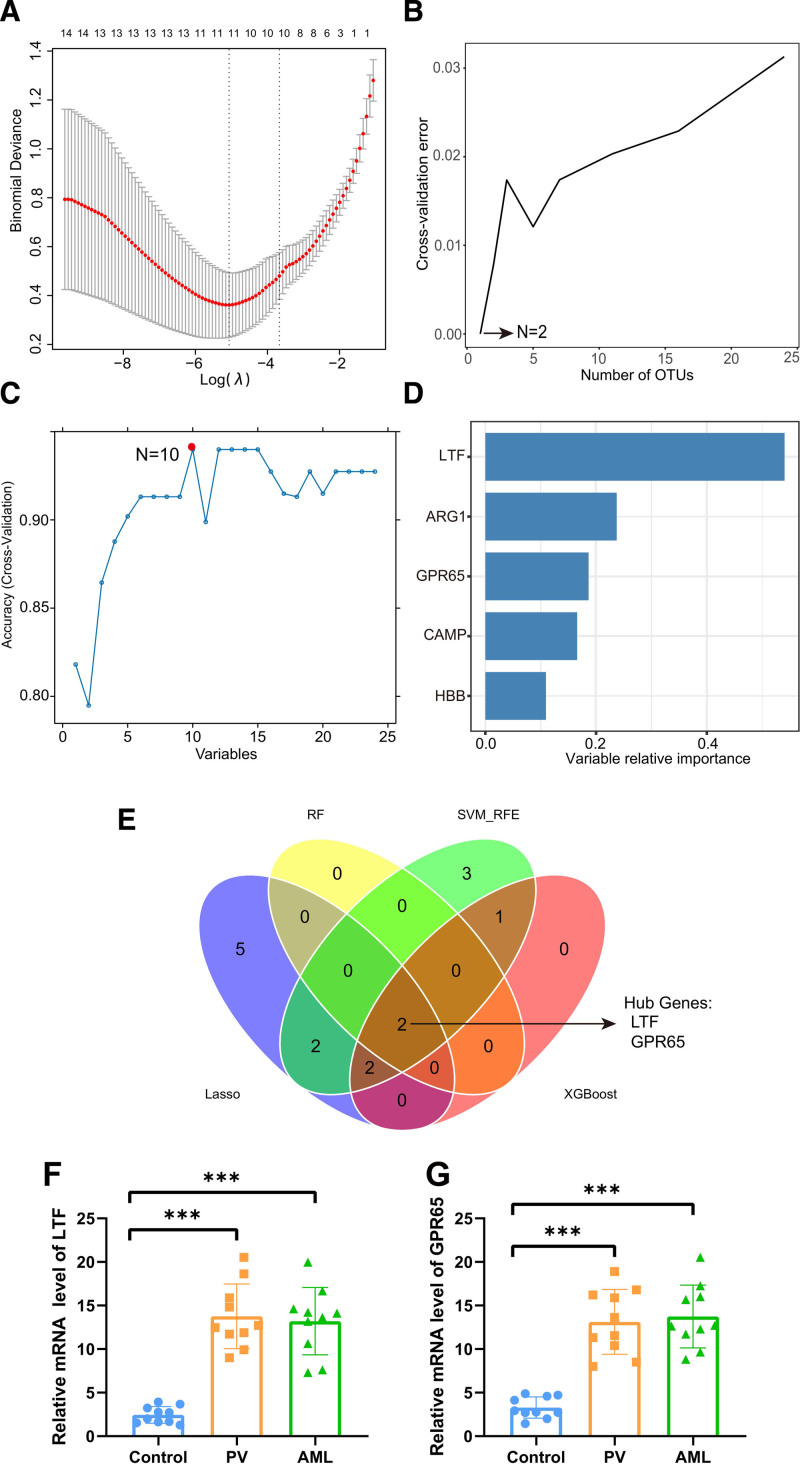
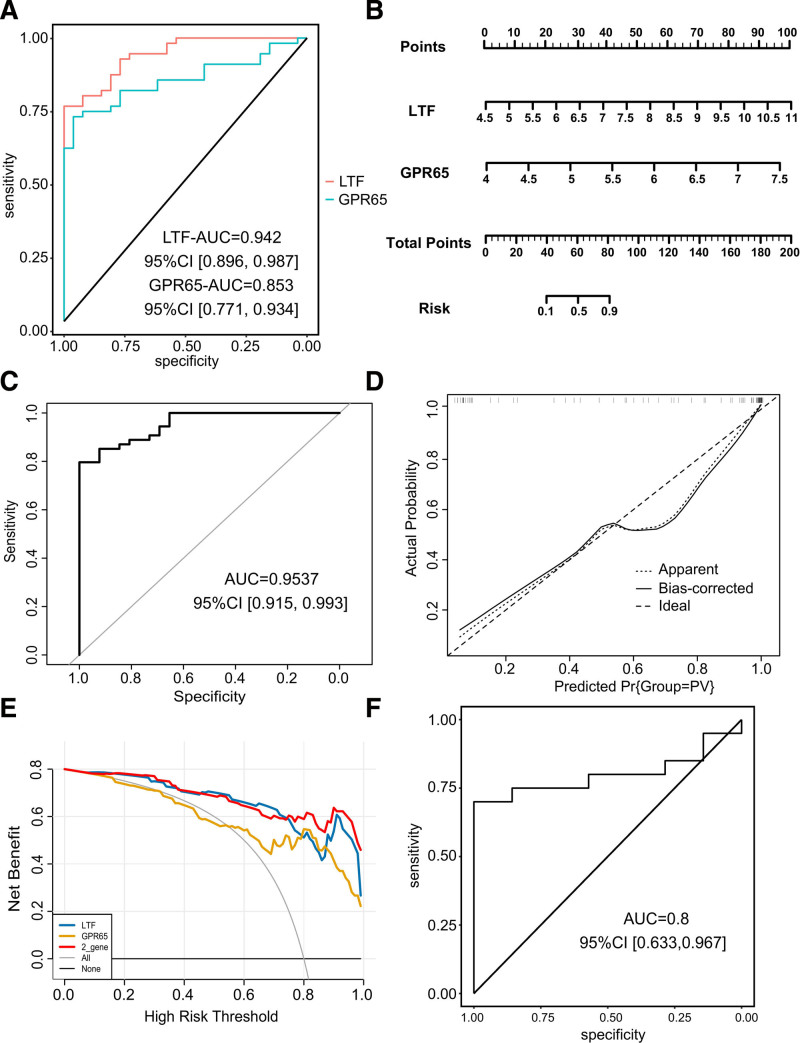
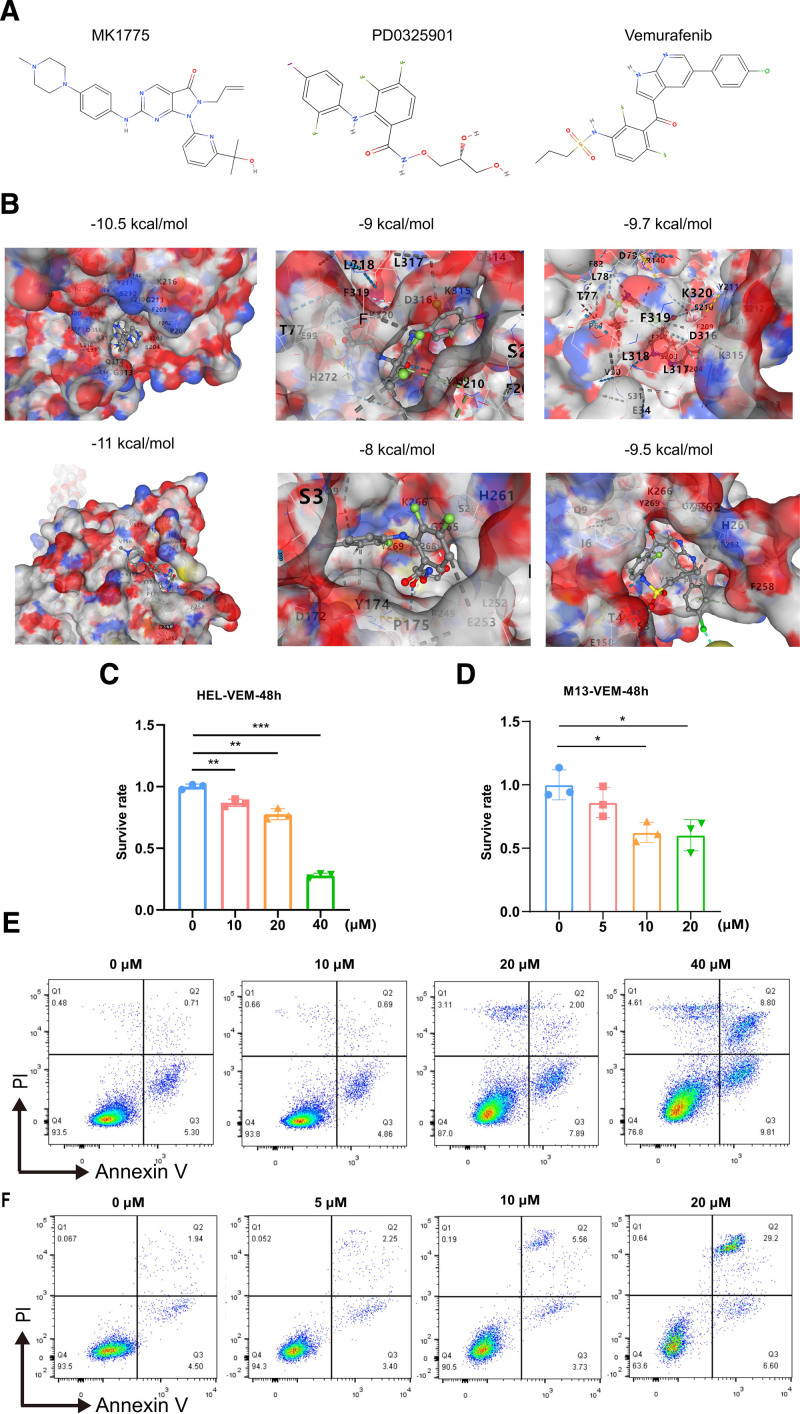
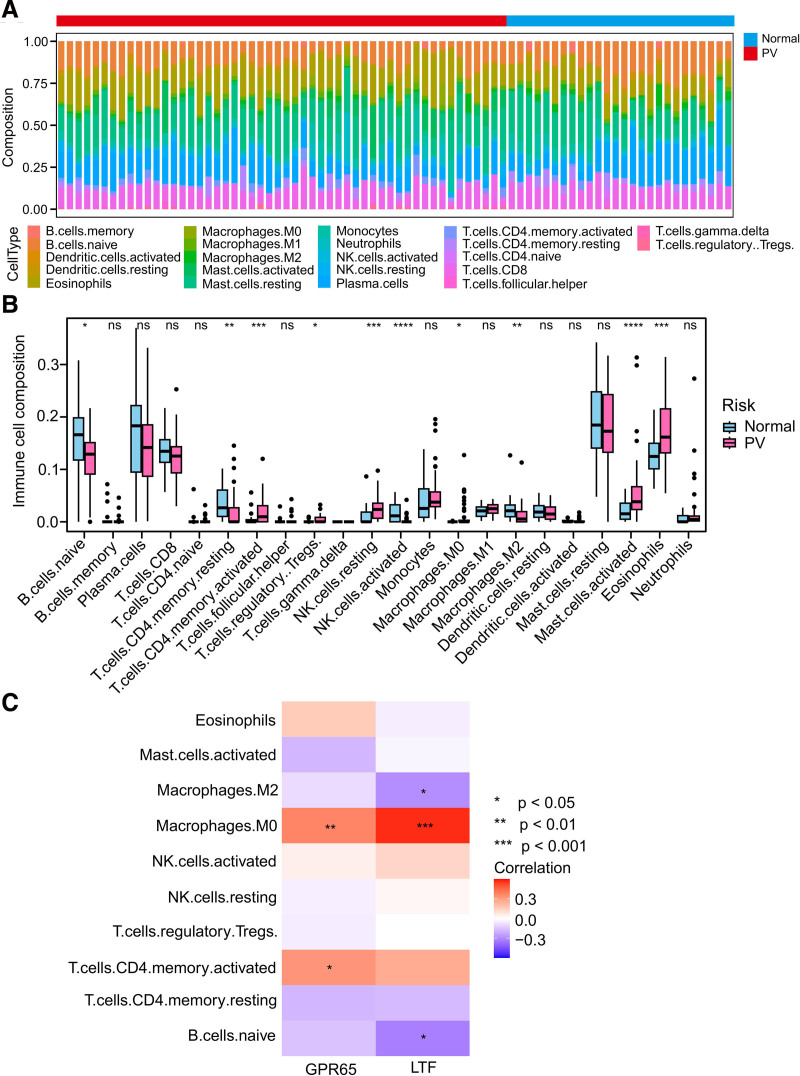
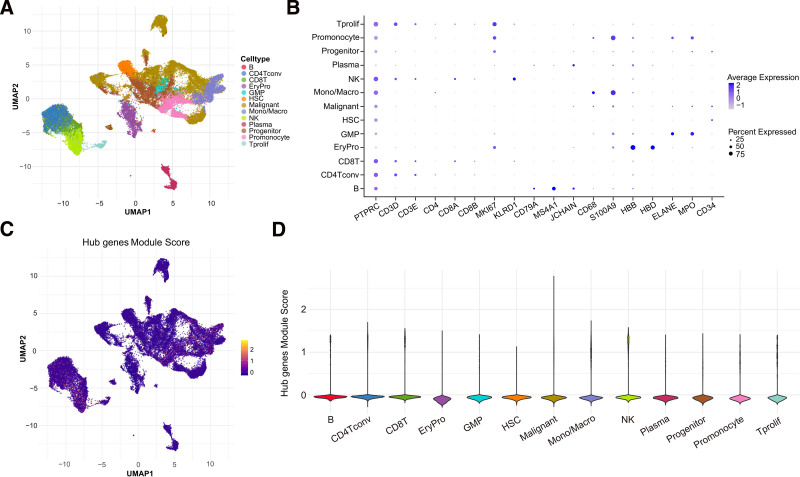
The combined analysis of dual diseases can provide new insights into pathogenic mechanisms, identify novel biomarkers, and develop targeted therapeutic strategies. Polycythemia vera (PV) is a chronic myeloproliferative neoplasm associated with a risk of acute myeloid leukemia (AML) transformation. However, the chronic nature of disease transformation complicates longitudinal high-throughput sequencing studies of patients with PV before and after AML transformation. This study aimed to develop a diagnostic model for malignant transformation of chronic proliferative diseases, addressing the challenges of early detection and intervention. Integrated public datasets of PV and AML were analyzed to identify differentially expressed genes (DEGs) and construct a weighted correlation network. Machine-learning algorithms screen genes for potential biomarkers, leading to the development of diagnostic models. Clinical specimens were collected to validate gene expression. cMAP and molecular docking predicted potential drugs. In vitro experiments were performed to assess drug efficacy in PV and AML cells. CIBERSORT and single-cell RNA-sequencing (scRNA-seq) analyses were used to explore the impact of hub genes on the tumor microenvironment. We identified 24 genes shared between PV and AML, which were enriched in immune-related pathways. Lactoferrin (LTF) and G protein-coupled receptor 65 (GPR65) were integrated into a nomogram with a robust predictive power. The predicted drug vemurafenib inhibited proliferation and increased apoptosis in PV and AML cells. TME analysis has linked these biomarkers to macrophages. Clinical samples were used to confirm LTF and GPR65 expression levels. We identified shared genes between PV and AML and developed a diagnostic nomogram that offers a novel avenue for the diagnosis and clinical management of AML-related PV.

Keywords: Acute myeloid leukemia; Bioinformatics analysis; Biomarker; Hub genes; Machine learning; Polycythemia vera.


Figures

Figure 1.
Figure 1.
Integration of PV datasets and differential expression analysis. (A) PCA plot displaying the distribution of PV patients and normal samples after the removal of batch effects. (B) Volcano plot presenting the differential expression analysis results, showcasing the DEGs between PV patients and normal samples. Upregulated genes are represented by red dots, while downregulated genes are represented by blue dots. (C) Heatmap illustrating the relationship between co-expression modules and disease status. The correlation between model Eigen genes and PV traits (top) is depicted, along with corresponding P values (bottom). (D) Venn diagram depicting the intersection of key modules and DEGs. A total of 143 key genes in PV were identified. (E, F) The GO (E) and KEGG (F) results for key genes of PV. DEG = differentially expressed gene, GO = gene ontology, KEGG = Kyoto Encyclopedia of Genes and Genomes, PCA = principal component analysis, PV = polycythemia vera.
Figure 2.
Figure 2.
Integration of AML datasets and differential expression analysis. (A) Volcano plot presenting the DEGs between AML patients and normal samples. Upregulated genes are indicated by red dots, while downregulated genes are indicated by blue dots. (B) Heatmap illustrating the relationship between co-expression modules and disease status. The correlation between model Eigen genes and AML traits (top) is depicted, along with corresponding P values (bottom). (C) Venn diagram depicting the intersection of key modules and DEGs. A total of 6697 key genes in TCGA-AML were identified. (D, E) The heatmap displaying the top 100 most significantly upregulated or downregulated DEGs in GSE30029 dataset (D) and GSE37307 dataset (E) after difference analysis. (F) Venn diagram depicting the intersection of GSE30029 and GSE37307 datasets and TCGA-AML cohort. (G, H) The GO (G) and KEGG (H) results for key genes of AML. AML = acute myeloid leukemia, DEG = differentially expressed gene, GO = gene ontology, KEGG = Kyoto Encyclopedia of Genes and Genomes, TCGA = the cancer genome atlas.
Figure 3.
Figure 3.
Comprehensive analysis of genes shared by PV and AML. (A) The intersection of key genes in PV and AML resulted in 24 shared genes. (B) PPI network for the obtained 24 shared genes constructed using GeneMANIA. (C) The circular network diagrams depicting the GO-BP enrichment results for the shared genes. (D) KEGG enrichment results and correlations of representative genes and pathways. AML = acute myeloid leukemia, GO-BP = gene ontology-biological process, KEGG = Kyoto Encyclopedia of Genes and Genomes, PV = polycythemia vera.
Figure 4.
Figure 4.
Screening and validation of potential diagnostic markers for AML-related PV using machine-learning approach. (A) Relative change of binomial deviance versus log(λ) plot. The plot demonstrates the variation in binomial deviance as the number of genes included in the model increases. It shows that when the number of genes is 11, the binomial deviance is at its lowest, indicating optimal model performance. (B) Cross-validation curve of the RF algorithm. The curve illustrates the relationship between the number of features retained and the error rate. The plot suggests that the RF algorithm achieves the smallest error when retaining 2 features. (C) SVM-RFE algorithm selected 10 diagnostic biomarkers with the highest accuracy. (D) The XGBoost algorithm is utilized to screen biomarkers and illustrate the relative importance of the top 5 genes. (E) The intersection of genes identified by 4 machine-learning methods yields the most significant 2 potential diagnostic biomarkers (LTF and GPR65) in AML-related PV. (F) RT-qPCR results demonstrating elevated mRNA levels of LTF in clinical samples from both PV and AML patients. (G) RT-qPCR results indicating elevated mRNA levels of GPR65 in clinical samples from both PV and AML patients. ***P < .001. AML = acute myeloid leukemia, GPR65 = G protein-coupled receptor 65, LTF = lactoferrin, OTU = operational taxonomic unit, PV = polycythemia vera, RF = random forest, RT-qPCR = reverse transcription-quantitative polymerase chain reaction.
Figure 5.
Figure 5.
Establishment and evaluation of diagnostic nomogram model. (A) ROC curves illustrating the performance of 2 candidate biomarkers. (B) Nomogram model developed by incorporating LTF and GPR65, providing a visual tool for diagnostic prediction. (C) ROC curves assessing the diagnostic performance of the nomogram model. (D) Calibration curves evaluating the performance of the nomogram model. (E) DCA curves comparing the clinical utility of the nomogram model with single genes. (F) ROC curves demonstrating the performance of the nomogram model in an independent cohort. CI = confidence interval, DCA = decision curve analysis, GPR65 = G protein-coupled receptor 65, LTF = lactoferrin, ROC = receiver operating characteristic.
Figure 6.
Figure 6.
Prediction of potential small-molecule compounds for the treatment of PV using cMAP analysis. (A) Structural formulas of 3 small-molecule drugs have been determined, which can directly display their chemical structures. (B) Schematic diagram of molecular docking structure of Hub genes to 3 small-molecule drugs. (C) Bar plot of small-molecule drug vemurafenib inhibiting HEL cell line proliferation. (D) Bar plot of small-molecule drug vemurafenib inhibiting M13 cell line proliferation. (E, F) Small-molecule drug vemurafenib promotes apoptosis of HEL cell line (E) and M13 cell line (F). *P < .05, **P < .01, ***P < .001. cMAP = connectivity map, PV = polycythemia vera.
Figure 7.
Figure 7.
Analysis of immune cells infiltration in PV. (A) The proportion of various immune cells between the PV and control groups. (B) Comparison of 22 immune cell types between the PV and control normal groups. (C) Spearman correlation depicting the association between 2 genes and differential immune cells observed between PV and normal samples. *P < .05; **P < .01; ***P < .001; ****P < .0001. NK = natural killer, PV = polycythemia vera.
Figure 8.
Figure 8.
Single-cell data analysis for acute myeloid leukemia. (A) UMAP plot of sc-RNAseq data showed 13 distinct clusters. (B) Dot plot of marker gene expression in different key cell types. (C) UMAP plot of hub gene expression in different cell clusters. (D) Violin diagram shows the expression of hub gene (LTF, GPR65) in different cell clusters. AML = acute myeloid leukemia, GMP = granulocyte-monocyte progenitors, GPR65 = G protein-coupled receptor 65, HSC = hematopoietic stem cells, LTF = lactoferrin, NK = natural killer.

Similar articles

References

    1. Peng H, Lan C, Zheng Y, Hutvagner G, Tao D, Li J. Cross disease analysis of co-functional microRNA pairs on a reconstructed network of disease-gene-microRNA tripartite. BMC Bioinf 2017;18(1):193. - PMC - PubMed
    1. Zhu J, Meng H, Zhang L, Li Y. Exploring the molecular mechanism of comorbidity of autism spectrum disorder and inflammatory bowel disease by combining multiple data sets. J Transl Med 2023;21(1):372. - PMC - PubMed
    1. Sun HW, Zhang X, Shen CC. The shared circulating diagnostic biomarkers and molecular mechanisms of systemic lupus erythematosus and inflammatory bowel disease. Front Immunol 2024;15:1354348. - PMC - PubMed
    1. Dai S, Cao T, Shen H, et al. . Landscape of molecular crosstalk between SARS-CoV-2 infection and cardiovascular diseases: emphasis on mitochondrial dysfunction and immune-inflammation. J Transl Med 2023;21(1):915. - PMC - PubMed
    1. Zhang Z, Zhao L, Wei X, et al. . Integrated bioinformatic analysis of microarray data reveals shared gene signature between MDS and AML. Oncol Lett 2018;16(4):5147–5159. - PMC - PubMed

LinkOut - more resources