. 2025 Mar 17:57:101647.
doi: 10.1016/j.ijcha.2025.101647. eCollection 2025 Apr.

Increased neprilysin expression is linked to atrial fibrotic remodeling in cardiovascular surgery patients

Affiliations

Increased neprilysin expression is linked to atrial fibrotic remodeling in cardiovascular surgery patients

Toshiaki Nakajima et al. Int J Cardiol Heart Vasc. .

Abstract

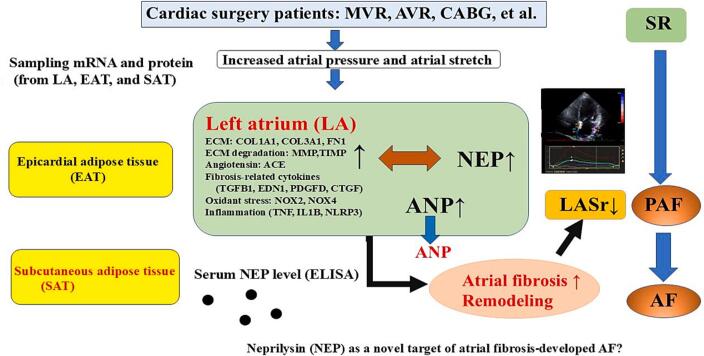
Background: Neprilysin (NEP) is a membrane-bound neutral endopeptidase with various physiological functions. We investigated the roles of NEP in atrial fibrotic remodeling and atrial fibrillation (AF) in patients undergoing cardiovascular surgery.

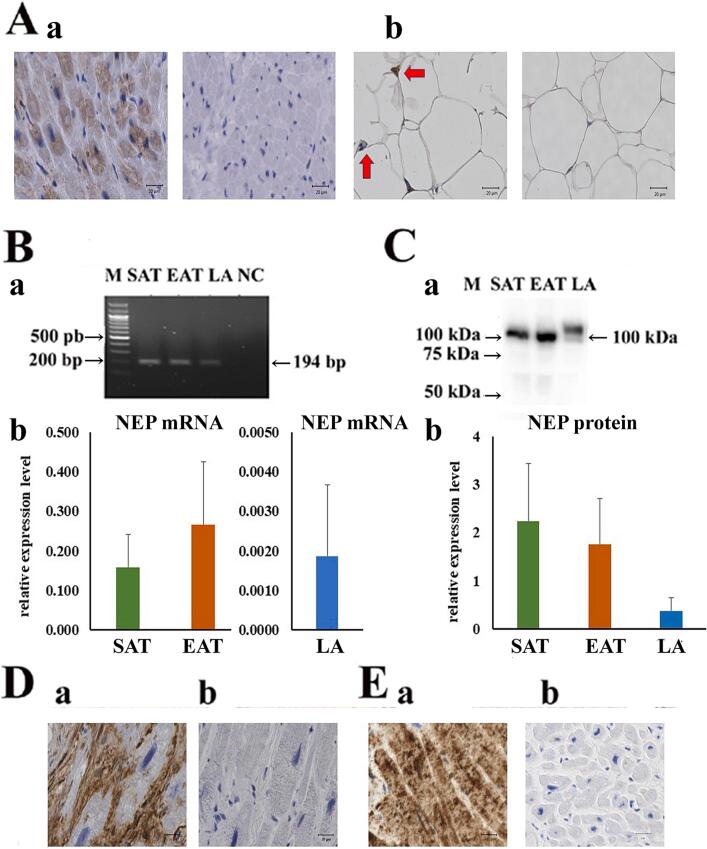
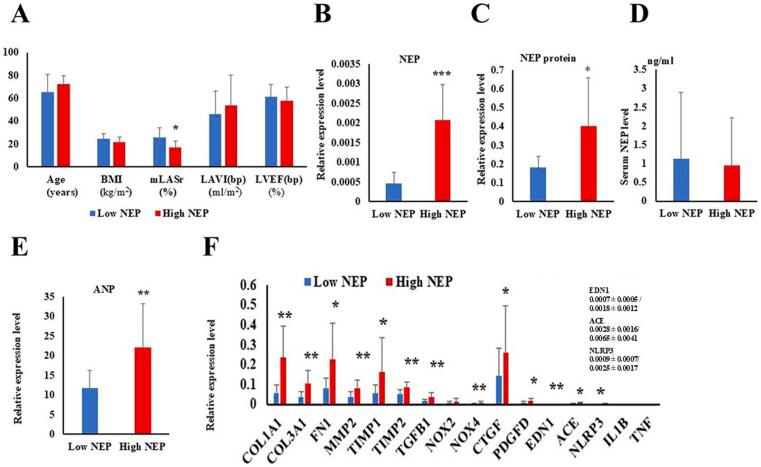
Methods: Atrial tissue samples were obtained from left atrium (LA) appendages, and mRNA expression level was analyzed by real-time reverse transcription polymerase chain reaction in 61 cases (25 paroxysmal fibrillation (PAF), 36 AF). Adipose tissue (AT) mRNA expression levels were also analyzed. Western blotting and immunohistochemical staining were used for determining tissue protein expression. Serum NEP levels were measured by enzyme-linked immunosorbent assay (ELISA). Two-dimensional speckle tracking echocardiography was performed to measure mean left atrial reservoir strain (mLASr) to evaluate atrial remodeling in pre-operative patients and control participants.

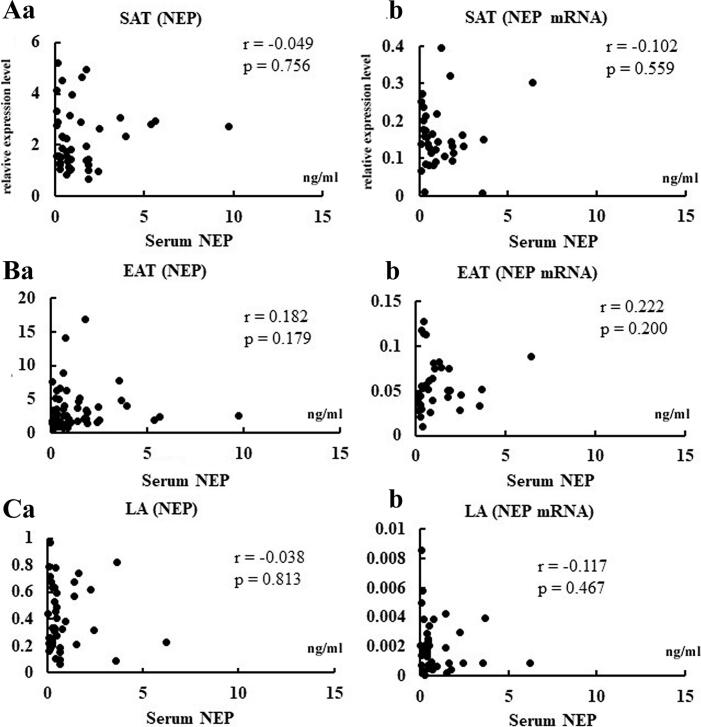
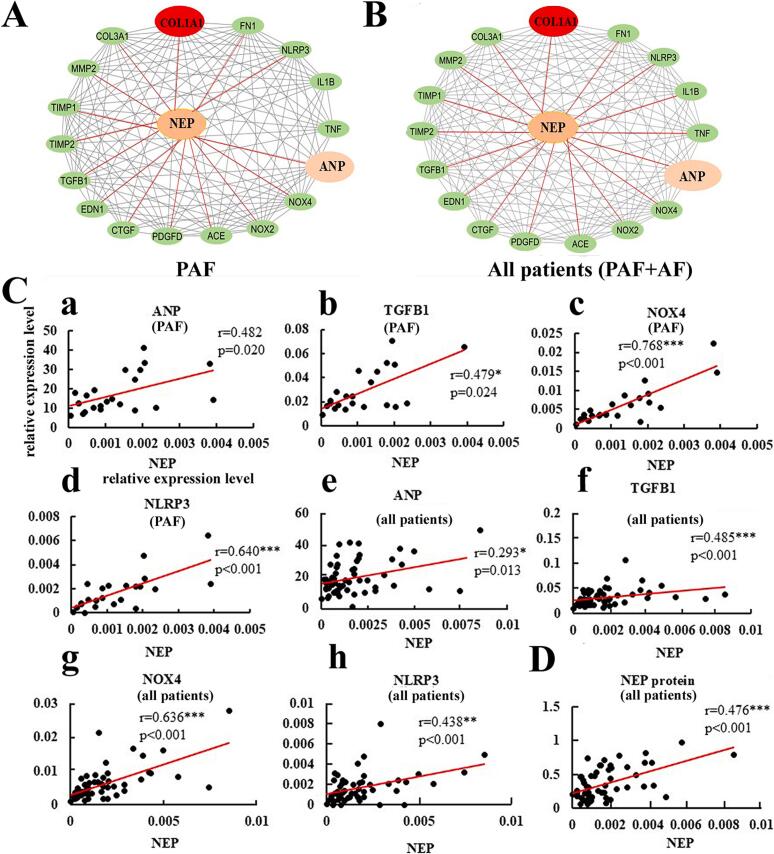
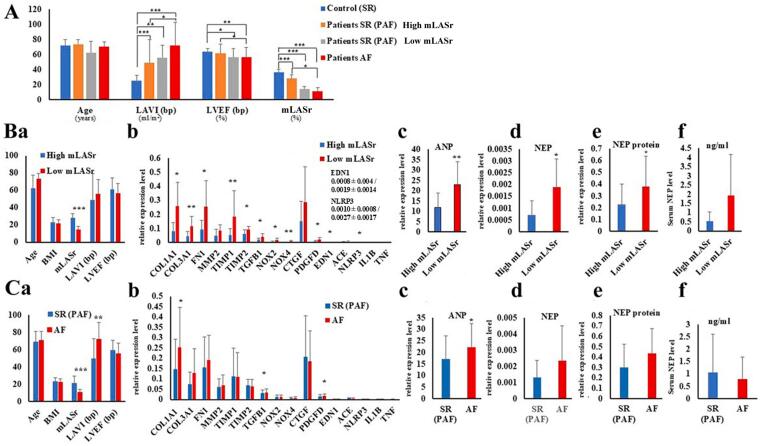
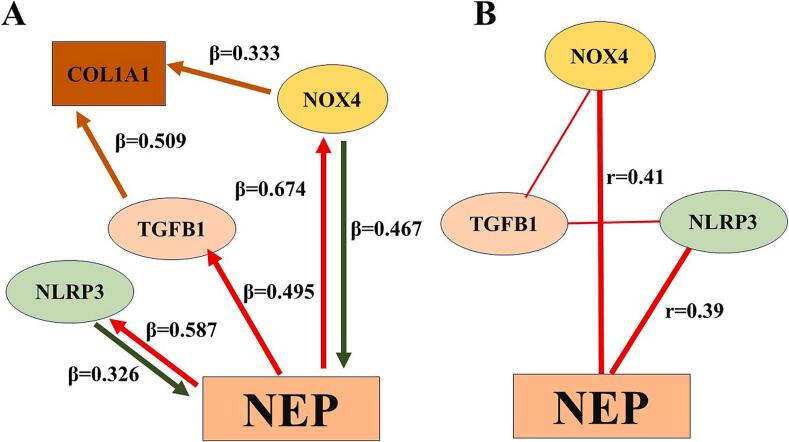
Results: Immunohistochemical staining and western blotting revealed NEP expression in both AT and LA. Serum NEP levels did not correlate with NEP mRNA or protein expression in AT and LA. NEP mRNA expression levels correlated with fibrosis-related gene expression. NEP mRNA, protein, and fibrosis-related gene expression levels increased in PAF patients with low mLASr compared with high mLASr. PAF patients with high NEP mRNA expression showed increased fibrosis-related gene expression compared with those with low NEP expression. Multiple regression analysis revealed that NEP mRNA expression level was an independent variable for predicting fibrosis-related gene expression, whereas NOX4 and NLRP3 were independent variables for predicting NEP expression levels.

Conclusions: Increased atrial expression of NEP is linked to atrial fibrotic remodeling, and the development of AF in patients undergoing cardiovascular surgery.

Keywords: Atrial fibrillation; Atrial fibrosis; COL1A1; Cardiovascular surgery; Collagen; Left atrium reservoir strain; Neprilysin; TGFβ1.


Conflict of interest statement

The authors declare that they have no known competing financial interests or personal relationships that could have appeared to influence the work reported in this paper.

Figures

Fig. 1
Fig. 1
Expression of NEP mRNA and protein in both LA tissue and adipose tissue. A: Immunohistochemical staining of NEP in LA tissue (LA, a) and epicardial adipose tissue (EAT, b). Negative control without antibodies (anti-NEP) is also shown (right panel). Immunocytochemical studies showed that both the LA and adipose tissues (indicated by red arrows) were positively immunostained with anti-NEP. B: NEP mRNA expression detected by RT-PCR in the SAT (n = 44), EAT (n = 58), and LA (n = 61). M: marker, NC: negative control (a). The relative expression levels of NEP mRNA, normalized to GAPDH as an internal control, are shown in b. C: NEP protein expression measured by western blot analysis. The relative expression levels of NEP protein (SAT (n = 44), EAT (n = 58), and LA (n = 61)), normalized with reference to GAPDH as an internal control, are shown in b. D and E: Immunohistochemical staining of collagen type I α1 (Da) and ANP (Ea) in LA tissues. A negative control without antibodies (anti-collagen type I α1 or anti-ANP) is also shown (Db, Eb).
Fig. 2
Fig. 2
Relationships between serum NEP levels and tissue NEP expression levels (adipose and LA tissues). A: Relationship between serum NEP levels and NEP protein (a) and mRNA expression (b) in the SAT (n = 44). B: Relationship between serum NEP levels and NEP protein (a) and mRNA expression (b) in EAT (n = 58). C: Relationship between serum NEP levels and NEP protein (a) and mRNA expression (b) in the LA (n = 61). The r- and p-values are shown.
Fig. 3
Fig. 3
Correlations among NEP, atrial fibrosis-related gene expression level, and NEP protein in LA. A and B: Correlations between NEP/ANP mRNA levels and atrial fibrosis-related gene expression level in PAF patients (A, n = 24–25) and all patients (B, n = 59–61). Significant correlations among ATP, and fibrosis-related gene expression are illustrated by black lines in PAF (A) and in all patients (B). Significant positive correlations among NEP, and fibrosis-related gene expression are illustrated by brown lines in PAF (A) and in all patients (B). C: Correlations among fibrosis-related gene expression level (ANP, TGFB1, NOX4, NLRP3) and NEP in PAF patients (a-d) and all patients (e-h) receiving LA resection. *p < 0.05, **p < 0.01, ***p < 0.001 D: Correlations between atrial NEP mRNA and protein expression level in all patients. Note that significant correlations were observed between atrial NEP mRNA and protein expression level.
Fig. 4
Fig. 4
Comparison of echocardiographic parameters and fibrosis-related gene expression level including NEP mRNA and protein between PAF with low and high mLASr and AF. A: Age and echocardiographic differences between control participants (n = 109) and PAF patients (n = 21) with low and high mLASr and AF (n = 34). PAF patients (n = 21) were divided into two groups (low mLASr (n = 10, male 5, female 5) and high mLASr (n = 11, male 7, female 4) based on the median mLASr value. B: Comparisons of echocardiographic findings, gene expression levels, and NEP protein, and serum NEP level between PAF patients with high and low LASr. (a) Age, BMI, and echocardiographic findings; (b) fibrosis-related gene expression, (c) ANP mRNA, (d) NEP mRNA, (e) NEP protein, and (f) serum concentration of NEP. Blue bar, high mLASr (n = 10–11); red bar, low mLASr (n = 9–10). C: Comparisons of echocardiographic findings, gene expression levels, and NEP protein, and serum NEP level between PAF and AF patients. (a) Age, BMI, and echocardiographic findings. Blue bar, SR (PAF, n = 21); red bar, AF (n = 34). (b-f) fibrosis-related gene expression (b), ANP mRNA (c), NEP mRNA (d), NEP protein (e), and serum concentration of NEP (f). For some genes, actual data (mean ± standard deviation) are shown in the figure. Blue bar, SR (PAF, n = 24–25); red bar, AF (n = 34–36). *p < 0.05, **p < 0.01, ***p < 0.001.
Fig. 5
Fig. 5
Comparison of echocardiographic findings and gene expression levels between PAF patients with atrial low NEP and high NEP expression. A: Age, BMI, and echocardiographic findings in PAF patients (n = 21) with low or high atrial NEP mRNA expression. B-F: Comparison of NEP mRNA (B), NEP protein level (C), serum concentration of NEP (D), ANP mRNA (E), and fibrosis-related gene expression (F) between PAF patients (n = 25) with low and high NEP mRNA expression. For some genes, actual data (mean ± standard deviation) are shown in the figure. Red bar, high NEP (n = 12–13); blue bar, low NEP (n = 11–12). *p < 0.05, **p < 0.01.
Fig. 6
Fig. 6
Multiple linear regression analysis and partial correlation analysis between atrial NEP mRNA expression level and fibrosis-related gene expression level. A: Multiple regression analysis. Multivariate regression analysis showed that 1) log (TGFB1) and log (NOX4) were independent variables for predicting log (COL1A1) expression (brown arrow). 2) Log (NOX4) and log (NLRP3) were independent variables for predicting log (NEP) expression levels (green arrow). 3) Log (NEP) was an independent variable for predicting log (NLRP3), log (TGFB1), and log (NOX4) (red arrow). β-values are shown. B: Partial correlation analysis of NOX4, TGFB1, NLRP3, and NEP. Log (NEP) expression level was significantly positively correlated with log (NOX4) (r = 0.41) and log (NLRP4) (r = 0.39) expression level, but not with log (TGFB1). The partial correlation coefficients (r) are also shown. The lines connecting each index have a partial correlation coefficient of 0.25 or more.
Fig. 7
Fig. 7
Graphic abstract of the study.

Similar articles

References

    1. Burstein B., Nattel S. Atrial fibrosis: mechanisms and clinical relevance in atrial fibrillation. J. Am. Coll. Cardiol. 2008;51(8):802–809. - PubMed
    1. Nattel S. Molecular and cellular mechanisms of atrial fibrosis in atrial fibrillation. JACC Clin Electrophysiol. 2017;3(5):425–435. - PubMed
    1. Savelieva I., Kakouros N., Kourliouros A., Camm A.J. Upstream therapies for management of atrial fibrillation: review of clinical evidence and implications for European society of cardiology guidelines Part I: primary prevention. Europace. 2011;13(3):308–328. - PubMed
    1. DeVore A.D., Braunwald E., Morrow D.A., Duffy C.I., Ambrosy A.P., Chakraborty H., McCague K., Rocha R., Velazquez E.J. Initiation of angiotensin-neprilysin inhibition after acute decompensated heart failure: secondary analysis of the open-label extension of the PIONEER-HF trial. JAMA Cardiol. 2020;5(2):202–207. - PMC - PubMed
    1. Roques B.P., Noble F., Daugé V., Fournié-Zaluski M.C., Beaumont A. Neutral endopeptidase 24.11: structure, inhibition, and experimental and clinical pharmacology. Pharmacol. Rev. 1993;45(1):87–146. - PubMed

LinkOut - more resources