Warming degrades nutritional quality of periphyton in stream ecosystems: evidence from a mesocosm experiment
- PMID: 40201424
- PMCID: PMC11977459
- DOI: 10.1093/ismeco/ycaf051
Warming degrades nutritional quality of periphyton in stream ecosystems: evidence from a mesocosm experiment
Abstract
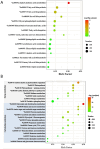
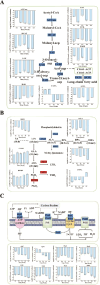
Periphyton, which is rich in polyunsaturated fatty acids (PUFA), serves as an indispensable high-quality basal resource for consumers in stream food webs. However, with global warming, how fatty acid composition of periphyton changes and consequent effects on their transfer to higher trophic level consumers remain unclear. By carrying out a manipulative mesocosm experiment with a 4°C increase, warming led to a significant decrease in the proportions of PUFA and Long-chain PUFA (LC-PUFA, >20 C) in periphyton from 13.32% to 9.90% and from 3.05% to 2.18%, respectively. The proportions of three PUFAs-α-linolenic acid (18:3ω3), arachidonic acid (ARA, 20:4ω6), and docosahexaenoic acid (22:6ω3)-also declined significantly (P < .05). Notably, the fatty acid profile of the consumer-Bellamya aeruginosa reflected the changes in basal resources, with a decrease in PUFA from 40.14% to 36.27%, and a significant decrease in LC-PUFA from 34.58% to 30.11%. Although algal community composition in biofilms did not significantly change with warming, significant transcriptomic alterations were observed, with most differentially expressed genes related to fatty acid synthesis in lipid metabolism and photosynthesis down-regulated. Our findings indicate that warming may hinder the production and transfer of high-quality carbon evaluated by LC-PUFA to consumers, consequently affect the complexity and stability of stream food webs.
Keywords: fatty acid; food quality; nutrient transfer; periphyton; river ecosystem; transcriptome; warming.
© The Author(s) 2025. Published by Oxford University Press on behalf of the International Society for Microbial Ecology.
Conflict of interest statement
The authors declare that they have no known competing financial interests or personal relationships that could have appeared to influence the work reported in this paper.
Figures


Similar articles
-
How do small dams alter river food webs? A food quality perspective along the aquatic food web continuum.J Environ Manage. 2024 Mar;355:120501. doi: 10.1016/j.jenvman.2024.120501. Epub 2024 Mar 3. J Environ Manage. 2024. PMID: 38437746
-
Does periphyton turn less palatable under grazing pressure?ISME Commun. 2024 Nov 19;4(1):ycae146. doi: 10.1093/ismeco/ycae146. eCollection 2024 Jan. ISME Commun. 2024. PMID: 39759835 Free PMC article.
-
Longitudinal variation in the nutritional quality of basal food sources and its effect on invertebrates and fish in subalpine rivers.J Anim Ecol. 2021 Nov;90(11):2678-2691. doi: 10.1111/1365-2656.13574. Epub 2021 Aug 19. J Anim Ecol. 2021. PMID: 34358339
-
Fatty acids as dietary biomarkers in mangrove ecosystems: Current status and future perspective.Sci Total Environ. 2020 Oct 15;739:139907. doi: 10.1016/j.scitotenv.2020.139907. Epub 2020 Jun 3. Sci Total Environ. 2020. PMID: 32544684 Review.
-
Genetics of Omega-3 Long-Chain Polyunsaturated Fatty Acid Metabolism and Meat Eating Quality in Tattykeel Australian White Lambs.Genes (Basel). 2020 May 25;11(5):587. doi: 10.3390/genes11050587. Genes (Basel). 2020. PMID: 32466330 Free PMC article. Review.
References
-
- Hauer FR, Lamberti GA. Methods in Stream Ecology. Volume 1, Ecosystem Structure (Third Edition). Amsterdam: Academic Press, 2017.
Associated data
LinkOut - more resources
Full Text Sources

