. 2025 Mar 25:12:1492051.
doi: 10.3389/fcvm.2025.1492051. eCollection 2025.

Knowledge domains and hotspots of the association between hypertension and noise: a bibliometric analysis and visualization study from 2003 to 2023

Affiliations

Knowledge domains and hotspots of the association between hypertension and noise: a bibliometric analysis and visualization study from 2003 to 2023

Tianqi Wu et al. Front Cardiovasc Med. .

Abstract

Objectives: Noise pollution has become an increasingly severe environmental issue in modern society and has been recognized for its adverse effects on cardiovascular diseases. Hypertension induced by noise exposure has garnered significant research interest and a large quantity of studies have been conducted. This study aims to employ bibliometric methods to comprehensively review the literature on the relationship between noise exposure and hypertension and to analyze the current state of research by identifying key areas of focus while also exploring future trends in this field.

Methods: The bibliometric analysis was conducted using the Web of Science Core Collection (WoSCC) database. The search query included terms related to noise pollution and hypertension. The timeframe for the search was from 2003 to 2023. Data analysis and visualization were performed using VOSviewer, CiteSpace, Scimago Graphica, and Rtools, focusing on publication trends, citation metrics, explosive intensity, and collaborative networks. Pajek was used to adjust pictures.

Results: The bibliometric analysis showed a notable rise in research output on the relationship between noise pollution and hypertension. The United States led in the number of publications, with China and Germany coming next. The study identified several key contributors, with Muenzel Thomas being the most prolific author, followed by Daiber Andreas and Pershagen Goran. Institutionally, Johannes Gutenberg University Mainz emerged as the leading institution in terms of publications, followed by Karolinska Institute. Collaborative networks among institutions highlighted significant international cooperation, with extensive collaborations observed, particularly between European and North American institutions. The study also pinpointed research hotspots and emerging trends through keyword analysis. Key areas of focus included the mechanisms linking noise exposure to hypertension, the impact of noise on cardiovascular health, and the role of environmental stressors.

Conclusions: This study advances our understanding of noise-induced hypertension's physiological and biological mechanisms, emphasizing the need for continued research. The research underscores the necessity of addressing noise pollution as a significant public health concern.

Keywords: CiteSpace; VOSviewer; bibliometrics; hypertension; noise.


Conflict of interest statement

The authors declare that the research was conducted in the absence of any commercial or financial relationships that could be construed as a potential conflict of interest.

Figures

Figure 1
Figure 1
Data retrieval process Flowchart. #, connection character; TS, topic search.
Figure 2
Figure 2
Number of publications and citations from 2003 to 2023. (A) The total number of publications each year, with a trend line fitted using lasso regression to capture the overall publication growth trend. (B) The total number of citations each year, illustrating the citation trend.
Figure 3
Figure 3
Distribution of countries and regions. (A) The top 10 countries ranked by the total number of publications and their corresponding citation counts, highlighting the most influential contributors in the field. (B) Cluster analysis of contributing countries, generated using Scimago Graphica. (C) Network visualization of countries and regions, each node represents a country, with node size proportional to the number of publications produced by that country. The connections between nodes indicate collaborative relationships between countries. (D) Map of international collaborations, illustrating co-authorship relationships between countries.
Figure 4
Figure 4
Author co-citation visualization map. Circle size reflects the author's total citations. Line thickness indicates the strength of co-citation relationships, with thicker lines denoting stronger associations. (A) Clustering of authors based on co-citation patterns, with colors representing different author groups. (B) Temporal changes in co-citation relationships, with colors indicating the evolution of these relationships over time.
Figure 5
Figure 5
The network map of institutions. (A) Institutional cooperation network, illustrating collaborative relationships between institutions. (B) Evolution of the institutional network over time, showing the development and changes in institutional connections.
Figure 6
Figure 6
The dual-map overlay of journals. A dual-map overlay visualization showing the citation relationships between journals in two fields, with citation flows represented by colored arcs.
Figure 7
Figure 7
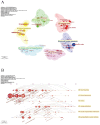
Keyword network analysis. (A) Network map of the top 100 keywords, organized into 4 clusters based on co-occurrence. (B) Density view highlighting the concentration of keyword relationships within the network.
Figure 8
Figure 8
Keyword cluster analysis. (A) Cluster analysis of keywords conducted using CiteSpace. (B) Timeline view of the clusters, illustrating the evolution of keyword trends over time.
Figure 9
Figure 9
Keyword analysis using rtools. (A) Heatmap of keywords generated using Rtools, showing the frequency and intensity of keyword occurrences. (B) Line chart of keyword trends over time, created with Rtools, depicting the temporal evolution of keyword usage.
Figure 10
Figure 10
The top 15 keywords with the strongest citation burst. A visualization of the top 15 keywords exhibiting the most significant citation bursts, indicating rapid increases in citations over time.
Figure 11
Figure 11
The top 10 cited papers in noise and hypertension.

Similar articles

References

    1. Zhou Z, Wang L, Chen Y. Enhancing the study of air pollution, metabolomic signatures, and chronic respiratory disease risk: addressing dietary, noise, and exposure factors. Chest. (2025) 167(2):e66. 10.1016/j.chest.2024.09.040 - DOI - PubMed
    1. Song Y, Wang X, Zhang H, Ma R, Kang Y, Di X, et al. High-intensity acute noise exposure causes anxiety in female rats by inducing hippocampal neuron apoptosis. Ecotoxicol Environ Saf. (2025) 291:117833. 10.1016/j.ecoenv.2025.117833 - DOI - PubMed
    1. Mannucci PM, Ancona C. Noise and air pollution as triggers of hypertension. Eur Heart J. (2021) 42(21):2085–7. 10.1093/eurheartj/ehab104 - DOI - PubMed
    1. Chen J, Hart JE, Fisher NDL, Yanosky JD, Roscoe C, James P, et al. Childhood exposure to air pollution, noise, and surrounding greenness and incident hypertension in early adulthood in a US nationwide cohort -the growing up today study (GUTS). Environ Res. (2024) 263(Pt 2):120153. 10.1016/j.envres.2024.120153 - DOI - PMC - PubMed
    1. Münzel T, Gori T, Babisch W, Basner M. Cardiovascular effects of environmental noise exposure. Eur Heart J. (2014) 35(13):829–36. 10.1093/eurheartj/ehu030 - DOI - PMC - PubMed

LinkOut - more resources