. 2025 Apr;292(2044):20250221.
doi: 10.1098/rspb.2025.0221. Epub 2025 Apr 9.

Record of Foraminifera test composition throughout the Phanerozoic

Affiliations

Record of Foraminifera test composition throughout the Phanerozoic

Katherine Faulkner et al. Proc Biol Sci. 2025 Apr.

Abstract

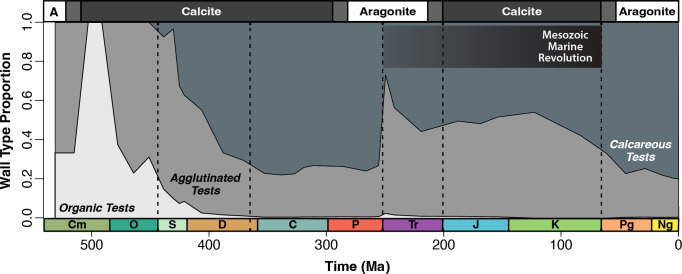
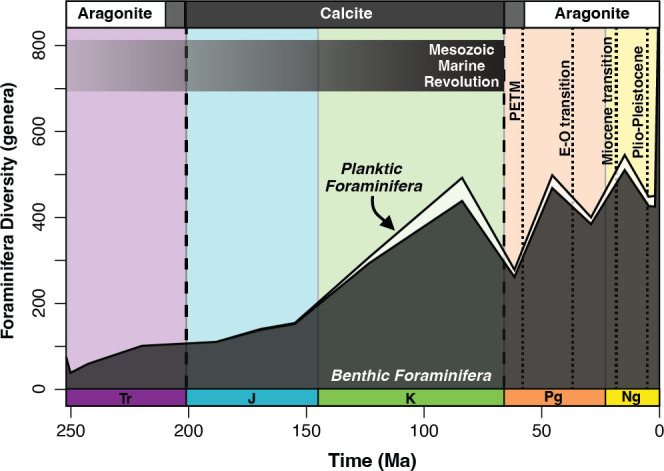
Marine calcifiers produce calcareous structures (e.g. shells, skeletons or tests) and are therefore sensitive to ocean chemistry. Nevertheless, the long-term evolutionary consequences of marine carbonate changes are not well understood. This article compares calcareous and non-calcareous responses to ocean chemistry changes throughout the Phanerozoic Eon (541 million years ago to present). To accomplish this, we calculated proportional wall-type diversity, origination rates and extinction rates for 2282 benthic foraminiferal genera. Calcareous origination and extinction rates fluctuated throughout the Palaeozoic Era (541-251.9 million years ago), but during the Mesozoic Era (251.9-66 million years ago), calcareous origination and extinction rates stabilized following the evolution of pelagic calcifiers. Despite variations in Cenozoic Era (66-0 million years ago) foraminifera diversity, calcareous wall types maintained around 77% proportional diversity. Although calcareous wall-type extinction rates decline during the Mesozoic and Cenozoic, Phanerozoic foraminifera wall-type changes during individual events are largely contingent upon contemporaneous conditions rather than overarching trends. Of the Big Five mass extinction events, calcareous wall-type proportions only decreased at the end-Permian (73% to 26% diversity) and end-Triassic (56% to 50% diversity). These results suggest long-term ocean chemistry changes were not the main driver of foraminiferal wall-type diversity through time.

Keywords: Foraminifera; Phanerozoic; benthic; calcium carbonate; marine ecosystems.


Conflict of interest statement

We declare we have no competing interests.

Figures

Wall-type diversity, origination rates and extinction rates throughout the Phanerozoic.
Figure 1.
Wall-type diversity, origination rates and extinction rates throughout the Phanerozoic. Foraminifera origination (top, dark blue) and extinction (middle, dark orange) rates in the dataset compared to the expected values within a 95% CI range (blue shading = origination; orange shading = extinction) throughout the Phanerozoic Eon. The bottom plot is generic diversity of Phanerozoic foraminifera [25] separated by wall type (dark grey = calcareous; light grey = agglutinated; off-white (not visible) = organic). Vertical dashed lines indicate the Big Five mass extinction events [37]; the Phanerozoic time scale is at the bottom of the figure; transitions between calcite and aragonite seas are indicated at the top of the figure and the black gradient bar (middle) represents the approximate duration of the Mesozoic Marine Revolution (MMR). = origination rate; = extinction rate.
Stacked relative proportion (percentage of genera) of foraminiferal wall types throughout the Phanerozoic eon.
Figure 2.
Stacked relative proportion (percentage of genera) of foraminiferal wall types throughout the Phanerozoic Eon. Dark grey = calcareous; light grey = agglutinated; off-white = organic; transitions between calcite and aragonite seas are indicated at the top of the figure. Big Five mass extinction events [37], time scale, transitions between calcite and aragonite seas and Mesozoic Marine Revolution (MMR) all annotated as in figure 1.
Diversity of foraminifera throughout the Mesozoic and Cenozoic.
Figure 3.
Diversity of foraminifera throughout the Mesozoic and Cenozoic. White = planktic genera; dark grey = benthic genera. Mass extinction events [37], time scale, transitions between calcite and aragonite seas and Mesozoic Marine Revolution (MMR) all annotated as in figure 1; the dotted lines represent Cenozoic warming and cooling events (PETM = Palaeocene−Eocene Thermal Maximum; E-O = Eocene−Oligocene).
Bootstrap analysis for the origination rates and extinction rates of calcareous (dotted lines) and agglutinated (dashed lines) Foraminifera.
Figure 4.
Bootstrap analysis for the origination rates and extinction rates of calcareous (dotted lines) and agglutinated (dashed lines) foraminifera. (A) Expected (light orange shading) versus actual (dark orange dotted line) calcareous extinction rates, (B) expected (light blue shading) versus actual (dark blue dotted line) calcareous origination rates, (C) expected (light orange shading) versus actual (dark orange dashed line) agglutinated extinction rates and (D) expected (light blue shading) versus actual (dark blue dashed line) agglutinated origination rates. Vertical dashed lines indicate the Big Five mass extinction events [37]; the Phanerozoic time scale is at the bottom of the figure; transitions between calcite and aragonite seas are indicated at the top of the figure and the black gradient bar (middle) represents the approximate duration of the Mesozoic Marine Revolution (MMR). = origination rate; = extinction rate.
Generalized linear model (square-root link, Gamma variance) for wall-type origination and extinction rates during the Palaeozoic era and during the Mesozoic + Cenozoic eras.
Figure 5.
Generalized linear model (square-root link, Gamma variance) for wall-type origination and extinction rates during the Palaeozoic Era and during the Mesozoic + Cenozoic eras. (A) Regression (dark orange dotted line) and variance (light orange shading) of calcareous extinction rates, (B) regression (dark blue dotted line) and variance (light blue shading) of calcareous origination rates, (C) regression (dark orange dashed line) and variance (light orange shading) of agglutinated extinction rates and (D) regression (dark blue dashed line) and variance (light blue shading) of agglutinated origination rates; asterisk (*) = statistically significant correlation between interval and wall-type origination/extinction rate. Big Five mass extinction events [37], time scale, transitions between calcite and aragonite seas and Mesozoic Marine Revolution (MMR) all annotated as in figure 1.

Similar articles

References

    1. Knoll AH. 2003. Biomineralization and evolutionary history. Rev. Mineral. Geochem. 54, 329–356. (10.2113/0540329) - DOI
    1. Intergovernmental Panel On Climate Change (IPCC) . 2023. Climate change 2021—the physical science basis: Working Group I contribution to the sixth assessment report of the Intergovernmental Panel on Climate Change, 1st edn. Cambridge, UK: Cambridge University Press. (10.1017/9781009157896) - DOI
    1. Hönisch B, et al. . 2012. The geological record of ocean acidification. Science 335, 1058–1063. (10.1126/science.1208277) - DOI - PubMed
    1. Cornwall CE, et al. . 2021. Global declines in coral reef calcium carbonate production under ocean acidification and warming. Proc. Natl Acad. Sci. USA 118, e2015265118. (10.1073/pnas.2015265118) - DOI - PMC - PubMed
    1. Ridgwell A. 2005. A mid Mesozoic revolution in the regulation of ocean chemistry. Mar. Geol. 217, 339–357. (10.1016/j.margeo.2004.10.036) - DOI

LinkOut - more resources