. 2025 Apr;31(4):e70365.
doi: 10.1111/cns.70365.

Optimized Mouse Model of Sepsis-Associated Encephalopathy: A Rational Standard Based on Modified SHIRPA Score and Neurobehaviors in Mice

Affiliations

Optimized Mouse Model of Sepsis-Associated Encephalopathy: A Rational Standard Based on Modified SHIRPA Score and Neurobehaviors in Mice

Yuewen Xin et al. CNS Neurosci Ther. 2025 Apr.

Abstract

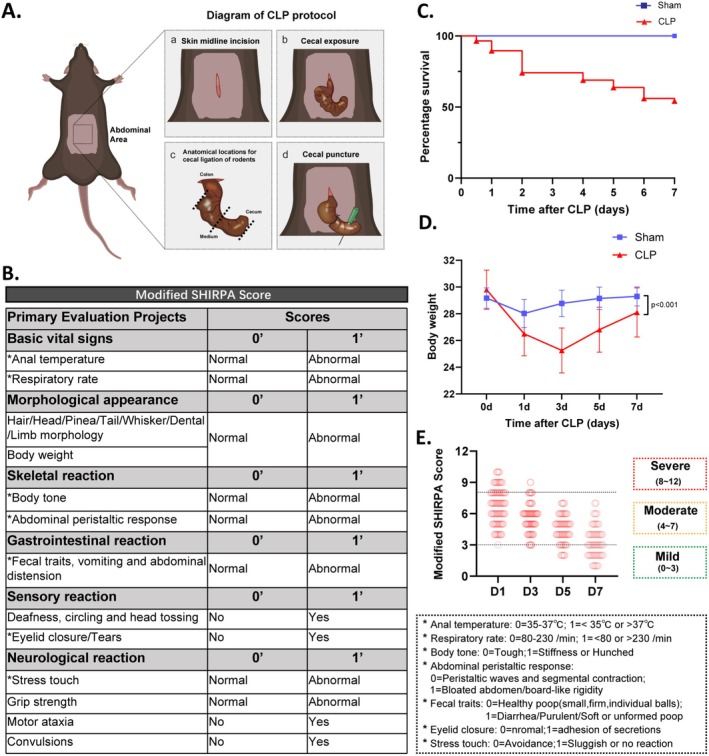
Background: Sepsis-associated encephalopathy (SAE), a severe neurological disorder, is marked by widespread brain dysfunction. At present, there is no universally accepted criterion for diagnosing SAE in animal models. This study proposes a standardized evaluation method for SAE in mice, addressing inconsistencies in current research.

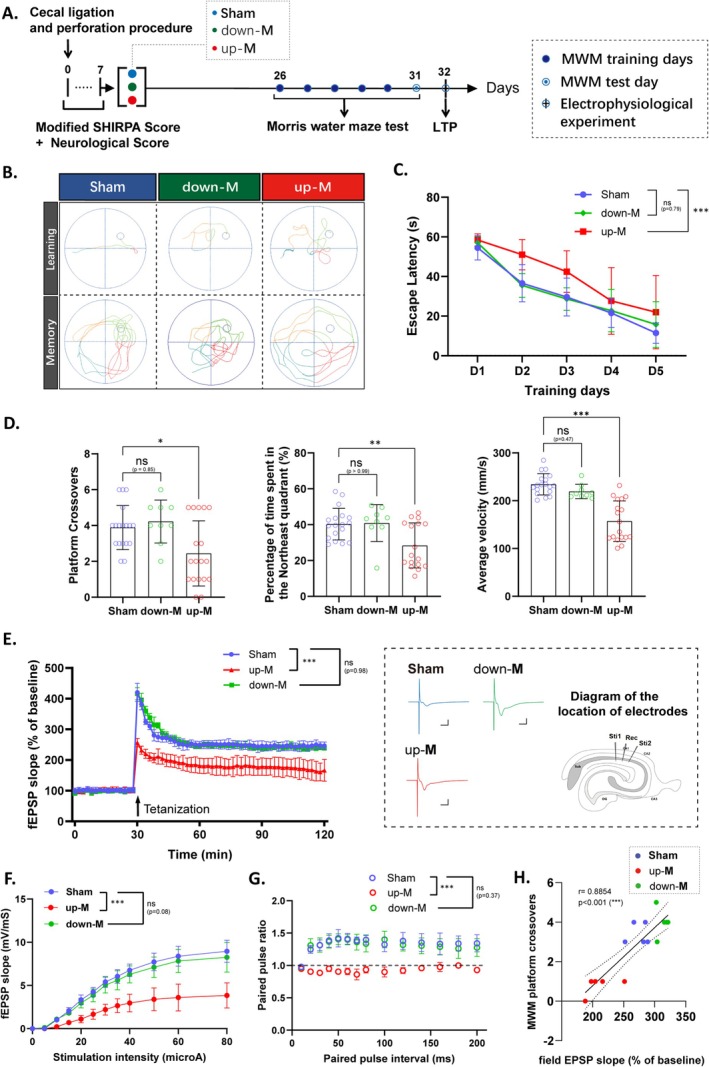
Method: Using a cecal ligation and puncture (CLP) model to induce sepsis, we assessed the physiological status of mice with a modified SHIRPA score to differentiate SAE from non-SAE, validating our findings through various behavioral tests and evaluations of neuroinflammation and neuronal damage.

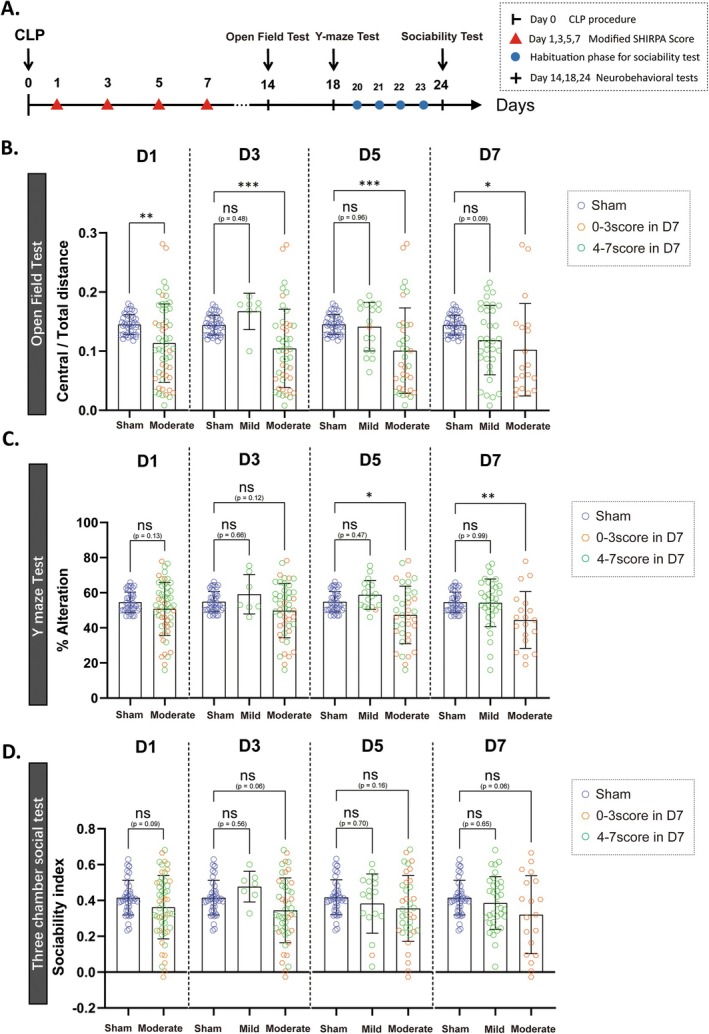
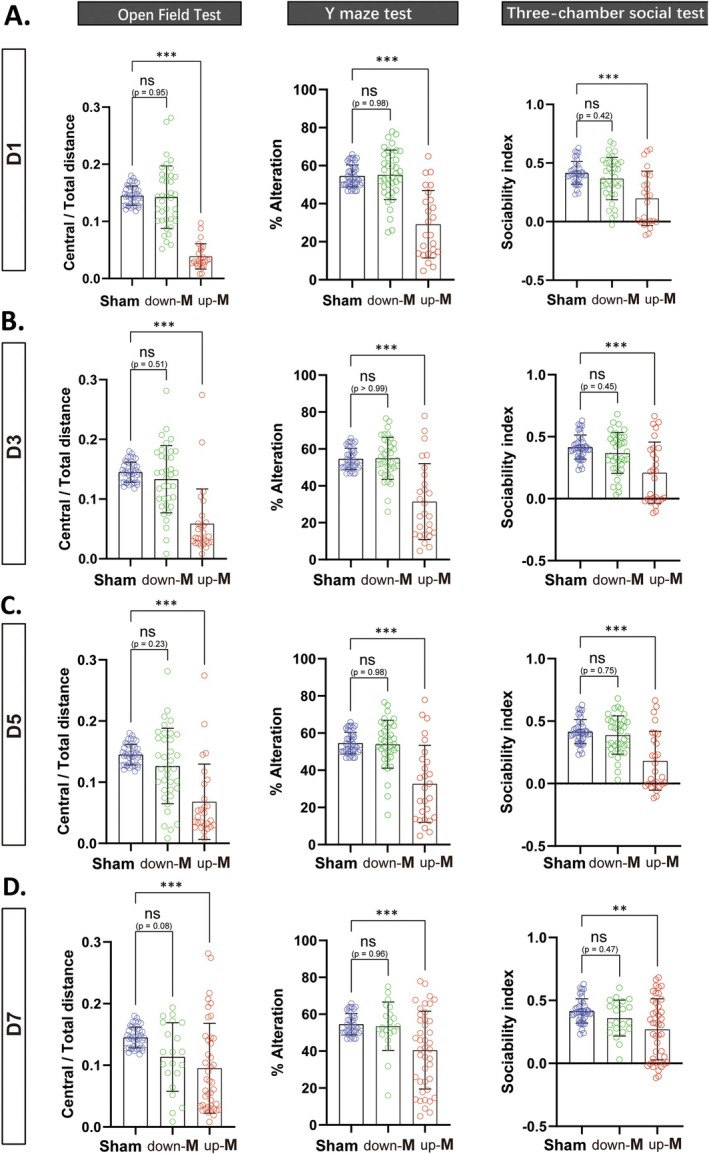
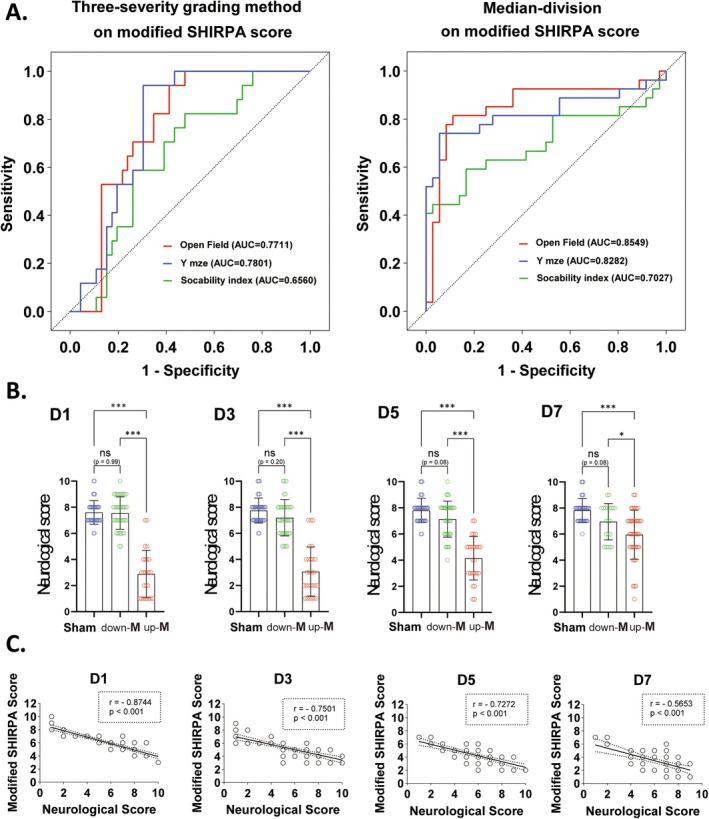
Results: Our findings revealed that the conventional mild-moderate-severe categorization of SHIRPA was insufficient for distinguishing between SAE and non-SAE. To enhance differentiation, we classified mice based on the median modified SHIRPA score, validating this approach through behavioral tests including the Y-maze, three-chamber social test, and open field test. This method effectively identified neurological impairments in septic mice. Further validation involved assessing neuronal damage, neuroinflammation, the Morris water maze, and long-term potentiation (LTP) in the hippocampal CA1 region. Results indicated that mice in the up-Median group exhibited greater neuroinflammation, neuronal injury, and cognitive deficits compared to the down-Median group.

Conclusions: This study establishes a reliable evaluation method for SAE in murine models, facilitating improved differentiation between SAE and non-SAE. Such advancements will enhance our understanding of the pathogenesis of SAE and guide more effective treatment strategies.

Keywords: behavioral tests; cognitive deficits; long‐term potentiation; modified SHIRPA score; sepsis‐associated encephalopathy.


Conflict of interest statement

The authors declare no conflicts of interest.

Figures

FIGURE 1
FIGURE 1
Modified SHIRPA Score, body weight, and the survival rate of CLP mice. (A) Schematic diagram of CLP surgery. (B) The modified SHIRPA scores protocol. (C) The survival rate within 7 days after CLP. (D) Body weight change in each group after CLP. (E) The modified SHIRPA scores on Days 1, 3, 5, and 7 following CLP. The SHIRPA score of 0–3, 4–7, and 8–12 was classified as the mild, moderate, and severe groups, respectively. All data are presented as the means ± SD. Data were analyzed using two‐way ANOVA followed by Tukey's multiple comparisons test (D), n = 40 in sham or n = 63 in CLP group.
FIGURE 2
FIGURE 2
Mild and Moderate CLP mice categorized according to modified SHIRPA score do NOT demonstrate memory deficits. (A) Time course of key time points and behavioral tests. (B) The ratio of central/total distance of CLP mice in open field test 14 days post‐CLP. (C) The alteration rate in Y maze test (18 days post‐CLP). (D) The sociability index of CLP mice in three‐chamber social test (24 days post‐CLP). All data are presented as the means ± SD. Data were analyzed using the unpaired two‐tailed Student's t‐test (D1 data set) or one‐way ANOVA follow by Tukey's multiple comparisons test (D3 to D7 data set), n = 40 in sham and n = 63 in CLP group, *p < 0.05, **p < 0.01, ***p < 0.001, ns, no significance, as indicated.
FIGURE 3
FIGURE 3
The new division method of the median of modified SHIRPA score demonstrated cognitive deficits in Up‐M group mice. The behavioral statistics (among open field test, Y maze test and three‐chamber social test were performed on Days 14, 18, and 24, respectively) in Sham, up‐M group, and down‐M group, defined by the median division on Day 1 (A), Day 3 (B), Day 5 (C), Day 7 (D) after CLP, respectively. All data are presented as the means ± SD. Data were analyzed using one‐way ANOVA followed by Tukey's multiple comparisons test, n = 40 in sham or n = 63 in CLP group, *p < 0.05, **p < 0.01, ***p < 0.001, ns, no significance, as indicated.
FIGURE 4
FIGURE 4
ROC curves and the neurological scores from the median division of the modified SHIRPA score validated its effectiveness in identifying neurological deficits in CLP mice. (A) (The left figure) When employing three‐severity grading method in the modified SHIRPA score, curve in red represents the performance in the open filed test (AUC = 0.7711), curve in blue represents the performance in the Y‐maze test (AUC = 0.7801), and curve in blue represents the performance in the three‐chamber social tests (AUC = 0.6560). (The right figure) When employing median‐division method in the modified SHIRPA score, curve in red represents the performance in the open filed test (AUC = 0.8549), curve in blue represents the performance in the Y‐maze test (AUC = 0.8282), and curve in blue represents the performance in the three‐chamber social tests (AUC = 0.7027). (B) The neurological scores of mice in different groups (sham, down‐M, and up‐M) from Day 1 to Day 7 post‐CLP, n = 40 in sham or n = 63 in CLP group. (C) Spearman correlation analysis of the modified SHIRPA score with the neurological scores at different Days 1, 3, 5 and 7 post‐CLP, respectively. r: Spearman correlation coefficient, n = 40 in sham or n = 63 in CLP group. All data are expressed as the means ± SD. Data were analyzed using the one‐way ANOVA followed by Tukey's multiple comparisons test, *p < 0.05, **p < 0.01, ***p < 0.001, ns, no significance, as indicated.
FIGURE 5
FIGURE 5
CLP induced neuronal death and microglia polarization in the region of the hippocampus and cortex of up‐M mice, but not in down‐M mice. (A) Representative fluorescent images of NeuN immunostaining and DAPI in the hippocampus CA1 (CA1) and cortex (CTX) area (scale bar = 50 μm). (B) Schematic representation of the CTX and CA1 regions in mouse brain slices. (C) Quantification of NeuN‐positive cells in the CA1 and CTX area. (D) Representative fluorescence images of CD16+Iba1+ and CD206+Iba1+ immunostaining in the CA1 and CTX area (scale bar = 40 μm). (E) Quantification of CD16+Iba1+ and CD206+Iba1+ cells in the CA1 area. (F) Quantification of CD16+Iba1+ and CD206+Iba1+ cells in the CTX area. All data are presented as the means ± SD. Data were analyzed using the one‐way ANOVA followed by Tukey's multiple comparisons test. n = 6/group, *p < 0.05, **p < 0.01, ***p < 0.001, ns: No significance, as indicated.
FIGURE 6
FIGURE 6
Impaired spatial learning/memory ability and LTP of hippocampus in the up‐M mice, but not in down‐M mice. (A) Schematic timeline of animal handling procedures concluding in the Morris water maze tests and electrophysiological experiments. (B) Representative swimming paths of the three groups during the training and memory test phases of the Morris water maze test. (C) The escape latency in the learning days, n = 18 in sham and n = 27 in CLP group. (D) The number of platform crossovers and the percentage of time spent in the target quadrant and the average speed of mice in the memory phase, n = 18 in sham or n = 27 in CLP group. (E) LTP was recorded on transversal hippocampal slices from different groups (Sham, down‐M, up‐M, n = 5/group). Time course of fEPSP recorded and plotted for every data point in the hippocampal CA1 region based on the average of four field potentials evoked by biphasic constant‐current pulses (0.1 ms/polarity) at 0.2 Hz in the Schaffer collateral region. The vertical arrow indicates the time point of tetanization. The colored example traces and the diagram of the location of electrodes matched with the LTP fEPSP scatter graph. (F) The input/output functions for stimulus intensity versus fEPSP slope for the different groups of CLP mice are presented (Sham, down‐M, up‐M, n = 5/group). (G) The paired pulse ratio for the CLP mice during the LTP procedure (Sham, down‐M, up‐M, n = 5/group). (H) Spearman correlation analysis between the Morris water maze main indicator and the field EPSP slope of LTP (Sham, down‐M, up‐M, n = 5/group). All data are presented as the means ± SD. Data were analyzed using the one‐way or two‐way ANOVA followed by Tukey's multiple comparisons test. *p < 0.05, **p < 0.01, ***p < 0.001, ns, no significance, as indicated.

Similar articles

References

    1. Markwart R., Saito H., Harder T., et al., “Epidemiology and Burden of Sepsis Acquired in Hospitals and Intensive Care Units: A Systematic Review and Meta‐Analysis,” Intensive Care Medicine 46, no. 8 (2020): 1536–1551. - PMC - PubMed
    1. Rudd K. E., Johnson S. C., Agesa K. M., et al., “Global, Regional, and National Sepsis Incidence and Mortality, 1990‐2017: Analysis for the Global Burden of Disease Study,” Lancet 395, no. 10219 (2020): 200–211. - PMC - PubMed
    1. Kingsley S. M. and Bhat B. V., “Differential Paradigms in Animal Models of Sepsis,” Current Infectious Disease Reports 18, no. 9 (2016): 26. - PubMed
    1. Buras J. A., Holzmann B., and Sitkovsky M., “Animal Models of Sepsis: Setting the Stage,” Nature Reviews. Drug Discovery 4, no. 10 (2005): 854–865. - PubMed
    1. Dejager L., Pinheiro I., Dejonckheere E., and Libert C., “Cecal Ligation and Puncture: The Gold Standard Model for Polymicrobial Sepsis?,” Trends in Microbiology 19, no. 4 (2011): 198–208. - PubMed

MeSH terms