

Identification of Cortical Targets for Modulating Function Supported by the Human Hippocampal Network
- PMID: 40202284
- PMCID: PMC11979967
- DOI: 10.1002/hbm.70167
Identification of Cortical Targets for Modulating Function Supported by the Human Hippocampal Network
Abstract
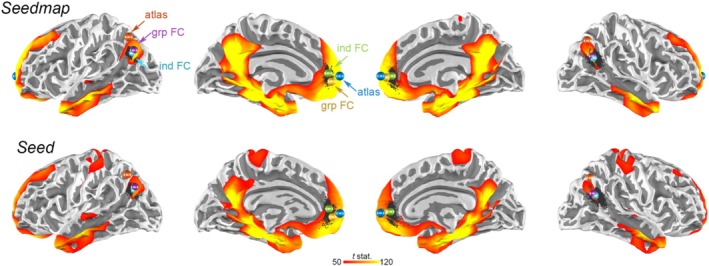
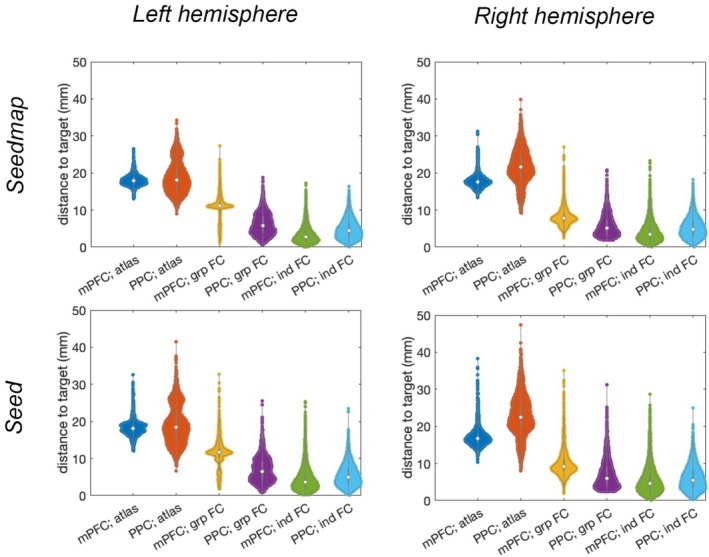
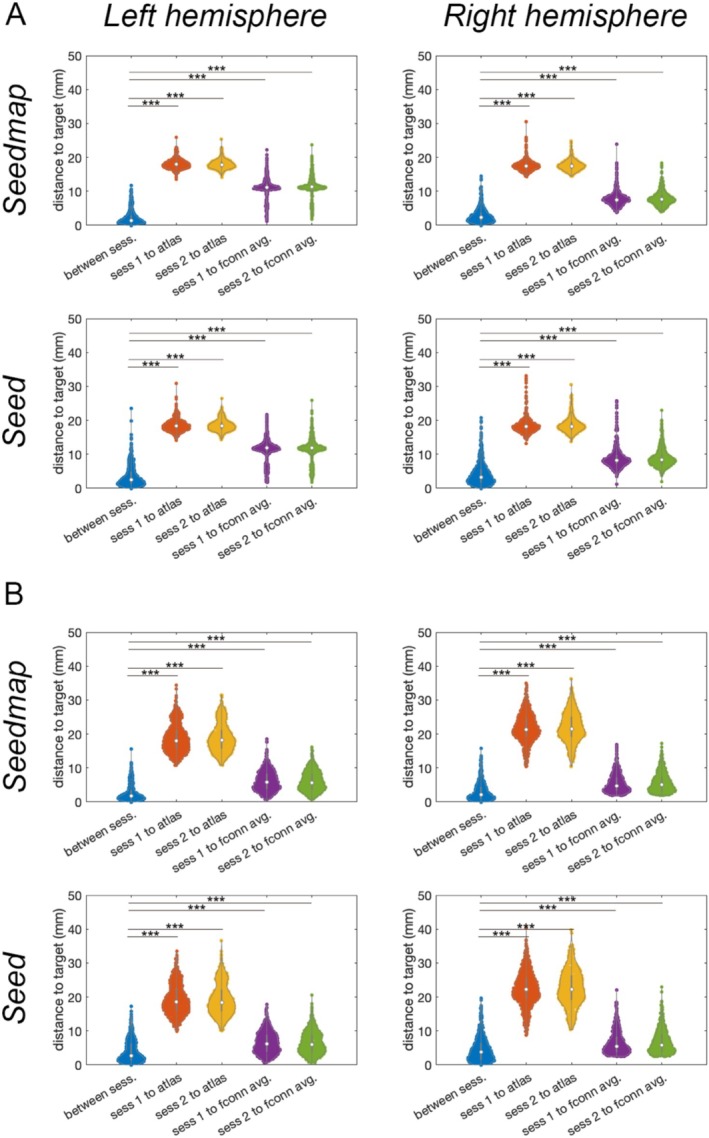
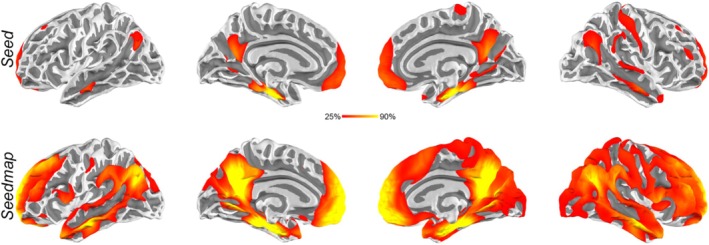
Individualized transcranial magnetic stimulation (TMS) targeting using functional connectivity analysis of functional magnetic resonance imaging (fMRI) has been demonstrated to be advantageous in inducing neuroplasticity. However, how this approach can benefit modulating the episodic memory function supported by the hippocampal network remains elusive. We use the resting-state fMRI data from a large cohort to reveal tentative TMS targets at cortical regions within the hippocampal network. Functional MRI from 1,133 individuals in the Human Connectome Project was used to analyze the hippocampal network using seed-based functional connectivity. Using a weighted sum of time series at the cortex, we identified the average centroids of individualized targets at the medial prefrontal cortex (mPFC) and posterior parietal cortices (PPCs) at (-10, 49, 7) and (-40, -67, 30) in the left hemisphere, respectively. The mPFC and PPC coordinate at the right hemispheres are (11, 51, 6) and (48, -59, 24) in the right hemisphere, respectively. Centroids of the individualized functional connectivity at the mPFC and PPC were reproducible between sessions with separations in average about 2 and 4 mm, respectively. These separations were significantly smaller than the distance to average functional connectivity centroids (~10 mm) and atlas coordinate (~20 mm). These coordinates can be reliably identified (> 90% of individuals) using cortical "seedmaps." Our results suggest candidate TMS target coordinates to modulate the hippocampal function.
© 2025 The Author(s). Human Brain Mapping published by Wiley Periodicals LLC.
Conflict of interest statement
The authors declare no conflicts of interest.
Figures
Similar articles
-
Frequency-specific noninvasive modulation of memory retrieval and its relationship with hippocampal network connectivity.Hippocampus. 2019 Jul;29(7):595-609. doi: 10.1002/hipo.23054. Epub 2018 Dec 11. Hippocampus. 2019. PMID: 30447076 Free PMC article.
-
Spread of activity following TMS is related to intrinsic resting connectivity to the salience network: A concurrent TMS-fMRI study.Cortex. 2018 Nov;108:160-172. doi: 10.1016/j.cortex.2018.07.010. Epub 2018 Jul 30. Cortex. 2018. PMID: 30195825
-
Multiple parietal pathways are associated with rTMS-induced hippocampal network enhancement and episodic memory changes.Neuroimage. 2021 Aug 15;237:118199. doi: 10.1016/j.neuroimage.2021.118199. Epub 2021 May 24. Neuroimage. 2021. PMID: 34033914 Free PMC article.
-
Anterior-temporal hippocampal network mechanisms of left angular gyrus-navigated rTMS for memory improvement in aMCI: A sham-controlled study.Behav Brain Res. 2024 Aug 5;471:115117. doi: 10.1016/j.bbr.2024.115117. Epub 2024 Jun 20. Behav Brain Res. 2024. PMID: 38908485
-
Investigating resting-state functional connectivity of the human hand motor system: an offline TMS-fMRI study.Neuroimage. 2025 Jul 1;314:121254. doi: 10.1016/j.neuroimage.2025.121254. Epub 2025 May 6. Neuroimage. 2025. PMID: 40339631
References
-
- Bergmann, T. O. , Varatheeswaran R., Hanlon C. A., Madsen K. H., Thielscher A., and Siebner H. R.. 2021. “Concurrent TMS‐fMRI for Causal Network Perturbation and Proof of Target Engagement.” NeuroImage 237: 118093. - PubMed
-
- Berkers, R. M. W. J. , van der Linden M., de Almeida R. F., et al. 2017. “Transient Medial Prefrontal Perturbation Reduces False Memory Formation.” Cortex 88: 42–52. - PubMed
-
- Cash, R. F. H. , and Zalesky A.. 2024. “Personalized and Circuit‐Based Transcranial Magnetic Stimulation: Evidence, Controversies, and Opportunities.” Biological Psychiatry 95: 510–522. - PubMed
MeSH terms
Grants and funding
LinkOut - more resources
Full Text Sources
