. 2025 May 20;99(5):e0049025.
doi: 10.1128/jvi.00490-25. Epub 2025 Apr 9.

CPSF6 promotes HIV-1 preintegration complex function

Affiliations

CPSF6 promotes HIV-1 preintegration complex function

Evan Chaudhuri et al. J Virol. .

Abstract

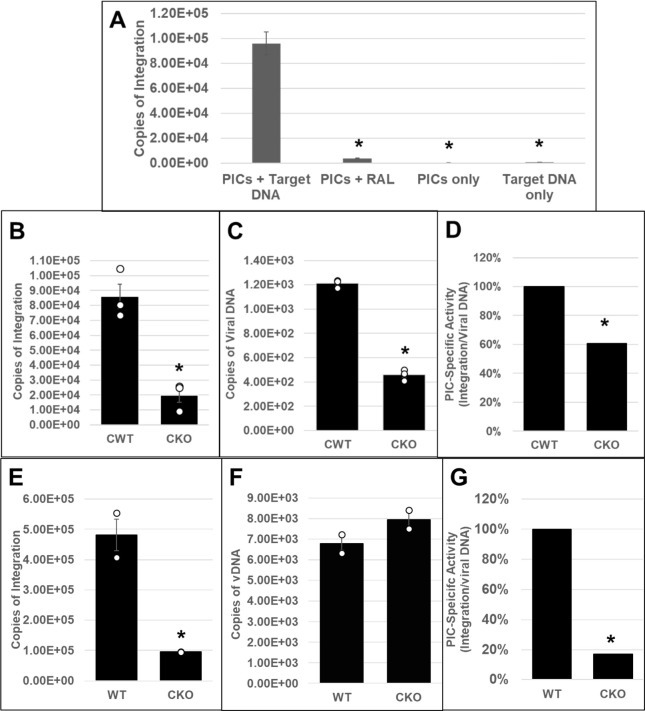
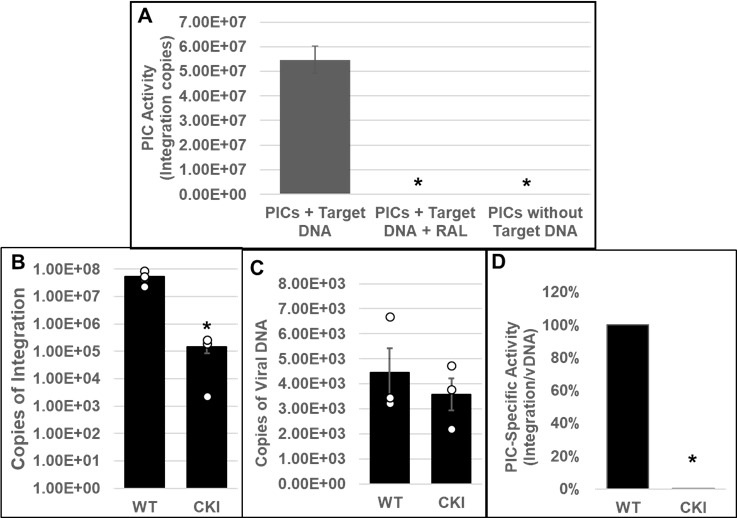
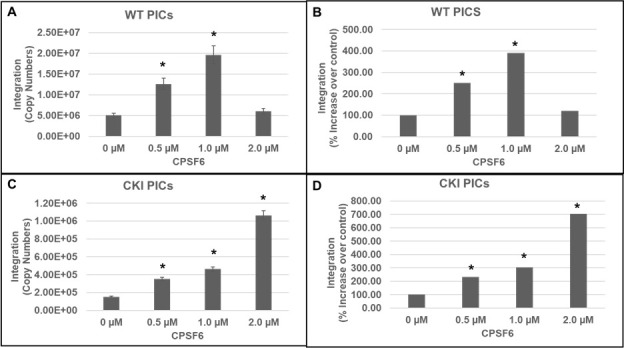
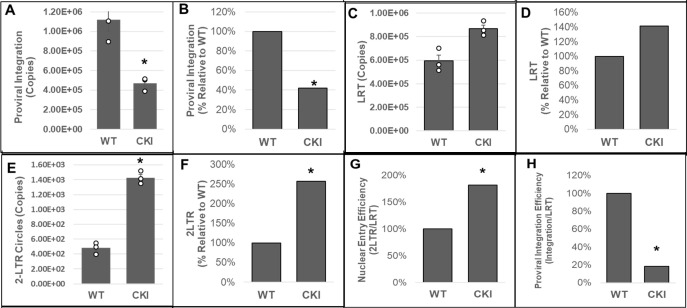
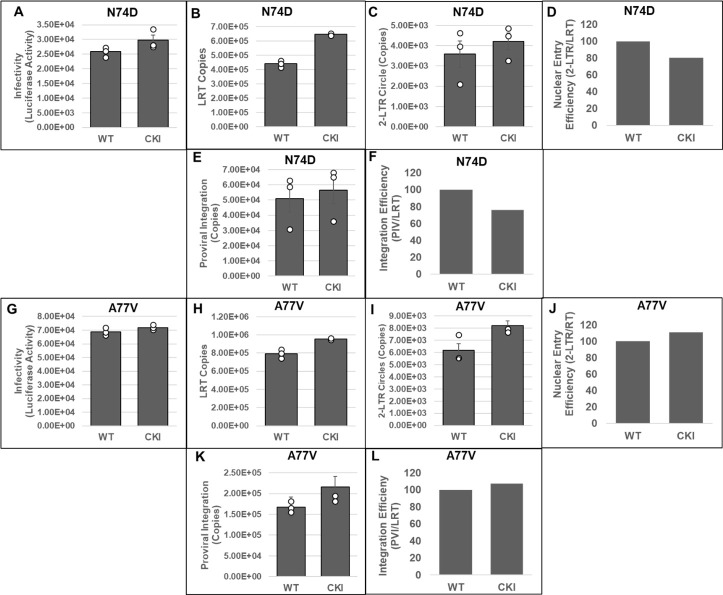
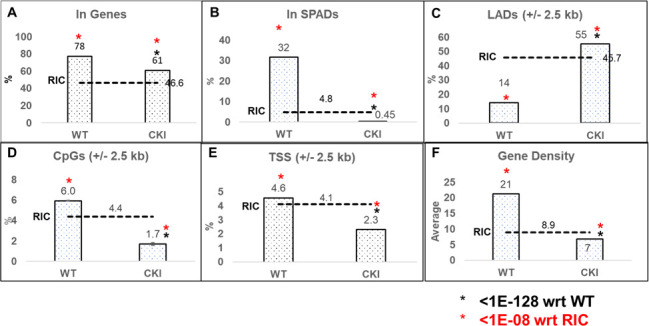
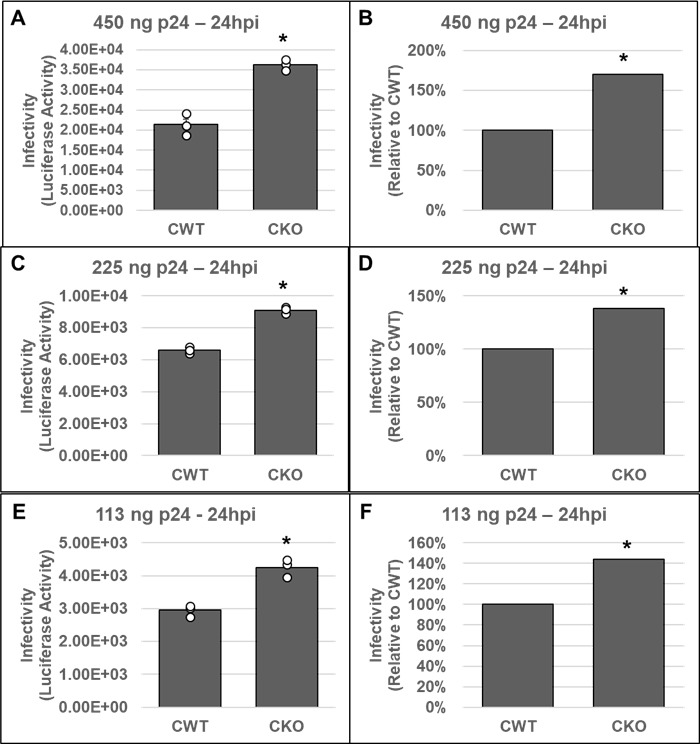
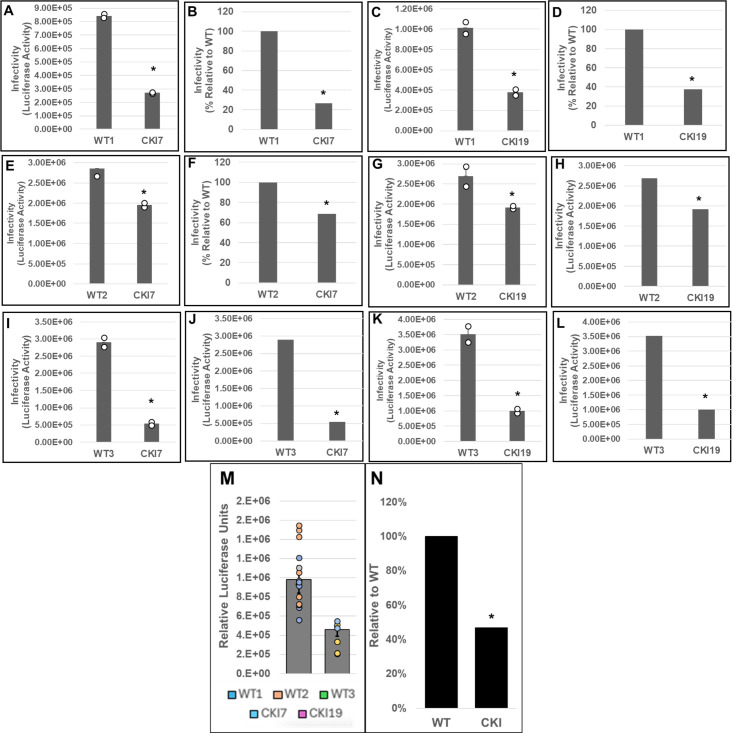
Cleavage and polyadenylation specificity factor 6 (CPSF6) is part of the cellular cleavage factor I mammalian (CFIm) complex that regulates mRNA processing and polyadenylation. CPSF6 also functions as an HIV-1 capsid (CA) binding host factor to promote viral DNA integration targeting into gene-dense regions of the host genome. However, the effects of CPSF6 on the activity of the HIV-1 preintegration complex (PIC)-the sub-viral machinery that carries out viral DNA integration-are unknown. To study CPSF6's role in HIV-1 PIC function, we extracted PICs from cells that are either depleted of CPSF6 or express a mutant form that cannot bind to CA. These PICs exhibited significantly lower viral DNA integration activity when compared to the control PICs. The addition of purified recombinant CPSF6 restored the integration activity of PICs extracted from the CPSF6-mutant cells, suggesting a direct role of CPSF6 in PIC function. To solidify CPSF6's role in PIC function, we inoculated CPSF6-depleted and CPSF6-mutant cells with HIV-1 particles and measured viral DNA integration into the host genome. A significant reduction in integration in these cells was detected, and this reduction was not a consequence of lower reverse transcription or nuclear entry. Additionally, mutant viruses deficient in CA-CPSF6 binding showed no integration defect in CPSF6-mutant cells. Finally, sequencing analysis revealed that HIV-1 integration into CPSF6-mutant cell genomes was significantly redirected away from gene-dense regions of chromatin compared to the control cells. Collectively, these results suggest that the CPSF6-CA interaction promotes PIC function both in vitro and in infected cells.IMPORTANCEHIV-1 infection is dependent on the interaction of the virus with cellular host factors. However, the molecular details of HIV-host factor interactions are not fully understood. For instance, the HIV-1 capsid provides binding interfaces for several host factors. CPSF6 is one such capsid-binding host factor, whose cellular function is to regulate mRNA processing and polyadenylation. Initial work identified a truncated cytosolic form of CPSF6 to restrict HIV infection by blocking viral nuclear entry. However, it is now established that the full-length CPSF6 primarily promotes HIV-1 integration targeting into gene-dense regions of the host genome. Here, we provide evidence that CPSF6-CA interaction stimulates the activity of HIV-1 preintegration complexes (PICs). We also describe that disruption of CPSF6-CA binding in target cells significantly reduces viral DNA integration and redirects integration targeting away from gene-dense regions into regions of low transcriptional activity. These findings identify a critical role for the CPSF6-CA interaction in PIC function and integration targeting.

Keywords: capsid; cleavage and polyadenylation specificity factor 6 (CPSF6); human immunodeficiency virus (HIV); integration; preintegration complex.


Conflict of interest statement

J.H. has received research support, paid to Northwestern University, from Gilead Sciences and is a paid consultant for Merck and Ridgeback Therapeutics.

Figures

Fig 1
Fig 1
Effect of CPSF6 depletion on HIV-1 PIC integration activity in vitro. (A–D) HEK293T CPSF6 WT (CWT) and CKO cells were spinoculated with 450 ng p24 virus/million cells as described in Materials and Methods. PICs were extracted, and in vitro integration reactions were carried out using phi-X174 target DNA. Reactions in the presence of the IN inhibitor RAL or in the absence of the target DNA served as controls. A nested qPCR-based approach was utilized to measure the integration activity of the PICs. (A) Assessment and verification of PIC integration activity. (B) Comparison of in vitro integration activity of PICs extracted from CWT or CKO cells. (C) Copies of PIC-associated viral DNA determined via qPCR. (D) PIC-specific activity normalized to the amount of viral DNA in the different preps (integration/viral DNA). Specific activity is displayed as percentage relative to CWT cell PICs. (E–G) PIC activity from CKO and WT HeLa cells. (E) PIC-associated integration activity. (F) Viral DNA content of the PICs. (G) Specific PIC activity. White circles in graphs represent separate biological replicates. Error bars represent SEM. The P-values (*) represent statistical significance (P < 0.05) between control and CKO PICs.
Fig 2
Fig 2
Effect of disrupting the CPSF6–CA interaction on the in vitro integration activity of HIV-1 PICs. (A) Parental WT SupT1 cells or CKI cells were spinoculated with high titer infectious HIV-1 particles (1,500 ng p24/mL) and cultured for 5 h followed by extraction of PIC-containing cytoplasmic extracts. In vitro assays using these PICs as the source of integration activity and quantification of viral DNA integration into an exogenous target DNA by nested PCR were carried out with appropriate controls. (B) In vitro integration assays of PICs extracted from WT1 and from CKI cells were carried out, and the copy numbers of integrated viral DNAs were determined. (C) Viral DNA copy numbers were quantified by qPCR. (D) The specific activity of the PIC-mediated integration was determined by calculating the ratio of integrated viral DNA copy numbers (from panel B) to the corresponding PIC-associated viral DNA copy numbers (from panel C). Mean values from two independent experiments, each conducted in triplicate, are shown with error bars representing the SEM. White circles present in graphs represent individual data points. The P-values (*) represent statistical significance (P < 0.05) between the control and CKI PICs.
Fig 3
Fig 3
Effects of CPSF6 protein on PIC-associated integration activity. In vitro integration activity of PICs extracted from WT control cells (A and B) and from CKI cells (C and D) was assessed in the absence or presence of varying concentrations (0 µM–2 µM) of purified recombinant CPSF6 protein. (A and C) The copy number of the integrated viral DNAs was determined by nested qPCR. (B and D) Integration activity plotted as fold change relative to the integration activity of the respective control PICs. Mean values from two independent experiments, each conducted with triplicate samples, are shown with error bars representing the SEM. The P-values (*) represent statistical significance (P < 0.05) relative to untreated PICs (0 µM).
Fig 4
Fig 4
Disruption of the CPSF6–CA interaction blocks HIV-1 integration. (A and B) Integrated viral DNA was quantified by Alu-gag nested PCR using the total DNA extracted from infected CKI and WT control cells. Copy numbers were calculated from standard curves generated in parallel of known copy numbers (100 to 108) of an HIV-1 molecular clone during the second-round qPCR. (A) Copies of proviral integrants and (B) percentage of integrants relative to WT1 control cells. (C and D) Copies of late reverse transcription (LRT) products were measured by qPCR using a standard curve generated with known copy numbers of an HIV-1 molecular clone. (C) Copies of LRT and (D) percentage of LRT relative to the WT1 control cells. (E and F) 2-LTR circles were quantified from standard curves generated in parallel using known copy numbers of the p2LTR plasmid. (E) Copies of 2-LTR circles and (F) percentage of 2-LTR circles relative to the WT1 control cells. (G) A ratio of 2-LTR circles to LRT copies was calculated and plotted as relative percentage to the WT control cells. (H) A ratio of integration copies-to-LRT was calculated and plotted as relative percentage to the WT control cells. Data are mean values from three independent experiments, each conducted in triplicate with error bars representing the SEM. The P-values (*) represent statistical significance (P < 0.05) between the control and CKI cells. White circles present in graphs represent individual data points.
Fig 5
Fig 5
Measurement of early infection steps of HIV-1 CA mutant viruses disrupted for CPSF6 binding. (A and G) Infectivity measurements. WT and CKI clones inoculated with WT CA or mutant CA HIV-1 particles (N74D, panels A–F, and A77V, panels G–L) were cultured for 24 h, and luciferase activity was measured in the cellular lysates. (B and H) Quantification of LRT copies as a measure of reverse transcription. (C and I) Quantification of 2-LTR circle copies as a measure of nuclear entry. (D and J) Normalized levels of nuclear entry. (E and K) Integrated viral DNA copies were quantified by Alu-gag nested PCR assay as described in Fig. 1. (F and L) A ratio of the copies of proviral integration to LRT copies as a measure of integration efficiency. Data are plotted as relative percentage to the WT control cells. Data are mean values from at least three independent experiments, each conducted in triplicate with error bars representing the SEM. White circles present in graphs represent individual data points.
Fig 6
Fig 6
Disruption of CPSF6–CA Interaction retargets HIV-1 DNA away from SPADs and into LADs. Integration into (A) genes and (B) SPADs was scored as within these genomic coordinates. For (C) LADs, (D) CpG islands, and (E) TSSs, sites were mapped within ±2.5 kb windows (5 kb surrounding these coordinates). (F) Gene density within the 500 kb surrounding integration sites. Gene density was assessed as the number of genes per Mb. RICs were generated by shearing hg19 in silico using the restriction enzyme sites used to generate the wet bench samples and then mapping the resultant fragments with respect to the aforementioned genomic annotations. The P-values (*) represent statistical significance with respect to (wrt) WT cells (black asterisks; <10−128) and matched RIC values (red asterisks; <10−8).
Fig 7
Fig 7
Effects of CPSF6 depletion on HIV-1 infectivity. CKO and control HEK293T (CWT) cell lines were inoculated with three different concentrations of pseudotyped HIV-1.Luc virus as described in Materials and Methods; the total infection time course was 24 h. Cell pellets were then collected and subjected to infectivity evaluation by measurement of luciferase activity. Infectivity is displayed as both luciferase activity (A, C, E) and as a percentage relative to the luciferase activity of the corresponding CWT control (B, D, F). Three virus concentrations included (A, B) 450 ng p24, (C, D) 225 ng p24, and (E, F) 113 ng p24. Data are representative of three independent experiments, each conducted in triplicate with error bars representing the SEM. The P-values (*) represent statistical significance (P < 0.05) in CWT and CKO cells. White circles present in graphs represent individual data points.
Fig 8
Fig 8
Effects of disrupting the CPSF6–CA interaction on HIV-1 infection at 24 hpi. WT cell lines WT1 (A–D), WT2 (E–H), and WT3 (I–L) and CKI SupT1 cell lines CKI7 (A, B; E, F; and I, J) and CKI19 (C, D; G, H; and K, L) were spinoculated with 450 ng p24 of pseudotyped HIV-1.Luc reporter particles. The total infection time course was 24 h, and luciferase activity was measured in the cellular lysates as an indicator of infectivity (panels A, C, E, G, I, and K). Infectivity data were also plotted as percent infectivity relative to respective control clones (panels B, D, F, H, J, and L). Data shown are mean values from three independent experiments, each conducted in triplicate. (M) Infectivity values sorted by editing treatment (CPSF6 non-edited vs edited). Colored circles represent individual data points from corresponding cell line. (N) Aggregate infectivity as a percent relative to WT. Error bars represent the SEM, and the P-values (*) represent statistical significance (P < 0.05) between the control and CKI cells.
Fig 9
Fig 9
Effects of disrupting the CPSF6–CA interaction on HIV-1 infection at 48 hpi. These data are identical to Fig. 8, except that the infection time course was for 48 h. (A, C, E, G, I, and K) luciferase activity; (B, D, F, H, J, and L) percent infectivity relative to respective control clones. (M) Infectivity values sorted by editing treatment (CPSF6 non-edited vs edited). Colored circles represent individual data points from corresponding cell line. (N) Aggregate infectivity as a percent relative to WT. Data shown are mean values from three independent experiments, each conducted in triplicate. Error bars represent the SEM, and the P-values (*) represent statistical significance (P < 0.05) between the control and CKI cells.

Similar articles

References

    1. van Schalkwyk C, Mahy M, Johnson LF, Imai-Eaton JW. 2024. Updated data and methods for the 2023 UNAIDS HIV estimates. J Acquir Immune Defic Syndr 95:e1–e4. doi:10.1097/QAI.0000000000003344 - DOI - PMC - PubMed
    1. Ostrowski MA, Chun TW, Justement SJ, Motola I, Spinelli MA, Adelsberger J, Ehler LA, Mizell SB, Hallahan CW, Fauci AS. 1999. Both memory and CD45RA+/CD62L+ naive CD4(+) T cells are infected in human immunodeficiency virus type 1-infected individuals. J Virol 73:6430–6435. doi:10.1128/JVI.73.8.6430-6435.1999 - DOI - PMC - PubMed
    1. Brenchley JM, Hill BJ, Ambrozak DR, Price DA, Guenaga FJ, Casazza JP, Kuruppu J, Yazdani J, Migueles SA, Connors M, Roederer M, Douek DC, Koup RA. 2004. T-cell subsets that harbor human immunodeficiency virus (HIV) in vivo: implications for HIV pathogenesis. J Virol 78:1160–1168. doi:10.1128/jvi.78.3.1160-1168.2004 - DOI - PMC - PubMed
    1. Le Douce V, Herbein G, Rohr O, Schwartz C. 2010. Molecular mechanisms of HIV-1 persistence in the monocyte-macrophage lineage. Retrovirology (Auckl) 7:32. doi:10.1186/1742-4690-7-32 - DOI - PMC - PubMed
    1. Sonza S, Mutimer HP, Oelrichs R, Jardine D, Harvey K, Dunne A, Purcell DF, Birch C, Crowe SM. 2001. Monocytes harbour replication-competent, non-latent HIV-1 in patients on highly active antiretroviral therapy. AIDS 15:17–22. doi:10.1097/00002030-200101050-00005 - DOI - PubMed

Substances

LinkOut - more resources