

Investigating the gut bacteria structure and function of hibernating bats through 16S rRNA high-throughput sequencing and culturomics
- PMID: 40202348
- PMCID: PMC12090805
- DOI: 10.1128/msystems.01463-24
Investigating the gut bacteria structure and function of hibernating bats through 16S rRNA high-throughput sequencing and culturomics
Abstract
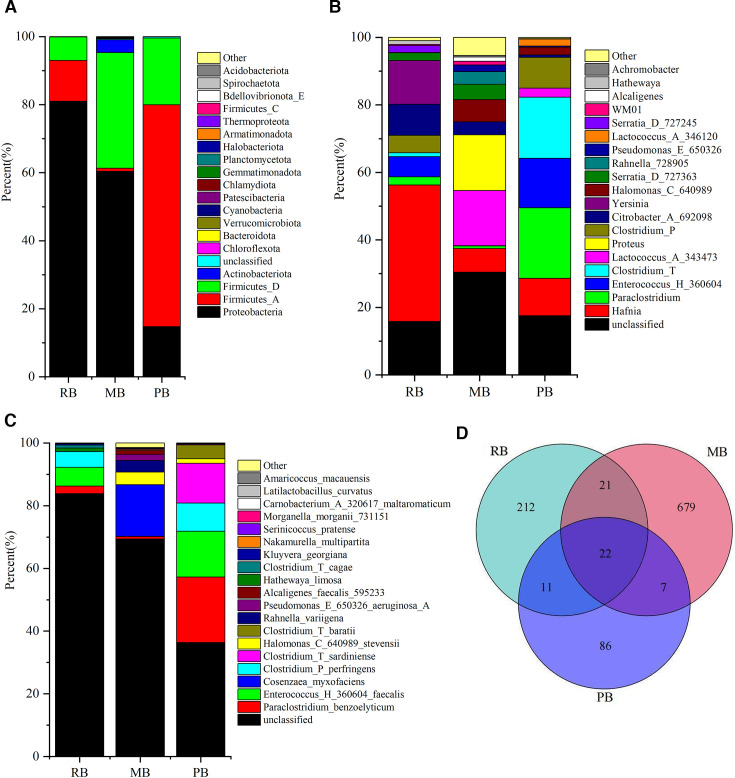
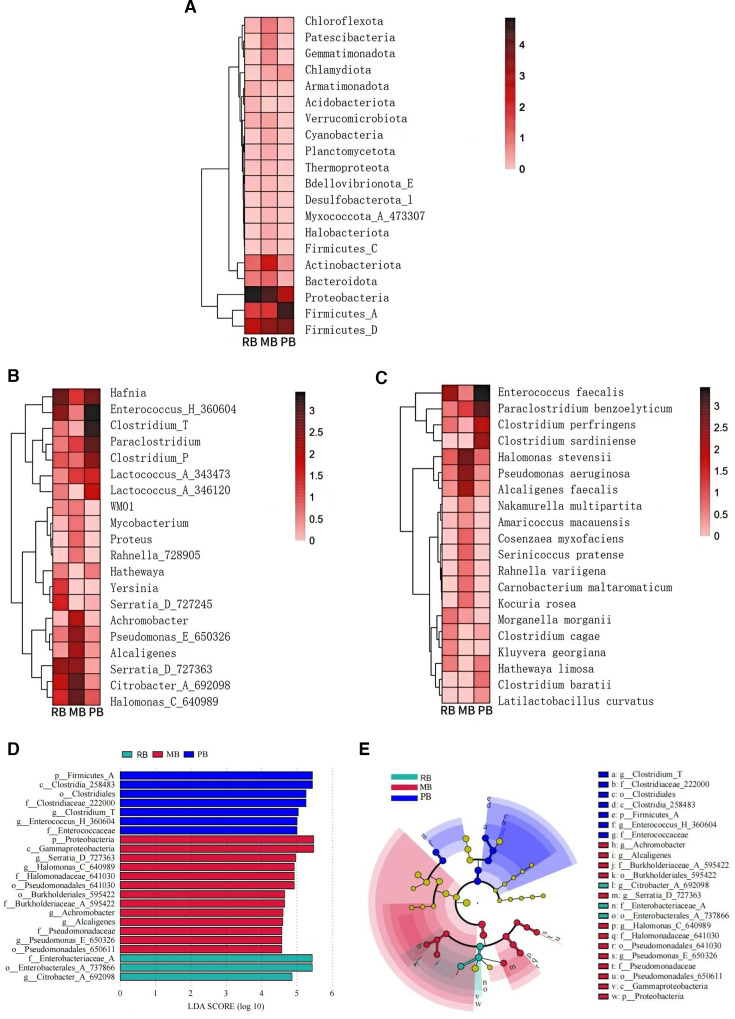
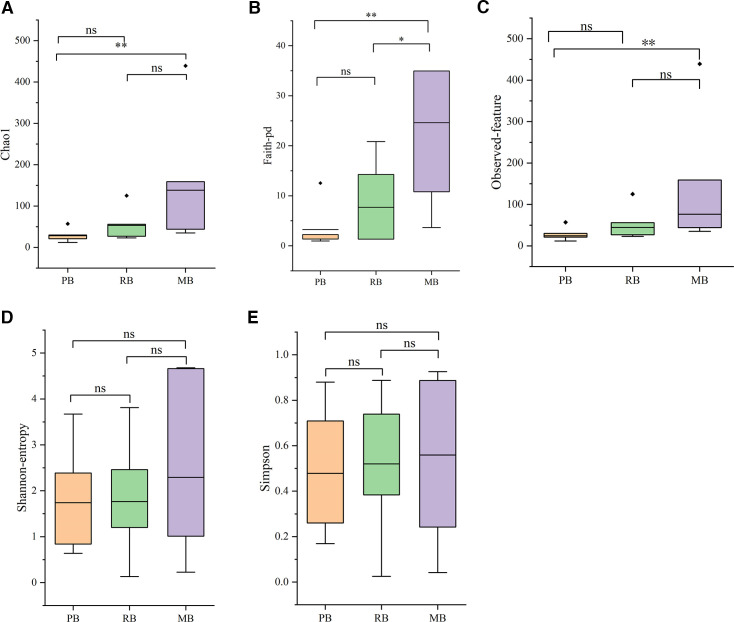
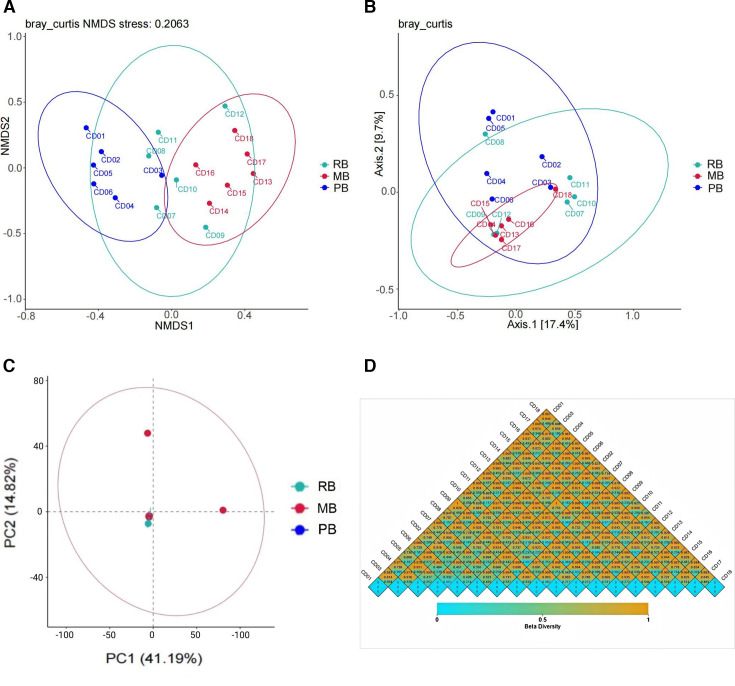
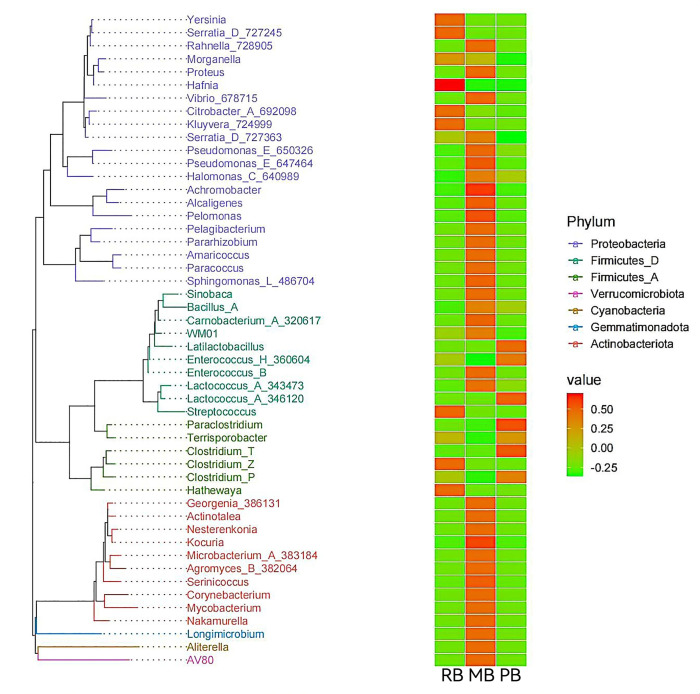
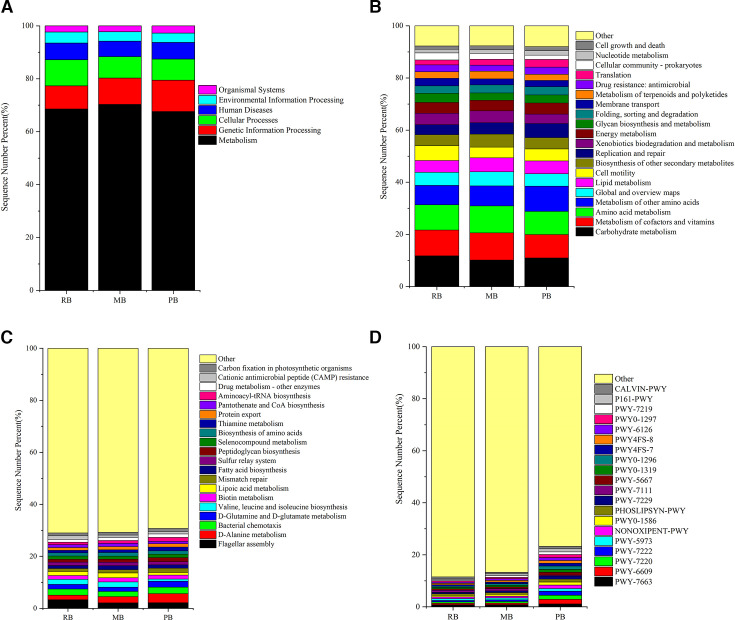
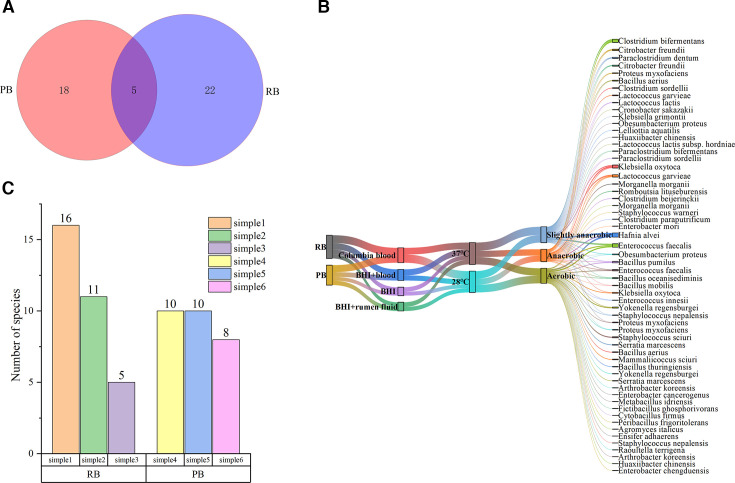
The gut microbiota of bats is vital for their roles in health and the ecosystem, yet studies on hibernating bats in southwest China, particularly in the unique karst landscape of Guizhou, are limited. We captured three hibernating bat species-Pipistrellus (PB), Rhinolophus (RB), and Myotis (MB)-in Liping County, collecting rectal samples for 16S rRNA amplicon sequencing. Data processing involved Trimmomatic, Flash, and Qiime2 for operational taxonomic unit (OTU) standardization and species annotation via the Greengenes database. Differential abundance was analyzed using LEfSe, and diversity metrics were assessed through alpha and beta diversity analyses. The RB group was predominantly composed of Proteobacteria (80.99%), while MB and PB exhibited diverse compositions with significant OTU richness (729 in MB). Notable genera included Hafnia and Yersinia in RB and Cosenzaea myxofaciens in MB. High proportions of unclassified taxa were observed, particularly in RB (83.81%). Functional predictions indicated metabolic pathways, with a significant representation of human diseases in PB. Culturomics revealed the successful cultivation of Huaxiibacter chinensis and Enterobacter chengduensis from bats for the first time and appears to have identified a new bacterium that is likely closely related to Clostridium paraputrificum.IMPORTANCEOur research reveals significant differences in the composition and diversity of the gut microbiota among three bat groups (PB, MB, and RB) from Guizhou. While Proteobacteria predominates in all groups, its abundance varies. Notably, the high richness of operational taxonomic units (OTUs) in the MB group suggests a more diverse microbial ecosystem, underscoring the complex interactions between species diversity, diet, gut microbiota, and overall ecological dynamics in bats. Furthermore, the substantial presence of unknown bacterial species in their intestines highlights the critical importance of cultivation-based approaches. The presence of specific taxa may have potential health implications for both bats and humans. These findings emphasize the need for further investigations into the functional roles of these microbiota and their contributions to host health. Future research should focus on longitudinal studies to elucidate these intricate interactions.
Keywords: 16S rRNA; culturomics; gut bacteria; hibernating bats; high-throughput sequencing.
Conflict of interest statement
The authors declare no conflict of interest.
Figures
Similar articles
-
The role of host traits and geography in shaping the gut microbiome of insectivorous bats.mSphere. 2024 Apr 23;9(4):e0008724. doi: 10.1128/msphere.00087-24. Epub 2024 Mar 21. mSphere. 2024. PMID: 38509042 Free PMC article.
-
The Threat of Potentially Pathogenic Bacteria in the Feces of Bats.Microbiol Spectr. 2022 Dec 21;10(6):e0180222. doi: 10.1128/spectrum.01802-22. Epub 2022 Oct 26. Microbiol Spectr. 2022. PMID: 36287057 Free PMC article.
-
Effects of Microhabitat Temperature Variations on the Gut Microbiotas of Free-Living Hibernating Animals.Microbiol Spectr. 2023 Aug 17;11(4):e0043323. doi: 10.1128/spectrum.00433-23. Epub 2023 Jun 28. Microbiol Spectr. 2023. PMID: 37378560 Free PMC article.
-
Enrichment of beneficial bacteria in the skin microbiota of bats persisting with white-nose syndrome.Microbiome. 2017 Sep 5;5(1):115. doi: 10.1186/s40168-017-0334-y. Microbiome. 2017. PMID: 28870257 Free PMC article.
-
Taxonomic annotation of 16S rRNA sequences of pig intestinal samples using MG-RAST and QIIME2 generated different microbiota compositions.J Microbiol Methods. 2021 Jul;186:106235. doi: 10.1016/j.mimet.2021.106235. Epub 2021 May 8. J Microbiol Methods. 2021. PMID: 33974954
Cited by
-
Identification and Pathogenicity Analysis of Huaxiibacter chinensis Qf-1 in Mink (Neogale vison).Microorganisms. 2025 Jul 8;13(7):1604. doi: 10.3390/microorganisms13071604. Microorganisms. 2025. PMID: 40732113 Free PMC article.
References
-
- Castelo-Branco D, Nobre JA, Souza PRH, Diógenes EM, Guedes GMM, Mesquita FP, Souza PFN, Rocha MFG, Sidrim JJC, Cordeiro RA, Montenegro RC. 2023. Role of Brazilian bats in the epidemiological cycle of potentially zoonotic pathogens. Microb Pathog 177:106032. doi:10.1016/j.micpath.2023.106032 - DOI - PubMed
MeSH terms
Substances
LinkOut - more resources
Full Text Sources
Miscellaneous
