. 2025 Apr 7;17(4):960-981.
doi: 10.18632/aging.206237. Epub 2025 Apr 7.

Pharmacological recapitulation of the lean phenotype induced by the lifespan-extending sulfur amino acid-restricted diet

Affiliations

Pharmacological recapitulation of the lean phenotype induced by the lifespan-extending sulfur amino acid-restricted diet

Naidu B Ommi et al. Aging (Albany NY). .

Abstract

Sulfur amino acid restriction (SAAR), lowering the dietary concentration of sulfur amino acids methionine and cysteine, induces strong anti-obesity effects in rodents. Due to difficulties in formulating the SAAR diet for human consumption, its translation is challenging. Since our previous studies suggest a mechanistic role for low glutathione (GSH) in SAAR-induced anti-obesity effects, we investigated if the pharmacological lowering of GSH recapitulates the lean phenotype in mice on a sulfur amino acid-replete diet. Male obese C57BL6/NTac mice were fed high-fat diets with 0.86% methionine (CD), 0.12% methionine (SAAR), SAAR diet supplemented with a GSH biosynthetic precursor, N-acetylcysteine in water (NAC), and CD supplemented with a GSH biosynthetic inhibitor, DL-buthionine-(S, R)-sulfoximine in water (BSO). The SAAR diet lowered hepatic GSH but increased Nrf2, Phgdh, and serine. These molecular changes culminated in lower hepatic lipid droplet frequency, epididymal fat depot weights, and body fat mass; NAC reversed all these changes. BSO mice exhibited all SAAR-induced changes, with two notable differences, i.e., a smaller effect size than that of the SAAR diet and a higher predilection for molecular changes in kidneys than in the liver. Metabolomics data indicate that BSO and the SAAR diet induce similar changes in the kidney. Unaltered plasma aspartate and alanine transaminases and cystatin-C indicate that long-term continuous administration of BSO is safe. Data demonstrate that BSO recapitulates the SAAR-induced anti-obesity effects and that GSH plays a mechanistic role. BSO dose-response studies in animals and pilot studies in humans to combat obesity are highly warranted.

Keywords: aging; anti-obesity drugs; buthionine sulfoximine; serine; thiols.


Conflict of interest statement

CONFLICTS OF INTEREST: The authors declare that they have no conflicts of interest.

Figures

Figure 1
Figure 1
The SAAR diet and BSO induce similar morphometric changes. Four groups of eighteen-week-old male C57BL/6NTac mice (n=7/group) were fed high-fat (60% Kcal from fat) diets with 0.86% w/w methionine (CD), 0.12% w/w methionine (SAAR), SAAR diet with 30 mM N-acetylcysteine in water (NAC), and CD diet with 30 mM DL-buthionine (S, R) sulfoximine (BSO). Compared to the CD, the SAAR diet caused weight loss (AC) and increased food intake (D). Despite feeding on the SAAR diet, mice in the NAC group did not exhibit any changes (AD). Except for the lack of increased food intake, changes in BSO mice were similar to those in the SAAR mice, despite feeding on a diet replete with sulfur amino acids (AD). Note: One-way ANOVA followed by Tukey’s multiple comparison tests was used to find group-wise differences (*P ≤ 0.05, **P ≤ 0.01, ***P ≤ 0.001, ****P ≤ 0.0001. Bars and error bars represent means and standard error of means). CD growth curves are invisible as NAC growth curves overlay them.
Figure 2
Figure 2
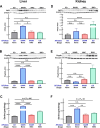
BSO decreases tissue concentrations of cysteine and glutathione, but not of methionine. Similar to the SAAR diet, BSO decreased total cysteine (tCys) (A) and total glutathione (tGSH) (B) in the liver, but to a lower extent. Unlike the SAAR diet, which did not alter hepatic methionine, BSO increased it (C). BSO exerted stronger effects than the SAAR diet on tCys (D) and tGSH (E) in the kidney. The SAAR diet, but not BSO, decreased methionine in the kidney (F). NAC reversed the impact of the SAAR diet on both sulfur compounds. Note: # indicates P-values from a 2-tailed Student’s t-test; the rest of the statistical methods are similar to those in Figure 1.
Figure 3
Figure 3
The SAAR diet and BSO exert tissue-specific effects on Nrf2 and Phgdh. The SAAR diet increased Nrf2 (A) and Phgdh (B) protein expressions in the liver, which ultimately resulted in higher serine concentrations (C). Unlike the SAAR diet, BSO did not increase Nrf2 and Phgdh in the liver but increased both in the kidneys (D, E). Regardless of the changes in Nrf2 and Phgdh, BSO increased serine concentrations in livers and kidneys (CF). NAC reversed SAAR-induced changes in Nrf2, Phgdh, and serine (AF). Note: Sample size = 5-6. Statistical methods are similar to those in Figure 2.
Figure 4
Figure 4
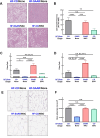
BSO decreases hepatic lipid droplet frequency. Hematoxylin and eosin-stained liver sections show a lower frequency of lipid droplets in mice on BSO than in CD but higher than those on the SAAR diet (A). A bar graph of lipid droplet quantification is shown in (B). Gene expression data show that both the SAAR diet and BSO decrease the expression of Cidea (C) and Cidec (D), proteins involved in lipid droplet synthesis. Unlike the SAAR diet, BSO did not decrease the adipocyte area in epididymal adipose tissue (E, F). NAC reversed all the SAAR-induced changes (AF). Note: Statistical methods are similar to those in Figure 2. The sample size was 6-7/group.
Figure 5
Figure 5
BSO prevents fat mass gain without affecting lean mass. The SAAR diet and BSO lowered epididymal fat mass (A). However, the SAAR diet exerted a strong effect on total body fat mass compared to the baseline values at week 0 (B); with a concomitant decrease in lean mass (C). Although it did not exert as strong an effect as the SAAR diet on total fat mass (B), BSO did not lower lean mass (C). On the other hand, NAC mice had values similar to those of CD mice (AC). Note: Statistics and sample size are as mentioned in Figure 1.
Figure 6
Figure 6
BSO decreases the mRNA expression of lipogenic but not lipolytic genes. Similar to the SAAR diet, BSO decreased the mRNA expression of lipogenic genes, including Scd1 (A), Gpam (B), Mogat1 (C), and Mogat2 (D). The SAAR diet, but not BSO, increased the mRNA expression of lipolytic genes like Atgl (E), Ppargc1a (F), Arl8b (G), and Hadhb (H). NAC reversed the effects of the SAAR diet on all these genes. Note: Statistical methods are similar to those in Figure 2. Sample size is as mentioned in Figure 1.
Figure 7
Figure 7
BSO and the SAAR diet induce similar metabolomic profiles in the kidneys. Metabolomics analyses revealed that the SAAR diet induces unique changes in the liver, which were reversed by NAC supplementation (overlap of NAC and CD clusters). (A) Although the BSO-induced changes appear as a cluster separated from CD, the statistical significance was on the borderline. However, BSO-induced changes in the kidney overlapped the SAAR-induced changes, while clusters from the NAC and CD groups overlap, indicating the reversal of SAAR diet-induced changes (B). Heat maps of the metabolites with the most significant changes in the liver and kidney are shown in (C, D).

Similar articles

References

    1. Chung KW. Advances in Understanding of the Role of Lipid Metabolism in Aging. Cells. 2021; 10:880. 10.3390/cells10040880 - DOI - PMC - PubMed
    1. Tirronen A, Hokkanen K, Vuorio T, Ylä-Herttuala S. Recent advances in novel therapies for lipid disorders. Hum Mol Genet. 2019; 28:R49–54. 10.1093/hmg/ddz132 - DOI - PubMed
    1. Castaño-Martinez T, Schumacher F, Schumacher S, Kochlik B, Weber D, Grune T, Biemann R, McCann A, Abraham K, Weikert C, Kleuser B, Schürmann A, Laeger T. Methionine restriction prevents onset of type 2 diabetes in NZO mice. FASEB J. 2019; 33:7092–102. 10.1096/fj.201900150R - DOI - PMC - PubMed
    1. Plaisance EP, Greenway FL, Boudreau A, Hill KL, Johnson WD, Krajcik RA, Perrone CE, Orentreich N, Cefalu WT, Gettys TW. Dietary methionine restriction increases fat oxidation in obese adults with metabolic syndrome. J Clin Endocrinol Metab. 2011; 96:E836–40. 10.1210/jc.2010-2493 - DOI - PMC - PubMed
    1. Ables GP, Ouattara A, Hampton TG, Cooke D, Perodin F, Augie I, Orentreich DS. Dietary methionine restriction in mice elicits an adaptive cardiovascular response to hyperhomocysteinemia. Sci Rep. 2015; 5:8886. 10.1038/srep08886 - DOI - PMC - PubMed

LinkOut - more resources