. 2025 Jun 2;224(6):e202409219.
doi: 10.1083/jcb.202409219. Epub 2025 Apr 9.

Plasticity of mitotic cyclins in promoting the G2-M transition

Affiliations

Plasticity of mitotic cyclins in promoting the G2-M transition

Adrijana Crncec et al. J Cell Biol. .

Abstract

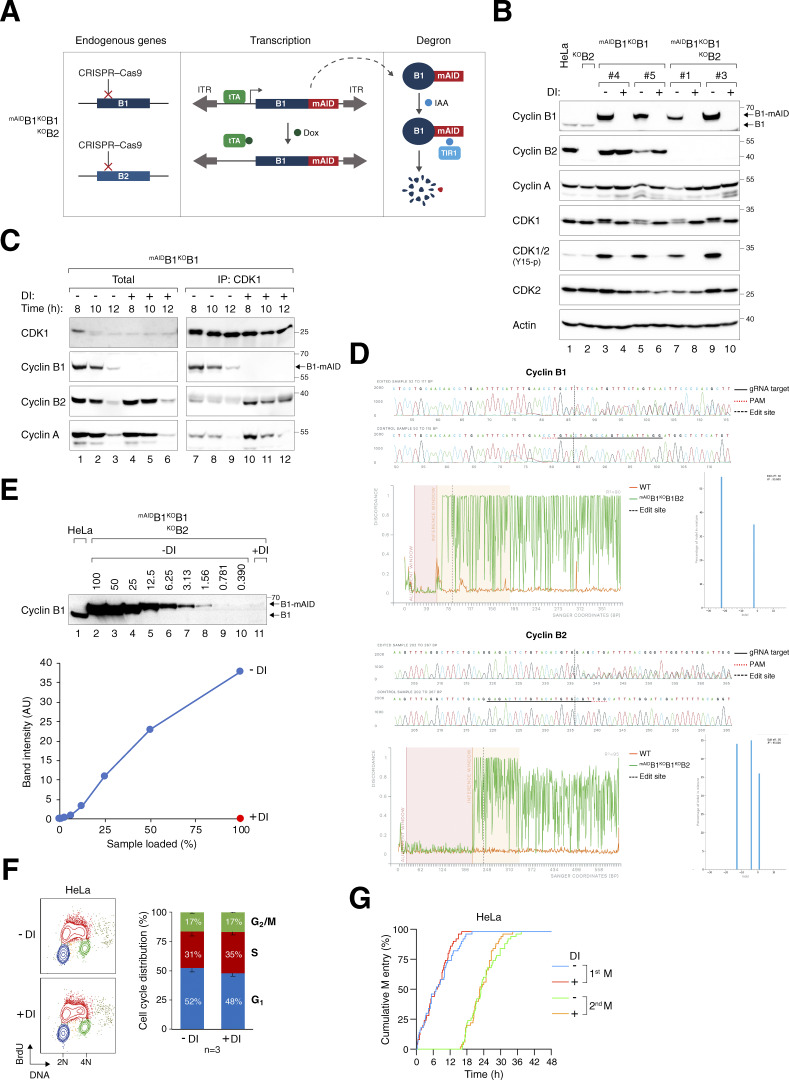
Cyclins and cyclin-dependent kinases (CDKs) orchestrate key events in the cell cycle. However, the uniqueness of individual mitotic cyclins has been a long-standing puzzle. By rapidly removing cyclins in G2 human cells, we found that deficiency of B-type cyclins attenuates mitotic onset and uncouples the G2-M kinase network from mitosis, resulting in sustained activation of PLK1 and cyclin A-CDK1. This culminates in mitotic slippage without completing nuclear envelope breakdown. Remarkably, elevating cyclin A several-fold above its endogenous level is adequate to restore mitosis, allowing cells to survive without B-type cyclins. In contrast, cyclin A is rate-limiting but not essential for G2-M due to compensation by endogenous cyclin B1-CDK2, a non-canonical pair. These findings challenge the traditional indispensable roles of different cyclins and highlight their plasticity. Due to the high malleability of the A- and B-type cyclins, cancer cells may be able to place different weights on different cyclins, while maintaining sufficient CDK activities for successful mitosis.


Conflict of interest statement

Disclosures: The authors declare no competing interests exist.

Figures

Figure S1.
Figure S1.
Gene silencing of cyclin B1 and cyclin B2. (A) Conditional gene silencing strategy for mitotic cyclin B. CRISPR-Cas9 was used to disrupt the loci of both endogenous cyclin B1 and cyclin B2. The cDNA of cyclin B1 was tagged with mAID and put inside a Sleeping Beauty transposon cassette for genome delivery to rescue the KO effects. Silent mutations were introduced into mAIDcyclin B1 to confer resistance to the CRISPR-Cas9. In the presence of Dox, transcription of mAIDcyclin B1 is inhibited by blocking the tetracycline-controlled transcriptional activator (tTA) from binding to the TRE in the promoter. The addition of IAA triggers the degradation of residual mAIDcyclin B1 in cells expressing the F-box protein TIR1. ITR: inverted terminal repeat. (B) Gene silencing of cyclin B1 and/or cyclin B2. HeLa cells were engineered to stably express mAIDcyclin B1, tTA, and TIR1. CRISPR–Cas9 was used to disrupt cyclin B1 (in mAIDB1KOB1) or both cyclin B1 and B2 (in mAIDB1KOB1B2). Single-colony–derived clones were isolated and cultured with or without DI for 8 h. Lysates were prepared and analyzed with immunoblotting. Lysates from parental HeLa and cyclin B2 KO cells (KOB2) were included as controls. Equal loading of lysates was confirmed by immunoblotting for actin. (C) Enhanced formation of cyclin B2–CDK1 and cyclin A–CDK1 complexes in the absence of cyclin B1. mAIDB1KOB1 cells synchronized with a double thymidine block were cultured with or without DI and harvested at the indicated time points. Lysates were prepared and subjected to immunoprecipitation with an antibody against CDK1. Both total lysates and immunoprecipitates were analyzed with immunoblotting. (D) Indel analysis of cyclin B1 and cyclin B2. The endogenous cyclin B1 (CCNB1) and cyclin B2 (CCNB2) loci in mAIDB1KOB1B2 cells were analyzed with sequencing. Sequencing traces of control (HeLa) and the edited samples were generated for indel analysis. The targeted sequence of the gRNA (solid black line), PAM sequence (dotted red line), and edited site (dotted black line) are indicated. Discordance, calculated by ICE, is shown for the edited (green) and control (orange) traces. The alignment window indicates the region of the traces with high Phred quality scores used for alignment. The inference window indicates the altered sequences around the edited site (dotted black line). Indel and corresponding prevalence were determined using ICE, with editing efficiencies of 90% for cyclin B1 and 95% for cyclin B2. (E) Efficiency of cyclin B1 silencing in mAIDB1KOB1B2 cells. After treatment with DI for 6 h, lysates were prepared and analyzed with immunoblotting. Lysates from HeLa cells were included to serve as a reference for the expression level of endogenous cyclin B1. The signals corresponding to mAIDcyclin B1 were quantified using a standard curve based on serial dilutions of mAIDB1KOB1B2 cell lysates (lanes 2–10), showing that <1% of mAIDcyclin B1 remained after DI treatment. (F) DI treatment does not affect the overall cell cycle distribution. HeLa cells were treated with DI for 24 h, pulsed with BrdU for 30 min, and analyzed using bivariate flow cytometry. Representative contour plots are shown (red: BrdU-positive; yellow: BrdU-negative S; blue: G1; green: G2/M). The positions of 2N and 4N DNA content are indicated. The percentage of cells at different cell cycle stage (excluding BrdU-negative S) was quantified. Mean and SEM from three independent experiments. (G) DI treatment does not affect cell cycle progression. Parental HeLa cells were treated with DI and analyzed using live-cell imaging for 48 h. The cumulative percentage of cells entering the first and second mitosis over time is shown. Source data are available for this figure: SourceData FS1.
Figure 1.
Figure 1.
Essential role of cyclin B1 and B2 in cell proliferation and survival. (A) Conditional silencing of cyclin B1. HeLa cells were engineered to stably express mAIDcyclin B1, tTA, and TIR1, concurrently disrupting the endogenous cyclin B1 with CRISPR-Cas9. Clones of mAIDB1KOB1 cells were isolated and cultured in the presence of Dox and IAA (DI). The cells were harvested at different time points for immunoblotting analysis. Lysates from control HeLa cells were used to compare endogenous cyclin B1 levels. Equal loading of lysates was confirmed by immunoblotting for actin. (B) Simultaneous silencing cyclin B1 and B2. mAIDB1KOB1B2 cells were generated and treated with DI similarly as in A (see Materials and methods). (C) Conditional silencing cyclin B2. AIDB2KOB2 cells were generated and treated with DI similarly as in A (see Materials and methods). (D) Depletion of cyclin B1 and B2 promotes apoptosis. Different cell lines were cultured with or without DI and harvested at the indicated time points for immunoblotting. (E) Depletion of cyclin B promotes mitotic block and apoptosis. The indicated cell lines were cultured with or without DI. At different time points, the cells were fixed and analyzed with flow cytometry. Positions of 2N and 4N DNA content are indicated. (F) Silencing of cyclin B abrogates clonogenic survival. mAIDB1KOB1B2 cells were cultured with or without DI for 2 wk. Colonies were fixed, stained, and quantified. Mean ± SEM from six independent experiments. Mann–Whitney test: **P < 0.01; ns P > 0.05. Source data are available for this figure: SourceData F1.
Figure 2.
Figure 2.
Conditional depletion of cyclin B induces defective mitotic entry and pre-NEBD slippage. (A) Pre-NEBD slippage in cyclin B-depleted cells. Different cell lines expressing histone H2B-GFP were synchronized using a double thymidine block and released into drug-free or DI-containing medium for 6 h to turn off cyclin B1 before time-lapse imaging. Time indicates the duration after thymidine release. Key: interphase (grey); mitosis (red); cell death (truncated bars); pre-NEBD mitosis (blue), and interphase after pre-NEBD slippage (green). The plot at the bottom shows the elapsed time between mitotic entry and exit (or cell death). For cells exhibiting pre-NEBD slippage, the time of mitosis was defined as from cell rounding to the appearance of cytoplasmic processes before cell flattening (blue). Mean ± SEM (n = 50). Mann–Whitney test: ****P < 0.0001; ***P < 0.001; ns P > 0.05. (B) Depletion of cyclin B1 lengthens the duration of mitosis. Live-cell imaging was performed to determine mean mitotic duration as described in A. Mean ± SEM from three independent experiments. (C) Depletion of cyclin B delays mitotic entry. Cell lines were synchronized using double-thymidine block and released into a drug-free or DI-containing medium. After 6 h, individual cells were tracked using live-cell imaging. The cumulative percentage of cells entering mitosis over time is shown. Note that DI-treated mAIDB1KOB1B2 cells mainly entered pre-NEBD slippage instead of normal mitosis (shown in blue). Mean ± SEM from three independent experiments. Mann–Whitney test: ****P < 0.0001; ns P > 0.05. (D) Pre-NEBD slippage induced by cyclin B silencing. Cells were imaged following the procedure outlined in A. Representative images show mAIDB1KOB1B2 cells undergoing mitosis in the presence or absence of DI. In DI-treated cells, the commencement of cell rounding and pre-NEBD slippage are indicated by the arrow and asterisk, respectively. Time: h:min. Scale bar: 10 µm. See Videos 1 and 2.
Figure S2.
Figure S2.
Conditional depletion of cyclin B induces defective mitotic entry and mitotic slippage. (A) DI treatment of control HeLa cells. HeLa cells expressing histone H2B-GFP were synchronized using a double thymidine block and released into a drug-free or DI-containing medium for 6 h before time-lapse imaging. Time indicates the duration after thymidine release. Key: interphase (grey); mitosis (red); and cell death (truncated bars). The plots show the cumulative percentage of cells entering mitosis over time and the elapsed time between mitotic entry and exit. (B) Defective mitosis in the absence of cyclin B does not involve SAC activation. mAIDB1KOB1B2 cells were cultured in a drug-free or DI-containing medium with or without the MPS1 inhibitor AZ3146. After 6 h, individual cells were tracked using live-cell imaging. Key: interphase (grey); mitosis (red); cell death (truncated bars); pre-NEBD mitosis (blue), and interphase after pre-NEBD slippage (green). (C) Silencing of cyclin B prevents APC/C activation. mAIDB1KOB1B2 cells expressing histone H2B-GFP were transfected with an mRFP APC/C biosensor plasmid. The cells were cultured in drug-free or DI-containing medium and analyzed using live-cell imaging. Representative images show normal mitosis and abnormal mitosis without APC/C activation. Time: h:min. Scale bar: 10 µm. (D) Loss of cyclin B1 alone does not abolish mitotic entry and exit. mAIDB1KOB1 cells were synchronized using double thymidine block and released into a drug-free or DI-containing medium. The cells were harvested at the indicated time points for immunoblotting analysis. (E) CDK1 substrate phosphorylation in the absence of cyclin B1. Samples from D were subjected to immunoblotting using an antibody against phosphorylated CDK1 substrates (pTPxK). The positions of bands affected by cyclin B depletion are as described in Fig. 4 B. Source data are available for this figure: SourceData FS2.
Figure 3.
Figure 3.
Depletion of cyclin B induces pre-NEBD slippage. (A) Abnormal mitosis with intact lamin A coupled with cytoskeleton rearrangement in cyclin B-depleted cells. mAIDB1KOB1B2 cells were synchronized using a double thymidine block and released into a drug-free or DI-containing medium. After 12 h, cells were fixed and imaged using Airyscan confocal microscopy. Representative images show untreated cells in interphase or mitosis and a DI-treated cell undergoing aberrant mitosis. Scale bar: 5 µm. (B) Depletion of cyclin B leads to mitosis devoid of NEBD. mAIDB1KOB1B2 cells were transfected with plasmids expressing EGFP-BAF and histone H2B-EGFP. After 36 h, the cells were synchronized using a single thymidine block and released into either a drug-free or DI-containing medium. After 10 h, live-cell imaging was performed using Airyscan confocal microscopy. Representative images of a control cell entering mitosis (note the DNA condensation and the redistribution of EGFP-BAF) and a cyclin B-depleted cell lacking breakdown of EGFP-BAF-containing nuclear lamina are shown. Cell outlines are indicated by white dotted lines. Time: h:min. Scale bar: 10 µm. (C) Silencing of cyclin B results in mitosis without loss of nuclear membrane integrity. mAIDB1KOB1B2 cells were transfected with an RFP-NLS expression plasmid, cultured in drug-free or DI-containing medium, and analyzed using live-cell imaging. Representative images show normal mitosis and aberrant mitosis without NEBD. Time: h:min. Scale bar: 10 µm. The graph represents the cumulative percentage of cells that have progressed past NEBD, as judged by the flooding of RFP-NLS signal (n = 50). (D) Absence of NEBD in cyclin B-depleted cells. mAIDB1KOB1B2 cells were transfected with a plasmid expressing mRFP-lamin A and cultured in a drug-free or DI-containing medium. Representative images from live-cell imaging analysis of normal mitosis and abnormal mitosis are shown (NEBD denoted by an asterisk). Time: h:min. Scale bar: 10 µm. See Videos 3 and 4.
Figure 4.
Figure 4.
Loss of cyclin B uncouples the normal regulation of the G 2 -M kinase network. (A) Dysregulated phosphorylation and expression of G2–M regulators in the absence of cyclin B. mAIDB1KOB1B2 cells synchronized using double thymidine block were released into a drug-free or DI-containing medium and harvested at different time points for immunoblotting. The positions of the three isoforms of Aurora kinases are indicated. (B) Dysregulation of CDK1 substrate phosphorylation in the absence of cyclin B. Samples prepared from A were immunoblotted with an antibody against CDK1 phosphorylation substrates (pTPxK). The positions of bands that are absent in DI-treated cells are indicated with asterisks. Bands present in both DI-treated and untreated cells but lacking cell cycle variation in DI-treated samples are indicated with circles. Source data are available for this figure: SourceData F4.
Figure 5.
Figure 5.
Cyclin A drives residual mitotic activity in the absence of cyclin B. (A) Enhanced formation of cyclin A–CDK1 complexes without cyclin B. mAIDB1KOB1B2 cells synchronized with double thymidine block were released into a drug-free or DI-containing medium and harvested at different time points. Lysates were prepared and subjected to immunoprecipitation with a CDK1 antibody. Both total lysates and immunoprecipitates (IP) were analyzed with immunoblotting. (B) Contribution of cyclin A to CDK1 substrate phosphorylation in the absence of cyclin B. mAIDB1KOB1B2 cells transfected with control siRNA (siControl) or siRNA targeting cyclin A (siCyclin A) were synchronized using double thymidine block. The cells were released into a drug-free or DI-containing medium and harvested at different time points for immunoblotting. The positions of pTPxK bands affected by cyclin B depletion are indicated as described in Fig. 4 B. (C) Depletion of cyclin A does not affect cyclin B expression. Cell lines transfected with control siRNA or siRNA targeting cyclin A were left untreated or treated with DI for 24 h. Lysates were prepared and analyzed with immunoblotting. (D) Suppression of mitotic entry in cyclin B-deficient cells upon cyclin A knockdown. Cell lines transfected with control siRNA or siRNA targeting cyclin A were analyzed using live-cell imaging after treatment with DI. The cumulative percentage of cells entering mitosis over time is shown. Note that DI-treated mAIDB1KOB1B2 cells exhibited pre-NEBD slippage (*) instead of normal mitosis. Source data are available for this figure: SourceData F5.
Figure S3.
Figure S3.
Rescue of cell cycle defects caused by cyclin B deficiency with cyclin B1 and cyclin A. (A) Expression of cyclin B1-YFP in cyclin B-deficient cells. mAIDB1KOB1B2 cells were transfected with a control plasmid or plasmids expressing YFP or cyclin B1-YFP. At 16 h after transfection, the cells were treated with DI and harvested at different time points. Lysates were prepared and analyzed with immunoblotting. (B) Ectopic expression of cyclin B1 rescues cell cycle defects induced by cyclin B deficiency. mAIDB1KOB1B2 cells transfected with plasmids expressing YFP or cyclin B1-YFP were treated with DI and harvested at the indicated time points for flow cytometry analysis. The DNA profiles of transfected YFP-positive cells are shown. (C) Overexpression of cyclin A in cyclin B-deficient cells. mAIDB1KOB1B2 cells expressing either mRFP or cyclin A-mRFP were treated with DI and harvested at specific time points. Lysates were prepared and analyzed with immunoblotting. (D) Overexpression of CDK1 and CDK2 in cyclin B-deficient cells. mAIDB1KOB1B2 cells expressing mRFP, CDK1-mRFP, or CDK2-mRFP were treated with DI and harvested at specific time points for immunoblotting analysis. (E) Ectopic expression of cyclin A promotes DNA re-replication in cyclin B-deficient cells. mAIDB1KOB1B2 cells were transfected with plasmids expressing mRFP or mRFP-tagged CDK1, CDK2, or cyclin A, followed by treatment with buffer or DI for 48 h. The cells were harvested and analyzed with flow cytometry. The DNA profiles of transfected mRFP-positive cells are shown. The asterisk indicates the population containing >4N DNA content. (F) Doubling cyclin A expression is insufficient to restore normal mitosis in cyclin B-deficient cells. mAIDB1KOB1B2 cells expressing “low” level of cyclin A and “high” level of cyclin A (see Fig. 6 A) were treated and imaged as described in Fig. 6 D. Representative images show mitosis in the presence and absence of DI. Time: h:min. Scale bar: 10 µm. (G) Localization of cyclin A-mRFP to both nucleus and cytoplasm during interphase. mAIDB1KOB1B2 cells expressing “high” level of cyclin A were treated and imaged as described in Fig. 6 D. Representative images show mitosis in the presence and absence of DI. Time: h:min. Scale bar: 10 µm. Source data are available for this figure: SourceData FS3.
Figure 6.
Figure 6.
Mitotic defects caused by cyclin B deficiency can be compensated by cyclin A overexpression. (A) Ectopic expression of cyclin A in cyclin B-deficient cells. mAIDB1KOB1B2 cells were transfected with mRFPcyclin A expression plasmids. Cells with varying levels of mRFPcyclin A were sorted by flow cytometry. The cell lines were left untreated or treated with DI for the indicated time before analyzed with immunoblotting. (B) Rescue of cyclin B deficiency-induced G2/M arrest by cyclin A overexpression. Parental and mAIDB1KOB1B2 cells expressing low or high levels of mRFPcyclin A were treated with DI to turn off mAIDcyclin B1. The cells were harvested at the indicated time points and analyzed using flow cytometry. (C) Cyclin A rescues clonogenic survival in cyclin B-deficient cells. mAIDB1KOB1B2 cells expressing high levels of mRFPcyclin A were cultured with or without DI for 2 wk. Colonies were fixed and stained. Mean ± SEM from six independent experiments. Mann–Whitney test: **P < 0.01; *P < 0.05. Note that the same data for the mAIDB1KOB1B2 control cells as in Fig. 1 F were used for comparison. (D) Cyclin B deficiency-induced pre-NEBD slippage can be overcome by cyclin A overexpression. Cells expressing histone H2B-GFP were synchronized using a double thymidine block and released into a drug-free or DI-containing medium. After 6 h, individual cells were tracked using live-cell imaging. Time indicates the duration after thymidine release. Key: interphase (grey); mitosis (red); cell death (truncated bars); interphase after cytokinesis failure (purple); pre-NEBD mitosis (blue), and interphase after pre-NEBD slippage (green). The plot shows the percentage of defective mitosis (mitotic slippage and cytokinesis failure). Mean ± SEM from three independent experiments. (E) Overexpression of cyclin A overcomes mitotic entry delay in cyclin B-deficient cells. Cell lines were synchronized, released into drug-free or DI-containing medium, and analyzed with live-cell imaging as described in D. The cumulative percentage of cells entering mitosis (both normal and pre-NEBD mitosis) over time is shown. Mean ± SEM from three independent experiments. Mann–Whitney test: ****P < 0.0001; ***P < 0.001; ns P > 0.05. Note that the same graph from Fig. 2 C is included for clarity for control mAIDB1KOB1B2 cells. (F) Ectopic expression of cyclin A restores mitosis in cyclin B-deficient cells. Parental and cyclin A-overexpressing mAIDB1KOB1B2 cells were synchronized using a double thymidine block. The cells were released into a drug-free or DI-containing medium and harvested at different time points. Protein expression was analyzed with immunoblotting. The positions of pTPxK bands affected by cyclin B depletion are indicated as described in Fig. 4 B. (G) Increased cyclin A–CDK1/2 complexes in the absence of cyclin B. Parental and cyclin A-overexpressing mAIDB1KOB1B2 cells were grown in drug-free or DI-containing medium for 24 h. Lysates were prepared and subjected to immunoprecipitation using an antibody against cyclin A. Both total lysates and immunoprecipitates (IP) were analyzed with immunoblotting. (H) Increased binding of both endogenous and mRFPcyclin A to CDK1 upon the loss of cyclin B. Parental and cyclin A-overexpressing mAIDB1KOB1B2 cells were synchronized using double thymidine block as described in F. Lysates were prepared and subjected to immunoprecipitation using an antibody against CDK1. Source data are available for this figure: SourceData F6.
Figure 7.
Figure 7.
Cyclin B1 overexpression overcomes cyclin A KO -mediated G 2 -M delay. (A) Conditional gene silencing of cyclin A. HeLa cells expressing AIDcyclin A without endogenous cyclin A were generated (AIDAKOA). CDK2 was further disrupted in AIDAKOA cells using CRISPR-Cas9. The cells were either left untreated or treated with DI for the indicated time for immunoblotting analysis. (B) Codepletion of cyclin A and CDK2 leads to extensive G2/M delay. HeLa or AIDAKOA cells with or without CDK2 were either left untreated or treated with DI for 24 h. Cell cycle distribution was analyzed with flow cytometry. (C) Loss of cyclin A results in cell cycle delay in both S and G2/M. Cells were treated with DI for 24 h and pulsed with BrdU (30 min) before being analyzed with bivariate flow cytometry. Representative contour plots are shown (red: BrdU-positive; yellow: BrdU-negative S; blue: G1; green: G2/M). The percentage of cells at different cell cycle stages (excluding BrdU-negative S) was quantified (mean and SEM from three independent experiments). (D) Significant cell cycle delay in the absence of cyclin A and CDK2. Cells were preincubated with DI for 6 h to deplete cyclin A before individual cells were tracked using live-cell imaging for 48 h. The cumulative percentage of cells entering the first and second mitosis over time is shown (raw data for individual cells are presented in Fig. S4 A). ****P < 0.0001. (E) Loss of cyclin A–CDK2 delays cell cycle progression. Cells were subjected to live-cell imaging analysis as described in D. Box-and-whisker plots show the elapsed time between the end of the first mitosis to the end of the second mitosis. ****P < 0.0001; ***P < 0.001; *P < 0.05. (F) Cyclin A is an essential gene in HeLa cells. AIDAKOA and AIDAKOAKOCDK2 cells were cultured with or without DI. After 2 wk, the cells were fixed, stained with crystal violet, and the number of colonies was quantified. Representative images and Mean ± SEM from four independent experiments are shown. ****P < 0.0001. (G) Simultaneous cyclin A and CDK2 depletion during G2-M. Cells were synchronized using double thymidine block, released into drug-free or DI-containing medium, and harvested at different time points for immunoblotting analysis (upper panel). DNA content was analyzed using flow cytometry (lower panel). (H) Alleviation of cyclin AKO-induced G2-M delay by cyclin B1 requires CDK2. A stable cell line expressing YFP-tagged cyclin B1 (B1-YFP) was established from AIDAKOA cells. CDK2 was further disrupted to obtain AIDAKOAKOCDK2 cells expressing B1-YFP. Following double thymidine synchronization, cells were left untreated or treated with DI for 7 h to before analyzed using time-lapse imaging. Separate plates of cells were harvested at 3 h after the start of live-cell imaging for immunoblotting analysis to confirm protein expression. Raw data for individual cells are presented in Fig. S4 C. ****P < 0.0001; **P < 0.01. (I) Enhanced interaction between cyclin B1 and CDK2 in the absence of cyclin A. AIDAKOA cells, with or without ectopically expressed cyclin B1, were synchronized in G2 using a double thymidine block. Lysates were prepared and subjected to immunoprecipitation using antibodies against CDK1 or CDK2. The total lysates and immunoprecipitates (IP) were analyzed using immunoblotting. Note that the PSTAIRE antibody recognizes both CDK1 and CDK2. The band intensities of cyclin B1-YFP in the IP were quantified and normalized to -DI (mean ± SEM from three independent experiments). Source data are available for this figure: SourceData F7.
Figure S4.
Figure S4.
Delayed mitotic entry in the absence of cyclin A and CDK2. (A) Mitotic entry is significantly delayed in AIDAKOA and AIDAKOAKOCDK2 cells. Cells were pre-incubated with DI for 6 h to deplete cyclin A, followed by live-cell imaging for 48 h (n = 50). Key: interphase (grey); mitosis (red); and cell death (truncated bars). (B) Minimal delay in S phase progression upon cyclin A silencing. AIDAKOA cells were synchronized at S phase with double thymidine block and treated with DI at the second thymidine release to deplete AIDcyclin A. The cells were pulsed with BrdU for 30 min before harvested at each time points for immunoblotting analysis. The band intensity of AIDcyclin A was quantified and normalized to -DI control at t = 0 h. BrdU incorporation and DNA content were examined with bivariate flow cytometry (red: BrdU-positive; yellow: BrdU-negative S; blue: G1; green: G2/M). The percentages of S (BrdU-positive) and G2 cells were quantified (mean ± SEM from four independent experiments). (C) Alleviation of cyclin AKO-induced G2-M delay by cyclin B1. AIDAKOA and AIDAKOAKOCDK2 cells overexpressing cyclin B1 synchronized with double thymidine block were left untreated or treated with DI for 7 h to turn off cyclin A before time-lapse imaging. Time indicates the duration after thymidine release. Key: interphase (grey); mitosis (red); and cell death (truncated bars). (D) Conditional gene silencing of cyclin A in H1299 cells. HeLa and H1299 cells expressing AIDcyclin A without endogenous cyclin A were left untreated or treated with DI for 24 h before immunoblotting analysis. Lysates from HeLa and H1299 cells were included as controls for the relative expression of AIDcyclin A and endogenous cyclin A. (E) Cyclin A depletion induces G2-M delay in both HeLa and H1299 cells. AIDAKOA cells were synchronized using a double thymidine block and released into a drug-free or DI-containing medium. After 6 h, mitotic entry was analyzed using live-cell imaging (left panel; time indicates the duration after thymidine release). Raw data for individual cells are presented in the right panel. Key: interphase (grey); mitosis (red); and cell death (truncated bars). (F) Presence of cyclin B1–CDK2 complexes during normal G2. HeLa cells were synchronized at S phase with double thymidine block. After release into fresh medium for 5 h, NOC was added to prevent mitotic exit. After 4 h, mitotic cells were removed by washing, and the attached G2 cells were harvested for immunoprecipitation using antibodies against CDK1, CDK2, or cyclin A. Protein expression in the total lysates and immunoprecipitates (IP) was detected using immunoblotting. A negative control (no antibody was added) was included to assess the specificity of the immunoprecipitation. Source data are available for this figure: SourceData FS4.
Figure S5.
Figure S5.
Relative levels of intercellular and intracellular cyclins. (A) A representative example of the immunoblotting analysis showing the relative levels of mitotic cyclins in HeLa and RPE1 cells. Different concentrations of plasmids expressing AID-cyclin A, B1, or B2 were transfected into HeLa cells to serve as standards. Lysates from asynchronous (Asy) and G2 HeLa and RPE1 cells were loaded. The samples were analyzed with antibodies against mAID or individual cyclins. (B) RPE1 cells contain relatively lower concentrations of B-type cyclins compared to HeLa cells. HeLa and RPE1 cells from asynchronous (Asy) and RO3306-treated (G2) populations were analyzed with flow cytometry or immunoblotting. (C) Comparison of the expression of mitotic cyclins in HeLa and RPE1 cells. The relative expression of cyclin A, B1, and B2 in asynchronous (Asy) and G2 lysates was determined using the respective AID-cyclin standards. The expression level of each cyclin was normalized to that cyclin in asynchronous HeLa cells. Mean of two independent experiments. (D) B-type cyclins are more abundant than cyclin A. The relative expression of cyclin A, B1, and B2 in asynchronous (Asy) and G2 lysates was determined using the respective AID-cyclin standards. The relative levels between each AID-cyclin were first determined using an antibody against AID. The expression level of endogenous cyclins was normalized to that of cyclin B1 in asynchronous HeLa (upper panel) or RPE1 (lower panel). Mean of two independent experiments.
Figure 8.
Figure 8.
Relative levels of intercellular and intracellular cyclins. (A) Plasticity of mitotic cyclins in human cell lines. During G2, cyclin B2 is more abundant than cyclin B1 and cyclin A (represented in the diagram by the length of individual bars). The absence of cyclin B1 results in a delay but not inhibition of G2–M. By contrast, depletion of both cyclin B1 and B2 severely curtailed mitotic entry, leading to cell rounding followed by pre-NEBD slippage. The pre-NEBD G2 block can be rescued by overexpressing cyclin A (red bars). Similar to cyclin B1, cyclin A is rate-limiting for G2-M. The G2-M delay due to cyclin A deficiency can be rescued by overexpression of cyclin B1. Cells were blocked in G2 in the absence of cyclin A and cyclin B1. (B) Interplay between cyclin A and cyclin B. In the absence of cyclin A, G2–M is delayed with an accompanied accumulation of cyclin B1–CDK1 and cyclin B1–CDK2 complexes. This delay can be alleviated by overexpression of cyclin B1 (see A). Conversely, the absence of cyclin B1 and B2 hinders proper mitotic entry, leading to pre-NEBD slippage, accompanied by an enrichment of cyclin A-CDK1 and cyclin A-CDK2. Overexpression of cyclin A effectively overcome the pre-NEBD defects.

References

    1. Androic, I., Krämer A., Yan R., Rödel F., Gätje R., Kaufmann M., Strebhardt K., and Yuan J.. 2008. Targeting cyclin B1 inhibits proliferation and sensitizes breast cancer cells to taxol. BMC Cancer. 8:391. 10.1186/1471-2407-8-391 - DOI - PMC - PubMed
    1. Bellanger, S., de Gramont A., and Sobczak-Thépot J.. 2007. Cyclin B2 suppresses mitotic failure and DNA re-replication in human somatic cells knocked down for both cyclins B1 and B2. Oncogene. 26:7175–7184. 10.1038/sj.onc.1210539 - DOI - PubMed
    1. Bentley, A.M., Normand G., Hoyt J., and King R.W.. 2007. Distinct sequence elements of cyclin B1 promote localization to chromatin, centrosomes, and kinetochores during mitosis. Mol. Biol. Cell. 18:4847–4858. 10.1091/mbc.e06-06-0539 - DOI - PMC - PubMed
    1. Brandeis, M., Rosewell I., Carrington M., Crompton T., Jacobs M.A., Kirk J., Gannon J., and Hunt T.. 1998. Cyclin B2-null mice develop normally and are fertile whereas cyclin B1-null mice die in utero. Proc. Natl. Acad. Sci. USA. 95:4344–4349. 10.1073/pnas.95.8.4344 - DOI - PMC - PubMed
    1. Brito, D.A., and Rieder C.L.. 2006. Mitotic checkpoint slippage in humans occurs via cyclin B destruction in the presence of an active checkpoint. Curr. Biol. 16:1194–1200. 10.1016/j.cub.2006.04.043 - DOI - PMC - PubMed

MeSH terms

LinkOut - more resources