. 2025 Jul 1;74(7):1273-1288.
doi: 10.2337/db24-0720.

Liraglutide Treatment Reverses Unconventional Cellular Defects in Induced Pluripotent Stem Cell-Derived β-Cells Harboring a Partially Functional WFS1 Variant

Affiliations

Liraglutide Treatment Reverses Unconventional Cellular Defects in Induced Pluripotent Stem Cell-Derived β-Cells Harboring a Partially Functional WFS1 Variant

Silvia Torchio et al. Diabetes. .

Erratum in

Abstract

Wolfram syndrome 1 (WS1) is a rare genetic disorder caused by WFS1 variants that disrupt wolframin, an endoplasmic reticulum-associated protein essential for cellular stress responses, Ca2+ homeostasis, and autophagy. Here, we investigated how the c.316-1G>A and c.757A>T WFS1 mutations, which yield partially functional wolframin, affect the molecular functions of β-cells and explored the therapeutic potential of the glucagon-like peptide 1 receptor (GLP-1R) agonist liraglutide. Pancreatic β-cells obtained from patient-derived induced pluripotent stem cells (iPSCs) carrying this WFS1 variant exhibited reduced insulin processing and impaired secretory granule maturation, as evidenced by proinsulin accumulation and decreased prohormone convertase PC1/3. Moreover, they exhibited dysregulated Ca2+ fluxes due to altered transcription of Ca2+-related genes, including CACNA1D, and significantly reduced SNAP25 levels, leading to uncoordinated oscillations and poor glucose responsiveness. Affected cells also showed increased autophagic flux and heightened susceptibility to inflammatory cytokine-induced apoptosis. Notably, liraglutide treatment rescued these defects by normalizing Ca2+ handling, enhancing insulin processing and secretion, and reducing apoptosis, likely through modulation of the unfolded protein response. These findings underscore the importance of defining mutation-specific dysfunctions in WS1 and support targeting the GLP-1/GLP-1R axis as a therapeutic strategy.

Article highlights: The molecular basis of WFS1-related mutations remains poorly investigated, and no definitive therapies exist for Wolfram syndrome 1. We dissected the molecular defects associated with c.316-1G>A and c.757A>T WFS1 mutations in patient-derived induced pluripotent stem cell islets and analyzed whether they are potential therapeutic targets of the glucagon-like peptide 1 receptor agonist liraglutide. We found impaired insulin granule maturation, altered Ca2+ fluxes, increased autophagic activity, and heightened susceptibility to inflammatory apoptosis in mutated cells. Liraglutide restored critical β-cell functions suggesting a route for personalized therapy based on WFS1 mutations.


Conflict of interest statement

Duality of Interest. No potential conflicts of interest relevant to this article were reported.

Figures

None
Graphical abstract
Figure 1
Figure 1
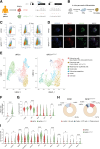
Endocrine phenotype of WFS1 SC islets. A: Schematic summary of iPSC generation from patient with WS1 and gene targeting for Cas9 correction of the c.316G>A-carrying allele. B: Schematic of differentiation protocol mimicking development of pancreatic progenitors (PPs) and pancreatic β-cells (SC islets). C: Representative flow cytometry dot plots showing the percentage of PDX1+, NKX6-1+, and INS+ cells in WFS1 and WFS1wt/757A>T at the PP and SC islets stages. PE, phycoerythrin; SSC, side scatter. D: Immunostaining of WFS1 and WFS1wt/757A>T SC islets stained for NKX6-1 and insulin. Nuclei were counterstained with Hoechst. Scale bar is 100 μm. E: Uniform Manifold Approximation and Projection (UMAP) from unsupervised clustering of transcriptional data from scRNA-seq of WFS1 and WFS1wt/757A>T SC islets. F: Violin plots detailing log-normalized unique molecular identifiers (UMIs) of WFS1 gene in WFS1 and WFS1wt/757A>T endocrine clusters. G: Violin plots detailing log-normalized UMIs of CHGA and pancreatic hormones (INS, GCG, SST, and PPY) in WFS1 and WFS1wt/757A>T endocrine clusters. H: Graphical representation of the relative percentage of both monohormonal (α-, β-, δ-, and PP) and polyhormonal cells in the endocrine clusters of WFS1 and WFS1wt/757A>T from scRNA-seq data. I: Violin plot detailing log-normalized UMIs of β-cell maturation markers in WFS and WFS1wt/757A>T endocrine clusters. *P < 0.05, **P < 0.01, ***P < 0.001 by Mann-Whitney nonparametric test.
Figure 2
Figure 2
Wolframin alteration determines impaired insulin processing. A: Dynamic human insulin secretion expressed as fold change over t = 0 secretion in 0.5 mmol/L glucose (n = 5 for WFS1 and n = 6 for WFS1wt/757A>T). *P < 0.05 by unpaired two-tailed t test. B: Insulin content expressed as international unit (IU) per islet equivalent (IEQ). Data are presented as mean ± SD (n = 6). **P < 0.01 by unpaired two-tailed t test. C: Proinsulin-to-insulin ratio quantification of insulin secreted when clusters were perfused with 11 mmol/L glucose + IBMX. Data are presented as mean ± SD (n = 5–6). ****P < 0.0001 by unpaired one-tailed t test. D: Violin plots reporting the log-normalized expression and expression levels measured by RT-qPCR of the SNARE complex-related VAMP2 and SNAP25 genes in the endocrine clusters of WFS1 and WFS1wt/757A>T SC islets. ****P < 0.0001 by Mann-Whitney nonparametric test. E: The expression levels measured by RT-qPCR of SNAP25 and VAMP2 genes in WFS1 and WFS1wt/757A>T SC islets (n = 5). **P < 0.01 by unpaired two-tailed t test. F: Log-normalized expression of PCSK1 gene in the endocrine clusters from scRNA-seq experiment and analysis of its expression levels by RT-qPCR in WFS1 and WFS1wt/757A>T SC islets (n = 5). ****P < 0.0001 by Mann-Whitney nonparametric test for scRNA-seq; and *P < 0.05 by unpaired two-tailed t test for RT-qPCR. G: Immunoblot analysis of PC1/3 expression in WFS1 and WFS1wt/757A>T SC islets. H: Relative quantification of PC1/3 to GAPDH (housekeeping) expression in WFS1 and WFS1wt/757A>T SC islets (n = 4). *P < 0.05 by unpaired one-tailed t test.
Figure 3
Figure 3
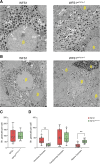
WFS1 SC islets show morphological defects in secretory granule maturation. A: TEM images of sections from WFS1 and WFS1wt/757A>T SC islets indicating morphologies of mature secretory granules (MG), immature secretory granules (IG), and TGs. MGs contain a dark core of condensed insulin surrounded by a large halo; IGs are located near the Golgi network and have no halo; TGs are close to the nucleus or mitochondria (mit) and have a narrow halo. B: TEM images showing the insulin secretory granules in WFS1 and WFS1wt/757A>T SC islets. The different cell types (ɑ, β, and δ) are also highlighted. Scale bar is 5 μm. Quantification of the total number (C) and IGs, TGs, and MGs (D) per cell in WFS1 and WFS1wt/757A>T SC islets (n = 12). **P < 0.01 by unpaired two-tailed t test.
Figure 4
Figure 4
Calcium flux dynamics is altered in WFS1 SC islets. A: Imaging of calcium flux using Fluo-4 dye in WFS1 and WFS1wt/757A>T SC islets after 50-, 75-, and 250-s stimulation with 0.5 mmol/L glucose (Glu), 11 mmol/L glucose supplemented with IBMX, and 30 mmol/L KCl, respectively. Objective magnification: ×10. B: Mean fluorescence signal (F/F0) over time in WFS1 and WFS1wt/757A>T SC islets indicating [Ca2+]i elevation in response to stimulation with 11 mmol/L glucose + IBMX. Peak (the maximum value of each oscillation), period (the length of time between two peaks), and active duration (A0, the length of time for Ca2+ oscillation measured at half of the peak height) are indicated within the WFS1 graph. The timing of β-cell activation and deactivation are highlighted in the WFS1wt/757A>T graph (n = 20-). C: Mean period upon stimulation, active and silent duration of oscillation, and plateau fraction measured in WFS1 and WFS1wt/757A>T β-cells (n = 20 cells from two different in vitro differentiation protocols, represented by white and blue circles, respectively). *P < 0.05, **P < 0.01 by Mann-Whitney nonparametric test.
Figure 5
Figure 5
Dysregulation of the insulin secretory machinery in WFS1 SC islets. A: Graphical representation of calcium oscillations in 15 WFS1 or WFS1wt/757A>T cells after stimulation with 11 mmol/L glucose (Glu) supplemented with IBMX, followed by 30 mmol/L KCl. B: Mean coactivity coefficient in WFS1 or WFS1wt/757A>T cells stimulated with 11 mmol/L glucose supplemented with IBMX (n = 20). ***P < 0.001 by unpaired two-tailed t test. C: Violin plot reporting the log-normalized expression of the calcium-related genes RGS4, CACNA1C, CACNA1D, and WNT4 in the endocrine clusters of WFS1 and WFS1wt/757A>T SC islets. **P < 0.01, ***P < 0.001 by Mann-Whitney nonparametric test. D: Expression levels measured by RT-qPCR of CACNA1C-D and WNT4 genes in WFS1 and WFS1wt/757A>T SC islets (n = 5). *P < 0.05, **P < 0.01 by unpaired two-tailed t test.
Figure 6
Figure 6
Liraglutide restores calcium flux and secretory impairments. A: (Top) Dynamic insulin secretion expressed as fold change over basal secretion of WFS1 SC islets stimulated with 11 mmol/L glucose, followed by an additional stimulation with 11 mmol/L glucose supplemented with 1 µmol/L liraglutide or (bottom) stimulated with 11 mmol/L glucose supplemented with IBMX (red) or liraglutide (blue) (n = 5). *P < 0.05, **P < 0.01 by unpaired two-tailed t test. B: Mean period (length of time between two peaks), active (length of time for each Ca2+ oscillation measured at half of the peak height, referred to as active duration), and silent duration (electrically silent “triggering” phase, which culminates in membrane depolarization) of oscillations, plateau fraction (which measures the proportion of time spent in active phase over a single period) in WFS1 β-cells following 11 mmol/L glucose stimulation, without or with 1 µmol/L liraglutide (n = 20 from two different in vitro differentiation protocols, represented by white and blue circles, respectively). *P < 0.05, **P < 0.01 by Mann-Whitney nonparametric test. C: Graphical representation of calcium oscillations in 15 WFS1 β-cells after stimulation with 11 mmol/L glucose supplemented with IBMX or liraglutide, followed by 30 mmol/L KCl. D: Mean coactivity coefficient (number of cells with similar peak profiles; n = 20). ***P < 0.001 by unpaired two-tailed t test. E: RT-qPCR analysis of the expression levels of CACNA1D and the SNARE complex-related genes SNAP25 and VAMP2 in WFS1 SC islets treated or not with 1 µmol/L liraglutide (n = 4). *P < 0.05 by unpaired one-tailed t test.
Figure 7
Figure 7
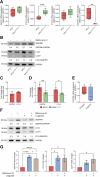
Abnormal autophagy is restored by liraglutide. A: Expression levels measured by RT-qPCR of BECN1, ATG10, ATG12, and SQSTM1 genes in WFS1 and WFS1wt/757A>T SC islets. GAPDH was used as housekeeping (n = 5). **P < 0.01, ***P < 0.001 by unpaired two-tailed t test. B: Representative immunoblot for analysis of SQSTM1 and LC3-II in WFS1 and WFS1wt/757A>T SC islets treated or not with 100 nmol/L bafilomycin A1 for 2 h. C: Levels of SQSTM1 and LC3-II normalized to GAPDH in WFS1 SC islets expressed as fold change over WFS1wt/757A>T SC islets. Data are reported as mean ± SD (n = 3). D: Levels of SQSTM1 and LC3-II normalized to GAPDH in WFS1 and WFS1wt/757A>T SC islets 2 h after 100 nmol/L bafilomycin treatment expressed as fold change over untreated cells. Data are reported as mean ± SD (n = 3). *P < 0.05, **P < 0.01 by paired two-tailed t test. E: RT-qPCR analysis of the expression levels of SQSTM1 in WFS1 SC islets before and after treatment with 1 µmol/L liraglutide (n = 4). *P < 0.05 by unpaired one-tailed t test. F: Representative immunoblot for analysis of SQSTM1 and LC3-II in WFS1 SC islets treated or not with 100 nmol/L bafilomycin A1 and/or 1 μmol/L liraglutide for 2 h. G: SQSTM1 and LC3-II levels normalized to GAPDH and the LC3-II/I ratio in WFS1 after liraglutide and/or bafilomycin A1 treatment are presented as fold changes relative to untreated WFS1 SC islets. Data are reported as mean ± SD (n = 3). *P < 0.05, ****P < 0.0001.
Figure 8
Figure 8
Liraglutide protects from stress and inflammation-induced apoptosis. A: Schematic summary of chronic treatment with 1 μmol/L liraglutide in WFS1 SC islets exposed either to TG for 16 h or to inflammatory cytokines (interferon [IFN]-γ, tumor necrosis factor [TNF]-α and interleukin [IL]-1β) for 48 h. B: Representative FACS plots for analysis of annexin V (Ann.V) and propidium iodide (PI)-stained WFS1 cells after treatment with TG or cytokines, in presence or not of liraglutide. Early and late apoptosis was measured as the percentage (%) of Ann.V and PI-positive cells, respectively, in WFS1 SC islets after exposure to TG (C) or cytokines (D), with or without chronic treatment with liraglutide. Data are expressed as mean ± SD (n = 3). **P < 0.01, ***P < 0.001 by two-way ANOVA with the Dunn-Šídák correction. E: Relative expression of ATF4, HSPA5, and PDIA4 genes in WFS1 SC islets, 16 h after TG exposure ± liraglutide, and estimation plot including the mean of difference of ATF4, HSPA5, and PDIA4 mRNAs following chronic treatment with liraglutide (n = 3). *P < 0.05 by one-tailed t test. F: Relative expression of ATF4, HSPA5, and PDIA4 genes in WFS1 SC islets, 48 h after proinflammatory cytokine exposure ± liraglutide, and estimation plot including the mean of difference of ATF4, HSPA5, and PDIA4 mRNAs following chronic treatment with liraglutide (n = 4). *P < 0.05 by one-tailed t test.

Similar articles

References

    1. Rigoli L, Bramanti P, Di Bella C, De Luca F. Genetic and clinical aspects of Wolfram syndrome 1, a severe neurodegenerative disease. Pediatr Res 2018;83:921–929 - PubMed
    1. Fonseca SG, Ishigaki S, Oslowski CM, et al. Wolfram syndrome 1 gene negatively regulates ER stress signaling in rodent and human cells. J Clin Invest 2010;120:744–755 - PMC - PubMed
    1. Takei D, Ishihara H, Yamaguchi S, et al. WFS1 protein modulates the free Ca(2+) concentration in the endoplasmic reticulum. FEBS Lett 2006;580:5635–5640 - PubMed
    1. Abreu D, Asada R, Revilla JMP, et al. Wolfram syndrome 1 gene regulates pathways maintaining beta-cell health and survival. Lab Invest 2020;100:849–862 - PMC - PubMed
    1. Osman AA, Saito M, Makepeace C, Permutt MA, Schlesinger P, Mueckler M. Wolframin expression induces novel ion channel activity in endoplasmic reticulum membranes and increases intracellular calcium. J Biol Chem 2003;278:52755–52762 - PubMed

MeSH terms