. 2025 Apr 9;82(1):151.
doi: 10.1007/s00018-025-05676-y.

Mutated sigma-1R disrupts cell homeostasis in dHMN patient cells

Affiliations

Mutated sigma-1R disrupts cell homeostasis in dHMN patient cells

Sofia Zanin et al. Cell Mol Life Sci. .

Abstract

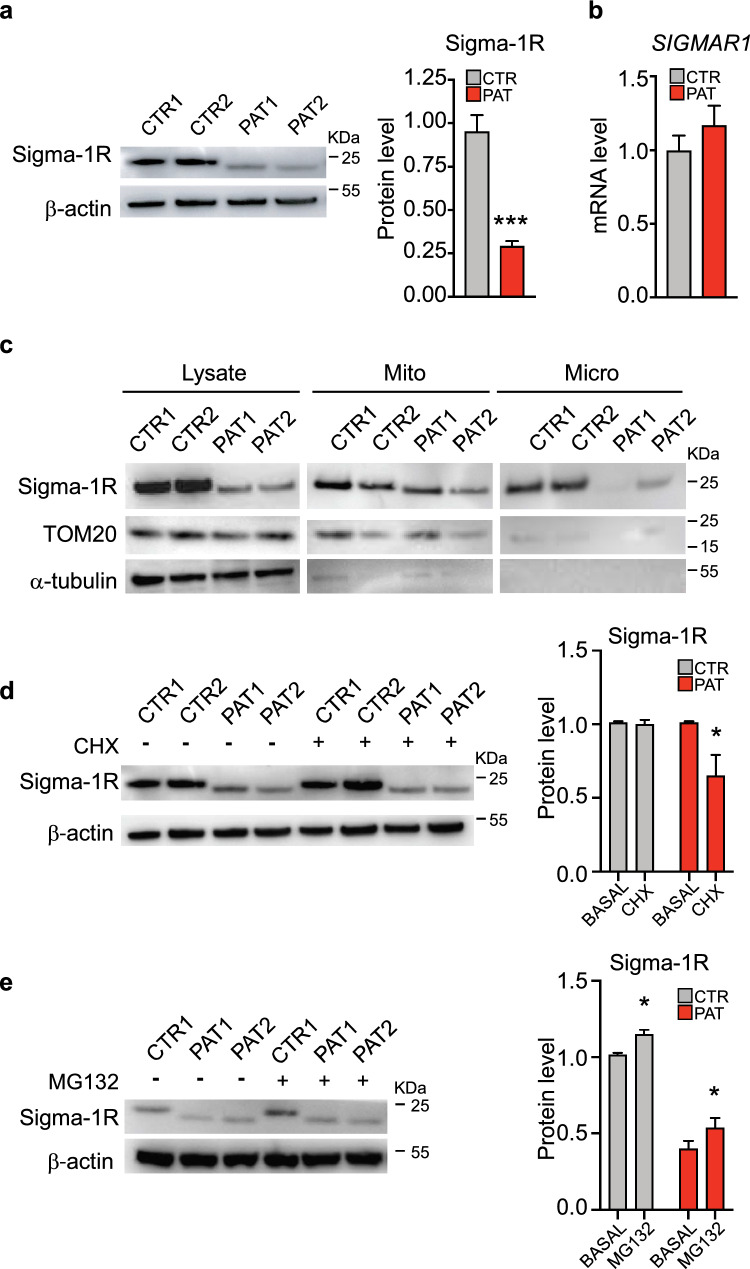
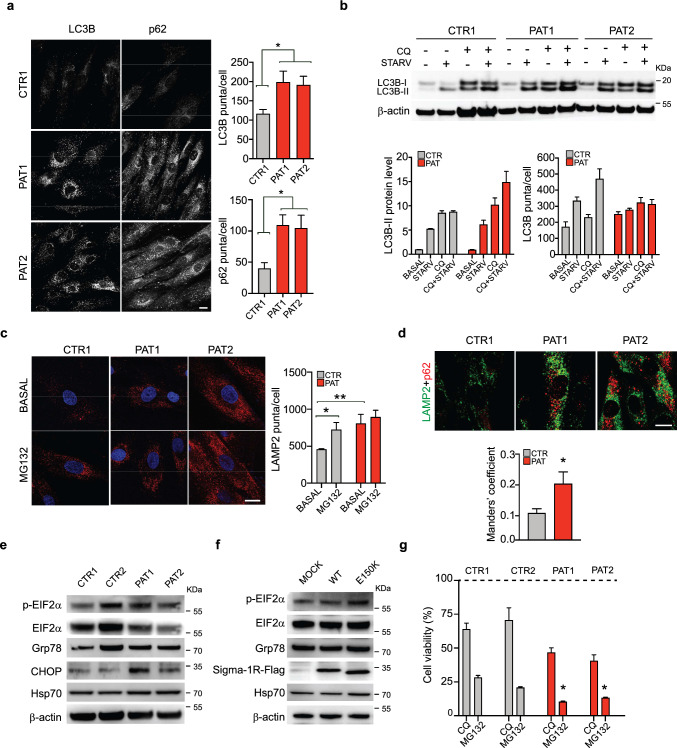
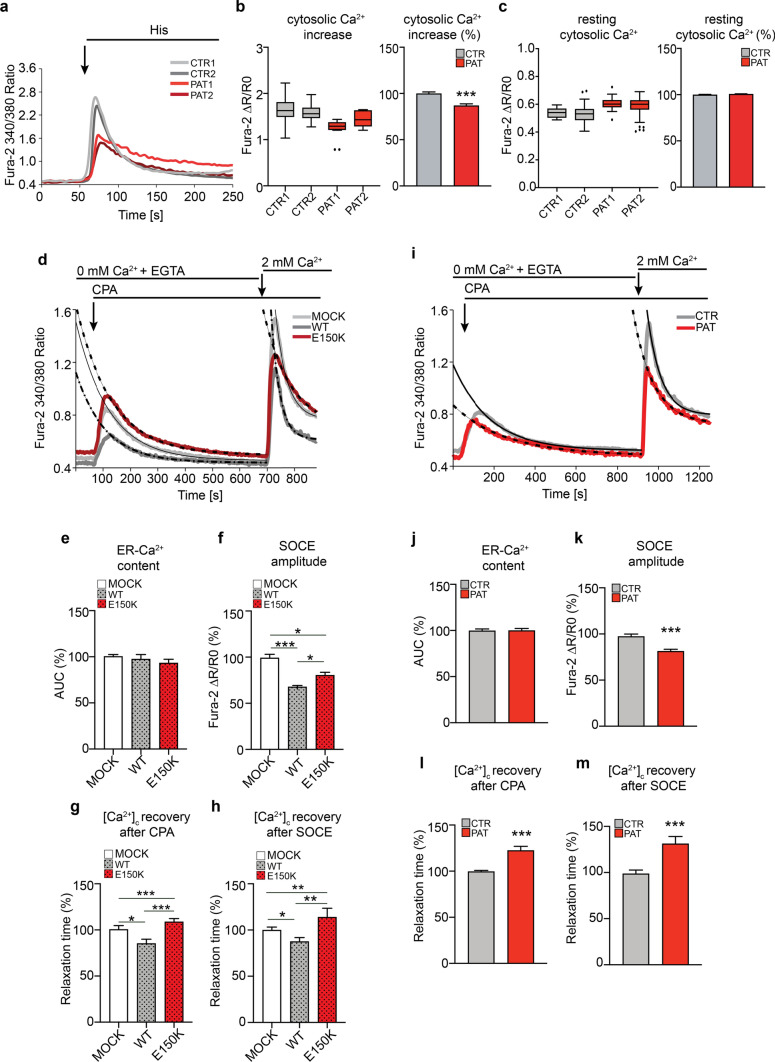
Hereditary-Motor-Neuropathies (dHMNs) are clinically and genetically heterogeneous neurological disorders characterized by degeneration of peripheral motoneurons. We previously identified two sigma-1 receptor (Sigma-1R) variants (p.E138Q; p.E150K) in dHMN Italian patients that behave as "loss-of-function" mutations in neuroblastoma cell lines. Here, we characterize the functional effects of Sigma-1R mutation in primary fibroblasts from homozygous patients bearing the E150K mutation, and matched controls, by performing biochemical, gene expression, immunofluorescence and Ca2+ imaging analysis. Our results show that Sigma-1R expression and distribution is significantly altered in patient fibroblasts. Moreover, patient cells present a general derangement of cell homeostasis as revealed by impairment of global Ca2+ dynamics, disorganization of the ER-mitochondria tethers, enhancement of the autophago-lysosomal pathway and blunting of mitochondrial aerobic metabolism compared to controls. These findings highlight the crucial role of Sigma-1R in the maintenance of cell and protein homeostasis, inter-organelle communication and intracellular Ca2+ signalling, supporting the notion that Sigma-1R is protective for motor neuron activity and its down-regulation and/or loss-of-function, as in the case of the E150K mutation, might play the key role in the neuronal degeneration in dHMN patients.

Keywords: Ca2+ signalling; Cellular proteostasis; ER-mitochondria contacts; Hereditary neuropathies; Sigma-1R.


Conflict of interest statement

Declarations. Conflict of interest: The authors have no relevant financial or non-financial interests to disclose. Ethics approval and consent to participate: This study was performed in line with the principles of the Declaration of Helsinki. The skin primary fibroblasts were achieved from selected patients after obtaining written consent to participate to the research study, according to the procedures of the Centre for Neuromuscular and Neurological Rare Diseases, S. Camillo Forlanini Hospital, Rome, Italy. Consent to publish: Not applicable.

Figures

Fig. 1
Fig. 1
Altered localization of Sigma-1R protein in dHMN patient fibroblasts. A, B Representative confocal images of Sigma-1R (in red) and the ER-marker calreticulin (A) (in green), or the mitochondrial marker TOM20 (B) (in green) immunofluorescence staining in primary skin fibroblasts from healthy donor (CTR1) and Sigma-1RE150K homozigous fibroblasts from dHMN patient (PAT1, PAT2). The graphs represent the colocalization of Sigma-1R to ER (A) or to mitochondria (B) expressed as Manders’ coefficient calculated for each individual (upper boxplot) or as average of the percentage relative to controls (bottom histogram). C Representative confocal images of Sigma-1R (in red) and GRP78 (in green) immunofluorescence staining in control (CTR) and dHMN patient (PAT1, PAT2) fibroblasts treated with vehicle (Basal) or with the Sigma-1R agonist SKF-10047 (10 μM) for 1 h. The graph represents the average Manders’ coefficients. D Representative confocal images of healthy donor (CTR) and dHMN patient (PAT1, PAT2) fibroblasts transfected with ER-targeted GFP (ER-GFP) or mitochondria-targeted RFP (mt-RFP) constructs, immunostained with Golgi specific antibody (GM130), or stained with fluorescent phalloidin to label F-actin (red). Hoechst is used to mark nuclei. E Representative immunostaining of TOM20 (in green) and calreticulin (in red) of cells as in A, B. The quantification of Manders’ coefficient is reported as in A, B. F Representative immunostaining of healthy donor (CTR1, CTR2) and dHMN patient (PAT1, PAT2) fibroblasts transfected with the ER-mitochondria-SPLICS probe. The graphs represent the quantification of SPLICS signal (puncta/cell) for each individual (left box plot) and as average percentage relative to control (right histogram). Data information: data of the box plot graphs reported in A–B and E–F are from at least ten confocal images and three independent experiments. Student’s t-test was used to assess statistical significance. Data are reported as mean ± SEM. *p < 0.05, ***p < 0.001. Scale bars = 10 μm
Fig. 2
Fig. 2
An increased turnover of Sigma-1RE150K protein is responsible of its reduced level in dHMN patient fibroblasts. A Representative immunoblotting and relative quantification of Sigma-1R protein level in fibroblast lysates from healthy individuals (CTR1, CTR2) and dHMN patients (PAT1, PAT2). β-actin is used as loading control. B The histogram represents the real-time PCR quantification of SIGMAR1 mRNA level in healthy individual (CTR) and dHMN patient (PAT) fibroblasts, normalized to Actb. C Representative immunoblotting of total lysate (Lysate), mitochondrial (Mito) and microsomal (Micro) protein fractions from cells as in A. TOM20 is used as marker of mitochondria, α-tubulin is used as loading control. D Representative immunoblotting and relative quantification of Sigma-1R protein level from cells as in A treated with vehicle (BASAL) or 5 μM cycloheximide (CHX) for 24 h. β-actin is used as loading control. E Representative immunoblotting and relative quantification of Sigma-1R protein level in lysates from control (CTR1) and patient (PAT1, PAT2) fibroblasts treated with vehicle (BASAL) or 1 μM MG-132 for 4 h. β-actin is used as loading control. Data information: data reported in A are from fifteen independent experiments. Data in B-E are from three independent experiments. Data are presented as mean ± SEM. *p < 0.05
Fig. 3
Fig. 3
Homozygous Sigma-1RE150K fibroblasts have enhanced authophagy-lysosomal and ER stress pathways. A Representative confocal images of LC3B and p62 immunostaining in control (CTR1) and patient (PAT1, PAT2) fibroblasts. The histograms report the average number of LC3B and p62 puncta per cell. B Representative immunoblotting of LC3B level in control (CTR1) and patient (PAT1, PAT2) fibroblasts in standard conditions or after 4 h of starvation in PBS (STARV), with or without chloroquine (CQ, 50 μM for 1 h). β-actin was used as loading control. The histograms report the quantification of LC3B-II immunoblot band intensity normalized for that of β-actin (left) and of the number of LC3B-positive autophagosomes per cell calculated from images in Supplementary Fig. S3. C Representative confocal images of LAMP2 immunostaining in control (CTR1) and patient (PAT1, PAT2) fibroblasts treated with or without the proteasome inhibitor MG-132 (1 μM, for 4 h). The histogram reports the average number of LAMP2 dots per cell. D Representative confocal images of LAMP2 (in green) and p62 (in red) immunostaining in control (CTR1) and patient (PAT1, PAT2) fibroblasts. The graph represents the colocalization of LAMP2 to p62 expressed as Manders’ coefficient. E, F Representative immunoblotting of the indicated ER-stress markers and of the Flag-tagged Sigma-1R protein in lysates from control (CTR1, CTR2) and patient (PAT1, PAT2) fibroblasts (E) or from HEK293T cells transfected with empty (MOCK), WT Sigma-1R-Flag or Sigma-1RE150K-Flag expressing constructs for 24 h (F). β-actin was used as loading control. G Cell viability measured by MTS assay in healthy individual (CTR1, CTR2) and patient (PAT1, PAT2) fibroblasts treated with or without chloroquine (CQ, 50 μM for 6 h) or MG-132 (2 μM for 24 h) expressed as percentage relative to non-treated cells. Data information: The results are representative of at least two (panels B, C and D), three (panels A and G), five (panels E and F) independent experiments. Data of the graphs reported in A, C and D are from at least 10 confocal images. Data are presented as mean ± SEM. *p < 0.05, **p < 0.01. Scale bars = 10 μm
Fig. 4
Fig. 4
Derangement of global intracellular Ca2+ handling in Sigma-1RE150K expressing fibroblasts. A Representative traces of cytosolic Ca2+ measurements with Fura-2AM in control (CTR) and dHMN patient (PAT) fibroblasts challenged with the ER-Ca2+-release agonist histamine (His 100 μM). B, C The graphs represent the quantification of the cytosolic Ca2+ levels for each individual expressed as Fura-2-AM ΔR/R0 values (box plots) or as average percentage of the ΔR/R0 relative to controls (histograms) after histamine stimulation (B) or in resting condition (C). D Representative traces of cytosolic Ca2+ measurements with Fura-2-AM in fibroblasts from healthy donor in Ca2+-free conditions, transfected with empty vector (MOCK), WT or Sigma-1RE150K constructs for 24 h. ER-Ca2+release was induced by CPA (5 μM) and SOCE triggered by addition of 2 mM Ca2+. Black lines represent the exponential fit of the cytosolic Ca2+ recovery after CPA or SOCE, respectively. E, H Histograms report the average of ER-Ca2+ content calculated as the area under the curve (AUC) after CPA addition (E), the SOCE amplitude after 2 mM Ca2+ addition (F), the rate of cytosolic Ca2+ ([Ca2+]c) recovery after CPA (G) and after SOCE (H) from experiments as in D and expressed as percentage relative to mock. See supplementary Fig. S4 A for the details of parameter calculations. I Representative traces of cytosolic Ca2+ measurements with Fura-2A-M in control and patient fibroblasts in Ca2+ free condition performed as in D. J, M Histograms report the average of ER-Ca2+ content calculated as the area under the curve (AUC) after CPA addition (J), the SOCE amplitude after 2 mM Ca2+ addition (K), the rate of cytosolic Ca2+ ([Ca2+]c) recovery after CPA (L) and after SOCE (M) from experiments as in (I) in control (CTR) and patient (PAT) fibroblasts. Data information: Data in B, C are from 11 independent experiments. Data in E–H are from three independent experiments. Data in J-M are from five independent experiments. See scheme in supplementary Fig. S4 A for the complete description of parameters used in E–H and J-M. Data are shown as the means ± SEM. Student’s t-test was used for statistical significance assessment. *P < 0.05 **P < 0.001, ***P < 0.0001. Black circles represent the outliers
Fig. 5
Fig. 5
Impairment of mitochondrial Ca2+ signaling and metabolism in dHMN fibroblasts. A Representative traces of mitochondrial Ca2+ measurements obtained with the 4mt-GCaMP6f indicator in control (CTR) and dHMN patient (PAT) fibroblasts challenged with histamine (His 100 µM). B, C The graphs represent the quantification of the mitochondrial Ca2+ level measured with the 4mt-GCaMP6f probe for each individual (box plots) or as average percentage relative to controls (histograms) in resting condition (expressed as 474/410 nm ratio, B) and after histamine stimulation (expressed as ΔR/R0, C). D Representative traces and relative quantification of the oxygen consumption rate (OCR) in healthy donor (CTR1, CTR2) and dHMN patient (PAT1, PAT2) fibroblasts. Oligomycin (O) is used to determine ATP synthesis-coupled respiration; the proton uncoupler carbonyl cyanide-4-(trifluoromethoxy)phenylhydrazone (FCCP) is used to determine the maximal and the spare respiratory capacity, and the respiratory complex I and III inhibitors rotenone and antimycin A (R + A) are used to determine non-mitochondrial respiration. E Measurement of the ATP-coupled respiration extracted from the OCR data presented in D. F Quantification of the extracellular acidification rate (ECAR). Data information: Data in B, C are from 5 independent experiments. Seahorse data are from three independent experiments. Data are reported as mean ± SEM values. ***P < 0.001. Black circles represent the outliers
Fig. 6
Fig. 6
The pleiotropic roles of Sigma-1R protein in the control of cell homeostasis and metabolism. Schematic representation of the role of Sigma-1R in the regulation of multiple aspects of cell homeostasis and metabolism (intracellular Ca2+ dynamics, ER-mitochondria contacts, Ca2+ entry from the extracellular environment, ER protein stabilization, mitochondrial metabolism, autophagy). ER endoplasmic reticulum, IP3R3 inositol 1,4,5-trisphosphate receptor type 3, MAM mitochondria-associated membranes; mito-Ca2+ mitochondrial Ca2+, SOCE store-operated Ca2+ entry

Similar articles

References

    1. Hayashi T, Su TP (2007) Sigma-1 receptor chaperones at the ER-mitochondrion interface regulate Ca(2+) signaling and cell survival. Cell 131:596–610. 10.1016/j.cell.2007.08.036 - PubMed
    1. Wu Z, Bowen WD (2008) Role of sigma-1 receptor C-terminal segment in inositol 1,4,5-trisphosphate receptor activation: Constitutive enhancement of calcium signaling in MCF-7 tumor cells. J Biol Chem 283:28198–28215. 10.1074/jbc.M802099200 - PMC - PubMed
    1. Renaudo A, Watry V, Chassot AA et al (2004) Inhibition of tumor cell proliferation by σ ligands is associated with K+ channel inhibition and p27kip1 accumulation. J Pharmacol Exp Ther 311:1105–1114. 10.1124/JPET.104.072413 - PubMed
    1. Kourrich S, Su TP, Fujimoto M, Bonci A (2012) The sigma-1 receptor: roles in neuronal plasticity and disease. Trends Neurosci 35:762–771. 10.1016/J.TINS.2012.09.007 - PMC - PubMed
    1. Kourrich S, Hayashi T, Chuang JY et al (2013) Dynamic interaction between sigma-1 receptor and Kv1.2 shapes neuronal and behavioral responses to cocaine. Cell 152:236–247. 10.1016/j.cell.2012.12.004 - PMC - PubMed

LinkOut - more resources