. 2025 Dec;16(1):2490208.
doi: 10.1080/21505594.2025.2490208. Epub 2025 Apr 9.

Staphylococcus aureus β-hemolysin impairs oxygen transport without causing hemolysis

Affiliations

Staphylococcus aureus β-hemolysin impairs oxygen transport without causing hemolysis

Qi Li et al. Virulence. 2025 Dec.

Abstract

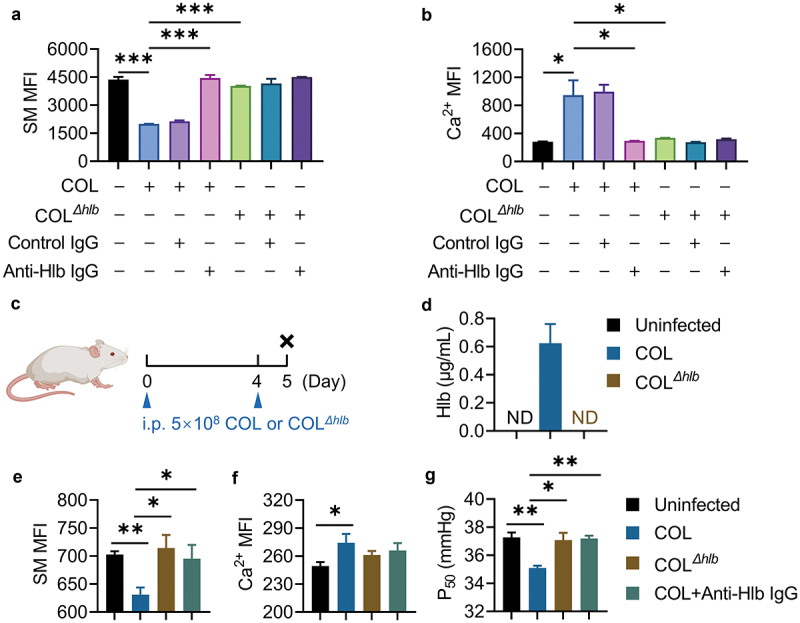
Staphylococcus aureus (S. aureus) infection can lead to the occurrence of hypoxia, however, the underlying mechanisms have not been fully elucidated. β-hemolysin (Hlb) induced hemolysis of red blood cells (RBCs) requires a temperature transition from "hot" to "cold," a phenomenon not observed under physiological conditions. In this study, we discovered that RBCs treated with Hlb exhibited a high level of intracellular Ca2+ and underwent a shape transformation from biconcave discoid to spherical, which was contingent upon the degradation of sphingomyelin of the cell membrane and led to impaired oxygen transport. The increase in intracellular Ca2+ levels induced by Hlb was dependent on the activation of the ion channel N-methyl-D-aspartate receptor. Furthermore, we found that Hlb-induced Ca2+ influx increased the cytoplasmic pH and subsequently attenuated the oxygen release from RBCs, which were also observed in both hlb transgenic mice and a murine model with S. aureus challenge. Our findings reveal a novel role for Hlb as sphingomyelinase in impairing RBC function under non-lytic conditions, shedding light on the mechanism behind hypoxia associated with S. aureus infection.

Keywords: RBC; S. aureus; oxygen release; sphingomyelinase; β-hemolysin.


Conflict of interest statement

No potential conflict of interest was reported by the author(s).

Figures

Figure 1.
Figure 1.
Hlb degrades SM in the outer leaflet of the cell membrane without causing RBC lysis at physiological temperature. a, Hemolytic ability of Hlb under 37°C for 5 min followed by 4°C for 5 min or 37°C for 10 min. b, Sphingomyelinase (SMase) activity of Hlb protein (100 ng/mL). c, Percentage of Venus-Lysenin positive sheep red blood cells (SRBCs) with or without 100 ng/mL Hlb treatment. d, Percentage of Venus-Lysenin positive SRBCs treated with different dose of Hlb and mutant protein treatment for 5 min. e, Hemolytic ability of Hlb and mutant protein under 37°C for 5 min followed by 4°C for 5 min. f, Heatmap of differentially SM quantitative value between Hlb-treated and control SRBCs (n = 6). G, Heatmap of differentially ceramide quantitative value between Hlb-treated and control SRBCs (n = 6). The data are representative of two or three independent experiments and shown as the mean± s.e.m., **p < 0.01, ***p < 0.005, unpaired two-tailed Student’s t-test or one-way ANOVA followed by post hoc Tukey’s test.
Figure 2.
Figure 2.
Hlb promotes Ca2+ influx dependent of its SMase activity. a, Dynamic curves (left panel) and area under curve (AUC, right panel) of Ca2+ levels in SRBCs with Hlb and mutant protein treatment for 5 min. b, Mean fluorescence intensity (MFI) of Ca2+ levels in Hlb-treated SRBCs with or without EGTA. c, Representative cytometric images of Hlb-treated SRBCs with or without EGTA (left panel) and percentage of Hlb-treated Venus-Lysenin positive SRBCs with or without EGTA (right panel). d, Representative high-content images of 50 ng/mL Hlb and mutant protein-treated SRBCs at the indicated time. Scale bar = 10 μm. SRBCs were incubated with 1 μM Calbryte™ 630 AM and 2 μg/mL Venus-Lysenin. e, MFI of Venus-Lysenin (Green) and Ca2+ levels (Orange) in SRBCs with Hlb treatment for 5 min. f, MFI of Venus-Lysenin (Green) and Ca2+ levels (Orange) in SRBCs with HlbH288N treatment for 5 min. g, Percentage of Hlb-treated Venus-Lysenin positive SRBCs with exogenous SM supplementation. h, MFI of Ca2+ levels in Hlb-treated SRBCs with exogenous SM supplementation. i, Percentage of Hlb-treated Venus-Lysenin positive SRBCs with control IgG or anti-Hlb IgG pre-incubation. j, MFI of Ca2+ levels in Hlb-treated SRBCs with control IgG or anti-Hlb IgG pre-incubation. *p < 0.05, ***p < 0.005, one-way ANOVA followed by post hoc Tukey’s test.
Figure 3.
Figure 3.
The Ca2+ influx promoted by Hlb is dependent on the activation of NMDAR, which functions as a Ca2+-permeable channel. a, Mean fluorescence intensity (MFI) of Ca2+ levels in Hlb-treated human red blood cells (HRBCs) preincubated with DMSO, 0.1 mM DIDS, 0.1 mM GsMTx4, 0.1 mM MK-801 or 0.1 mM SAR7334 for 30 min. b, MFI of Ca2+ levels in Hlb-treated HRBCs preincubated with 0.1, 0.2, 0.4 mM MK-801 for 30 min. c, Representative immunoblot images of NMDAR1 in HRBCs with Hlb or HlbH288N treatment. d, Relative MFI of Ca2+ levels in Hlb-treated SH-SY5Y cells preincubated with 0.4 mM MK-801 for 30 min followed by 1 μg/mL Hlb treatment for 5 min. MFI of untreated cells (control) was set as 100%. e, Relative MFI of Ca2+ levels in GRIN1 knockdown SH-SY5Y cells. Cells were treated with 1 μg/mL Hlb treatment for 5min. MFI of untreated cells (control) was set as 100%. f, Relative MFI of Ca2+ levels in Hlb-treated THP-1 cells preincubated with 0.4 mM MK-801 for 30 min followed by 1 μg/mL Hlb treatment for 5 min. MFI of untreated cells (control) was set as 100%. g, Relative MFI of Ca2+ levels in GRIN1 knockdown THP-1 cells. Cells were treated with 1 μg/mL Hlb treatment for 5 min. MFI of untreated cells (control) was set as 100%. The data are representative of two or three independent experiments and shown as the mean±s.e.m., *p < 0.05, **p < 0.01, ***p < 0.005, unpaired two-tailed Student’s t-test or one-way ANOVA followed by post hoc Tukey’s test.
Figure 4.
Figure 4.
Ca2+ influx induced by Hlb influences the oxygen release capacity while SM degradation alters the shape of RBCs. a, Oxygen dissociation curve of SRBCs with Hlb, HlbH288N, Hlb+EGTA or A23187 treatment (left panel) and P50 value of SRBCs with Hlb, HlbH288N, Hlb + EGTA or A23187 treatment (right panel). b, Oxygen dissociation curve of Hlb-treated SRBCs with or without MK-801 preincubation (left panel) and P50 value of Hlb-treated SRBCs with or without MK-801 preincubation (right panel). c, Cytoplasmic pH value of Hlb, HlbH288N, Hlb+EGTA or A23187-treated SRBCs. d, Cytoplasmic pH value of SRBCs. SRBCs were preincubated with MK-801 followed by 50 ng/mL Hlb for 5 min. e, Representative cytometric images of Hlb-treated and control SRBCs. f, Representative transmission electron microscope (TEM) images of Hlb-treated and control SRBCs. Scale bar = 2 μm. g, Live cell imaging (left panel) and the diameter (right panel) of Hlb, HlbH288N, Hlb+EGTA or A23187-treated SRBCs at the indicated time. Scale bar = 5 μm. h, Osmotic fragility of SRBCs treated with Hlb, HlbH288N, Hlb+EGTA or A23187. i, Osmotic fragility of Hlb-treated SRBCs with or without MK-801 preincubation. The data are representative of two or three independent experiments and shown as the mean ± s.e.m., *p < 0.05, **p < 0.01, ***p < 0.005, unpaired two-tailed Student’s t-test.
Figure 5.
Figure 5.
Hlb transgenic mice exhibit decreased SM content and increased Ca2+ levels in RBCs. a, Schematic diagram of Hlb transgenic mice (hlbtrans) construction strategy. b, Serum levels of Hlb in hlbtrans and control mice. ND, not detected. c, Mean fluorescence intensity (MFI) of SM levels in RBCs from hlbtrans and control mice. d, MFI of Ca2+ levels in RBCs from hlbtrans and control mice. e, Oxygen dissociation curve (left panel) and P50 value of RBCs in hlbtrans or control mice (right panel). f, Osmotic fragility of RBCs from hlbtrans and control mice. The data are shown as the mean±s.e.m., n = 3 per group, *p < 0.05, **p < 0.01, ***p < 0.005, unpaired two-tailed Student’s t-test.
Figure 6.
Figure 6.
Challenge with S. aureus leads to decreased oxygen release in vivo. a, Mean fluorescence intensity (MFI) of SM levels of SRBCs treated with the supernatant of COL or COLΔhlb. b, MFI of Ca2+ levels of SRBCs treated with the supernatant of COL or COLΔhlb. c, Schematic diagram of S. aureus challenge model. d, Serum levels of Hlb in S. aureus COL or COLΔhlb strain-infected mice. ND, not detected. E, MFI of SM levels in RBCs from S. aureus COL or COLΔhlb strain-infected mice. F, MFI of Ca2+ levels in RBCs from S. aureus COL or COLΔhlb strain-infected mice. G, P50 value of RBCs from S. aureus COL or COLΔhlb strain-infected mice. The data are representative of two or three independent experiments and shown as the mean ± s.e.m., n = 3 per group, *p < 0.05, **p < 0.01, ***p < 0.005, unpaired two-tailed Student’s t-test.
Figure 7.
Figure 7.
A proposed scheme for oxygen transport regulated by Hlb in RBCs. Hlb secreted from S. aureus promoted Ca2+ influx and led to an increase in cytoplasmic pH, which subsequently inhibited the release of O2. Meanwhile, Hlb induced the transformation of RBCs into spherocytes. These concerted effects of Hlb on RBCs might disrupt the primary function of O2 transport, potentially contributing hypoxic conditions during S. aureus infection.

Similar articles

References

    1. Thammavongsa V, Kim HK, Missiakas D, et al. Staphylococcal manipulation of host immune responses. Nat Rev Microbiol. 2015;13(9):529–16. doi: 10.1038/nrmicro3521 - DOI - PMC - PubMed
    1. Howden BP, Giulieri SG, Wong Fok Lung T, et al. Staphylococcus aureus host interactions and adaptation. Nat Rev Microbiol. 2023;21:380–395. - PMC - PubMed
    1. Tam K, Torres VJ.. Staphylococcus aureus secreted toxins and extracellular enzymes. Microbiol Spectr. 2019;7:GPP3–0039–2018. - PMC - PubMed
    1. Kuhn V, Diederich L, TCSt K, et al. Red blood cell function and dysfunction: redox regulation, nitric oxide metabolism, anemia. Antioxid Redox Signal. 2017;26(13):718–742. doi: 10.1089/ars.2016.6954 - DOI - PMC - PubMed
    1. Musher DM, Alexandraki I, Graviss EA, et al. Bacteremic and nonbacteremic pneumococcal pneumonia. A prospective study. Medicine (Baltimore). 2000;79(4):210–221. doi: 10.1097/00005792-200007000-00002 - DOI - PubMed

Publication types

MeSH terms

Associated data

LinkOut - more resources