. 2025 Apr 15;39(7):e70497.
doi: 10.1096/fj.202403271R.

Novel in vivo models of autosomal optic atrophy reveal conserved pathological changes in neuronal mitochondrial structure and function

Affiliations

Novel in vivo models of autosomal optic atrophy reveal conserved pathological changes in neuronal mitochondrial structure and function

Elin L Strachan et al. FASEB J. .

Abstract

Autosomal optic atrophy (AOA) is a form of hereditary optic neuropathy characterized by the irreversible and progressive degermation of the retinal ganglion cells. Most cases of AOA are associated with a single dominant mutation in OPA1, which encodes a protein required for fusion of the inner mitochondrial membrane. It is unclear how loss of OPA1 leads to neuronal death, and despite ubiquitous expression appears to disproportionately affect the RGCs. This study introduces two novel in vivo models of OPA1-mediated AOA, including the first developmentally viable vertebrate Opa1 knockout (KO). These models allow for the study of Opa1 loss in neurons, specifically RGCs. Though survival is significantly reduced in Opa1 deficient zebrafish and Drosophila, both models permit the study of viable larvae. Moreover, zebrafish Opa1 KO larvae show impaired visual function but unchanged locomotor function, indicating that retinal neurons are particularly sensitive to Opa1 loss. Proteomic profiling of both models reveals marked disruption in protein expression associated with mitochondrial function, consistent with an observed decrease in mitochondrial respiratory function. Similarly, mitochondrial fragmentation and disordered cristae organization were observed in neuronal axons in both models highlighting Opa1's highly conserved role in regulating mitochondrial morphology and function in neuronal axons. Importantly, in Opa1 deficient zebrafish, mitochondrial disruption and visual impairment precede degeneration of RGCs. These novel models mimic key features of AOA and provide valuable tools for therapeutic screening. Our findings suggest that therapies enhancing mitochondrial function may offer a potential treatment strategy for AOA.

Keywords: Drosophila; mitochondria; optic atrophy; visual impairment; zebrafish.


Conflict of interest statement

The authors declare that the research was conducted in the absence of any commercial or financial relationships that could be construed as a potential conflict of interest.

Figures

FIGURE 1
FIGURE 1
Generation and validation of 2 in vivo models of Opa1 deficiency. (A) Schematic illustrating the localisation and range of functions of Opa1. (B) Dendrogram showing similarity between human, mouse, zebrafish and Drosophila Opa1 proteins generated following Clustal alignment. Percentage identities of the amino acid sequence of OPA1 of the respective model organisms to the canonical isoform of human OPA1 are shown. (C) Expression of opa1 in the zebrafish retina from online scRNA‐seq data https://proteinpaint.stjude.org/F/2019.retina.scRNA.html. Red marks cells with opa1 expression (RGC indicated with red arrowhead). (D) Amino acid sequence of exons 8 and 9 of the Opa1 gene in human, mouse, zebrafish and Drosophila. (E) Schematics illustrating the guide locations of the guide pair (scissors) and PCR primers (arrows) used to generate opa1 editing in zebrafish. (F) A representative PCR genotyping electrophoresis gel from individual larvae injected with opa1 guides with (Deletion) or without (WT) a deletion event. NHEJ produces a deletion band of approximately 350 bp (black arrow). (G, H) Graphs represent mean ± standard deviation (SD) mRNA (G) and protein (H) Opa1 expression in buffer injected controls and opa1 crispant larvae. Statistical analysis consists of two‐tailed t‐tests. n = 3–4. (I) Schematic illustrates the crossing strategy to generate neuronal Opa1 KO Drosophila. (J, K) Graphs represent mean ± standard deviation (SD) mRNA (J) and protein (K) Opa1 expression in progeny of elav‐GAL4.UAS‐Cas9 crossed to either w 1118 (control) or Opa1 sgRNA (Opa1 neuronal KO) flies. Statistical analysis consists of two‐tailed t‐tests. n = 4–6.
FIGURE 2
FIGURE 2
Loss of Opa1 impairs visual function in zebrafish. (A) Schematic of OKR assays which were used to assess visual function in <131 hpf larvae. No gross morphology differences are distinguished between opa1 crispants and buffer injected controls. (B–D) Visual acuity responses of <131 hpf opa1 crispants and controls to drums with 0.2 (B) and 0.02 (C) cycles per degree (cpd) and 0.2 cpd with reduced (20%) black/ white contrast (D). (E) A representative PCR genotyping electrophoresis gel from opa1 +/+, opa1 +/− and opa1 −/− larvae. opa1 mutation produces a 932 bp deletion band. No gross morphological differences were observed between opa1 −/− animals and opa1 +/+ siblings. (F) qPCR shows a significant reduction of opa1 transcript (normalized to B‐Actin) in both opa1 −/− and opa1 +/− animals. (G, H) Visual acuity responses of <131 hpf opa1 +/+, opa1 +/− and opa1 −/− larvae to drums with 0.2 (G) and 0.02 (H) cycles per degree. All graphs represent mean ± standard deviation (SD) saccades per minute. Statistical analysis consists of one‐way ANOVA and Tukey's multiple comparisons tests.
FIGURE 3
FIGURE 3
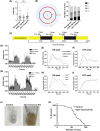
Nonvisual phenotypes in Opa1 deficiency models. (A) Graph represents mean ± standard deviation (SD) number of spontaneous tail coiling movements in 30 s in 24 hpf larvae. No significance (ns) detected by Krustal‐Wallis test. (B) Schematic illustrating the apparatus used for a touch response assay. Graph represents the number of 125 hpf larvae that swim the indicated distance from the starting point in response to a gentle tap on the tail. (C) Schematic illustrating the periods used for activity recording in VMR assays. Black and yellow bars indicate dark and light conditions, respectively. (D–I) Results of VMR assays involving opa1 loss of function zebrafish. No significance was detected by Krustal Wallis test. Activity traces showing activity over the course of an entire VMR assay (100 min) in <131 hpf opa1 crispant (D) and opa1 −/− (G) larva compared to relevant controls. Average ON peak activity for both on peaks in opa1 crispant (E) and opa1 −/− (H) larvae and controls. Average OFF peak activity for both peak periods in opa1 crispant (F) and opa1 −/− (I) larvae and controls. (J) Stills from videos of progeny of elav‐GAL4.UAS‐Cas9 crossed to either w 1118 (control) or Opa1 sgRNA (Opa1 neuronal KO) flies. (K) Graph represents % survival of Opa1 neuronal KO and control flies. n = 179–247 flies per genotype. p‐value < .0001 determined by Log‐rank (Mantel‐Cox) test.
FIGURE 4
FIGURE 4
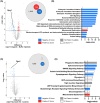
Loss of Opa1 causes disruption of mitochondrial proteins in both Drosophila and zebrafish. (A) Volcano plot depicts the differentially expressed proteins between opa1 crispants and buffer injected controls. The proteins highlighted in red represent the proteins with a Student's t‐test difference ≥0.5. The proteins highlighted in blue represent those with a Student's t‐test difference ≤−0.5. Opa1 is highlighted. Venn diagram (right panel) shows proportion of up‐ (red) and down‐ (blue) regulated proteins between opa1 crispants and buffer injected controls. (B) Ingenuity pathway analysis (IPA) of differentially expressed proteins identified by proteomic analysis of opa1 crispants and buffer injected controls, showing the most enriched pathways identified. (C) Volcano plot depicts the differentially expressed proteins between progeny of elav‐GAL4.UAS‐Cas9 crossed to either w 1118 (control) or Opa1 sgRNA (Opa1 neuronal KO) flies. The proteins highlighted in red represent the proteins with a Student's t‐test difference ≥0.5. The proteins highlighted in blue represent those with a Student's t‐test difference ≤−0.5. Opa1 is highlighted. Venn diagram (right panel) shows proportion of up‐ (red) and down‐ (blue) regulated proteins between Opa1 neuronal KO and controls. (D) Ingenuity pathway analysis (IPA) of differentially expressed proteins identified by proteomic analysis of Opa1 neuronal KO and controls, showing the most enriched pathways identified.
FIGURE 5
FIGURE 5
Most significantly altered proteins identified by proteomic profiling in Opa1 loss of function models. (A) Tables show the 10 most up‐ (upper panel) and down‐ (lower panel) regulated proteins in opa1 crispants compared to buffer‐injected controls. (B) Tables show the 10 most up‐ (upper panel) and down‐ (lower panel) regulated proteins in progeny of elav‐GAL4.UAS‐Cas9 crossed to either w 1118 (control) or Opa1 sgRNA (Opa1 neuronal KO) flies.
FIGURE 6
FIGURE 6
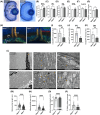
Loss of Opa1 disrupts mitochondrial morphology within RGC axons in zebrafish. (A–F) Cellular lamination is comparable in opa1−/− larvae and opa1+/+ siblings. (A) Representative images of toluidine blue stained retinal sections from <131 hpf zebrafish. Retinal layers indicated. Graphs represent mean ± SD thickness in μm of GCL (B), IPL (C), INL (D), ONL (E) and total area (μm2) of the Lens (F). (G) Graph represents mean ± SD number of RGC nuclei. (H–K) mitoEGFP staining is significantly decreased in opa1 −/− larvae compared to opa1 +/+ siblings. (H) Representative confocal image of wholemount retinas of <131 hpf Tg(isl2b:MitoeGFP‐2ATagRFPCAAX) zebrafish. Graphs represent mean ± standard deviation (SD) mitoEGFP intensity within the GCL (I), IPL (J) and ON (K). Statistical analysis throughout consists of two‐tailed t‐tests. (L–P) Mitochondrial organization is significantly disrupted in opa1 −/− larvae compared to opa1 +/+ siblings. (L) Representative electron microscopic images of the optic nerve of <131 hpf larval zebrafish. Graphs represent mean ± SD length of longest mitochondrial axis (M), total mitochondrial area (N) mitochondrial circularity (O) and % mitochondrial matrix occupied by cristae (P). Graphs show data from individual mitochondria with statistical analysis performed by Mann Whitney tests (n = 226–345).
FIGURE 7
FIGURE 7
Altered mitochondrial morphology within motor neuron axons in Opa1 neuronal KO Drosophila. (A) Representative confocal images of mitochondria (green) within motor neuron axons. Larvae are progeny of UAS‐Cas9;d42GAL4.UAS‐mitoGFP flies crossed to w 1118 (control) or Opa1 sgRNA (Opa1 neuronal KO) flies. Graphs represent mean ± SD mitochondrial size (B) and circularity (C). Statistics consist of two‐tailed t‐tests.
FIGURE 8
FIGURE 8
Analysis of mitochondrial respiration in an in vivo model of optic atrophy. (A) Schematic outlining the Mito Stress Test conducted in this study. Oxygen consumption rate (OCR) is measured prior to and following the additions of the ATP synthase inhibitor oligomycin, the uncoupling agent FCCP, and finally the inhibitors of complex I and III, rotenone and antimycin A (respectively). (B) OCR profiles of non‐injected control, buffer injected control, and Opa1 crispant <131 hpf larvae. (C–G) Graphs represent the mean ± SD OCR for the calculated basal respiration (C), ATP production (D), maximal respiration (E), non‐mitochondrial respiration (F) and proton leak (G). Statistical analysis throughout consists of one‐way ANOVA and Tukey's multiple comparisons tests.

References

    1. Toomes C, Marchbank NJ, Mackey DA, et al. Spectrum, frequency and penetrance of OPA1 mutations in dominant optic atrophy. Hum Mol Genet. 2001;10(13):1369‐1378. - PubMed
    1. Yu‐Wai‐Man P, Chinnery PF. Dominant optic atrophy: novel OPA1 mutations and revised prevalence estimates. Ophthalmology. 2013;120(8):1712.e1711. - PMC - PubMed
    1. Arruti N, Rodríguez‐Solana P, Nieves‐Moreno M, et al. OPA1 dominant optic atrophy: diagnostic approach in the pediatric population. Curr Issues Mol Biol. 2023;45(1):465‐478. - PMC - PubMed
    1. Yu‐Wai‐Man P, Griffiths PG, Burke A, et al. The prevalence and natural history of dominant optic atrophy due to OPA1 mutations. Ophthalmology. 2010;117(8):1538‐1546.e1531. - PMC - PubMed
    1. Han J, Li Y, You Y, Fan K, Lei B. Autosomal dominant optic atrophy caused by six novel pathogenic OPA1 variants and genotype‐phenotype correlation analysis. BMC Ophthalmol. 2022;22(1):322. - PMC - PubMed

MeSH terms

LinkOut - more resources