

Trends and disparities in ischemic stroke mortality and location of death in the United States: A comprehensive analysis from 1999-2020
- PMID: 40202955
- PMCID: PMC11981169
- DOI: 10.1371/journal.pone.0319867
Trends and disparities in ischemic stroke mortality and location of death in the United States: A comprehensive analysis from 1999-2020
Erratum in
-
Correction: Trends and disparities in ischemic stroke mortality and location of death in the United States: A comprehensive analysis from 1999-2020.PLoS One. 2026 Jan 27;21(1):e0341830. doi: 10.1371/journal.pone.0341830. eCollection 2026. PLoS One. 2026. PMID: 41592056 Free PMC article.
Abstract
Background: Stroke remains the fifth leading cause of mortality in the United States, with significant geographical and racial disparities in outcomes. Understanding trends in location of death for ischemic stroke patients is crucial for improving end-of-life care and addressing healthcare inequities.
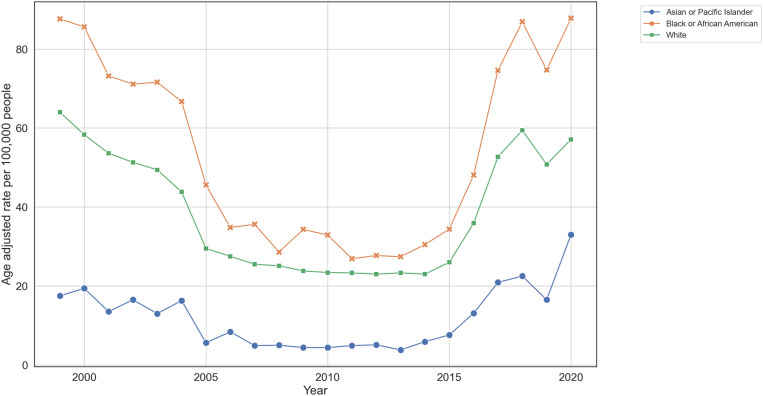
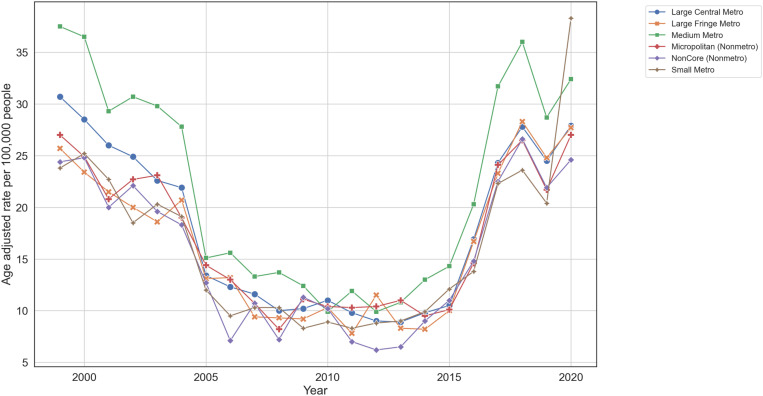
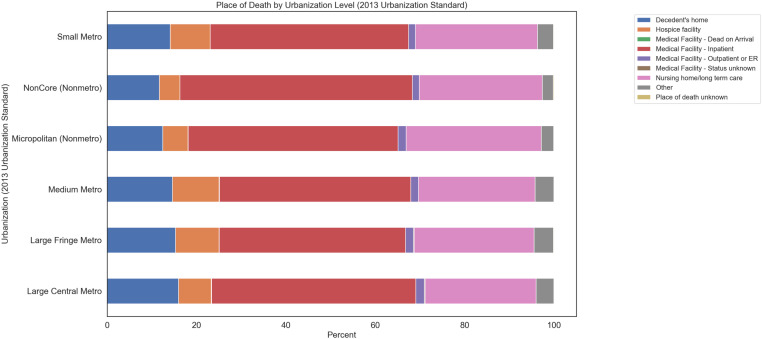
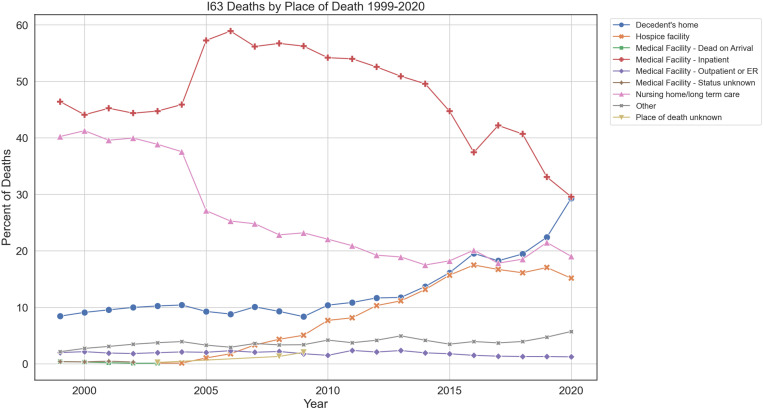
Methods & findings: This retrospective study used Centers for Disease Control and Prevention's Wide-ranging Online Data for Epidemiologic Research (CDC WONDER) data to examine ischemic stroke mortality, stratified by urbanization level and race. Age-adjusted mortality rates were calculated using the 2000 US standard population. Age-adjusted ischemic stroke mortality rates increased across all urbanization levels since 2009, with the most pronounced rises in non-metropolitan areas. An increasing proportion of deaths occurred at home, shifting from inpatient medical facilities. Significant disparities were observed in access to specialized end-of-life stroke care, particularly for racial minorities and rural residents. Black/African American individuals and those in rural settings were more likely to die in less specialized environments due to healthcare access barriers.
Conclusions: The findings highlight a critical shift in the patterns of mortality and end-of-life care preferences among ischemic stroke patients over the past two decades. These findings highlight significant shifts in the patterns of mortality and location of death among ischemic stroke patients over the past two decades, with notable differences across urbanization levels and racial groups. The increasing proportion of home deaths and persistent disparities in location of death suggest a need for further research to understand the underlying factors driving these trends and their implications for end-of-life care quality and access.
Copyright: © 2025 Lim et al. This is an open access article distributed under the terms of the Creative Commons Attribution License, which permits unrestricted use, distribution, and reproduction in any medium, provided the original author and source are credited.
Conflict of interest statement
Dr. Michael R. Levitt has received unrestricted educational grants from Medtronic and Stryker; has consulting agreements with Aeaean Advisers, Metis Innovative, Genomadix, AIDoc and Arsenal Medical; holds equity interest in Proprio, Stroke Diagnostics, Apertur, Stereotaxis, Fluid Biomed, Synchron and Hyperion Surgical; serves on the editorial board of Journal of NeuroInterventional Surgery; and is on the Data Safety Monitoring Board of Arsenal Medical. These competing interests do not alter our adherence to PLOS ONE policies on sharing data and materials, as there are no patents or products related to this submission.
Figures
References
-
- Murphy S, Kochanek K, Xu J, Arias E. Mortality in the United States, 2020 key findings data from the national vital statistics system; 2021. Available from: https://www.cdc.gov/nchs/data/databriefs/db427.pdf
-
- Emberson J, Lees KR, Lyden P, Blackwell L, Albers G, Bluhmki E, et al. Effect of treatment delay, age, and stroke severity on the effects of intravenous thrombolysis with alteplase for acute ischaemic stroke: a meta-analysis of individual patient data from randomised trials. Lancet. 2014;384(9958):1929–35. Available from: https://www.sciencedirect.com/science/article/pii/S0140673614605845 - PMC - PubMed
-
- Mokdad A, Ballestros K, Echko M, Glenn S, Olsen H, Mullany E. The state of US health, 1990-2016. JAMA. 2018;319(14):1444. Available from: https://jamanetwork.com/journals/jama/fullarticle/2678018 - PMC - PubMed
MeSH terms
LinkOut - more resources
Full Text Sources
Medical
Miscellaneous
