. 2025 Apr 9;21(4):e1011247.
doi: 10.1371/journal.pgen.1011247. eCollection 2025 Apr.

Condensin IDC, DPY-21, and CEC-4 maintain X chromosome repression in C. elegans

Affiliations

Condensin IDC, DPY-21, and CEC-4 maintain X chromosome repression in C. elegans

Jessica Trombley et al. PLoS Genet. .

Abstract

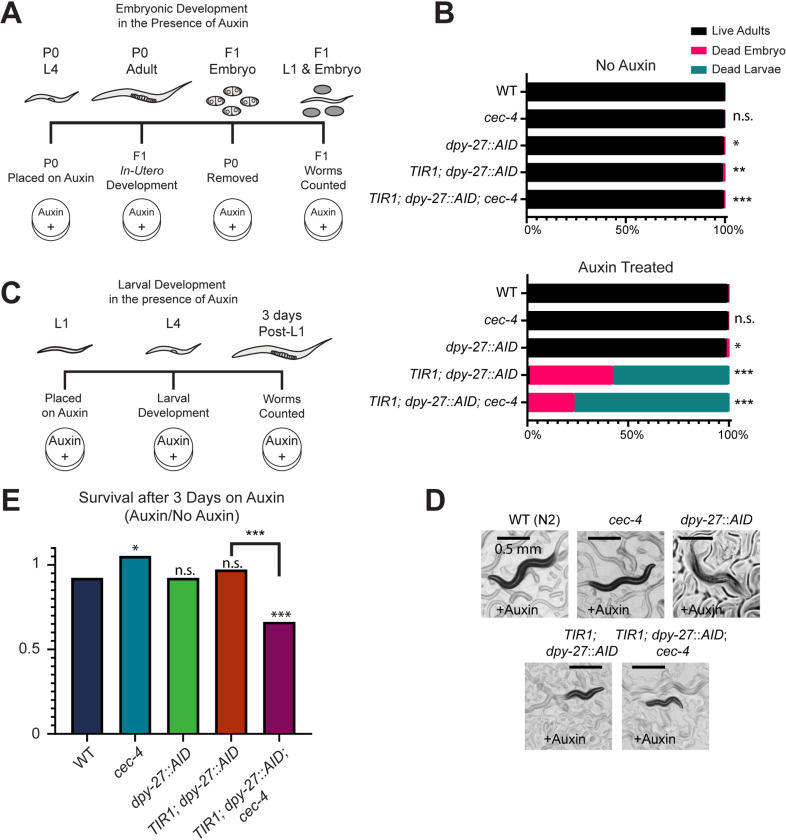
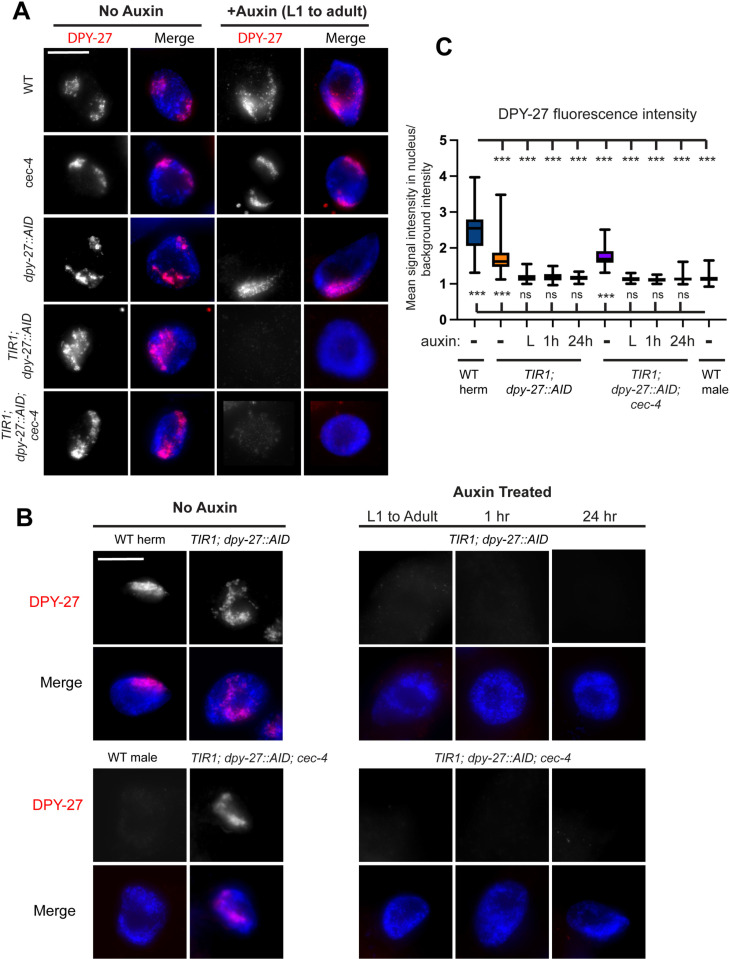
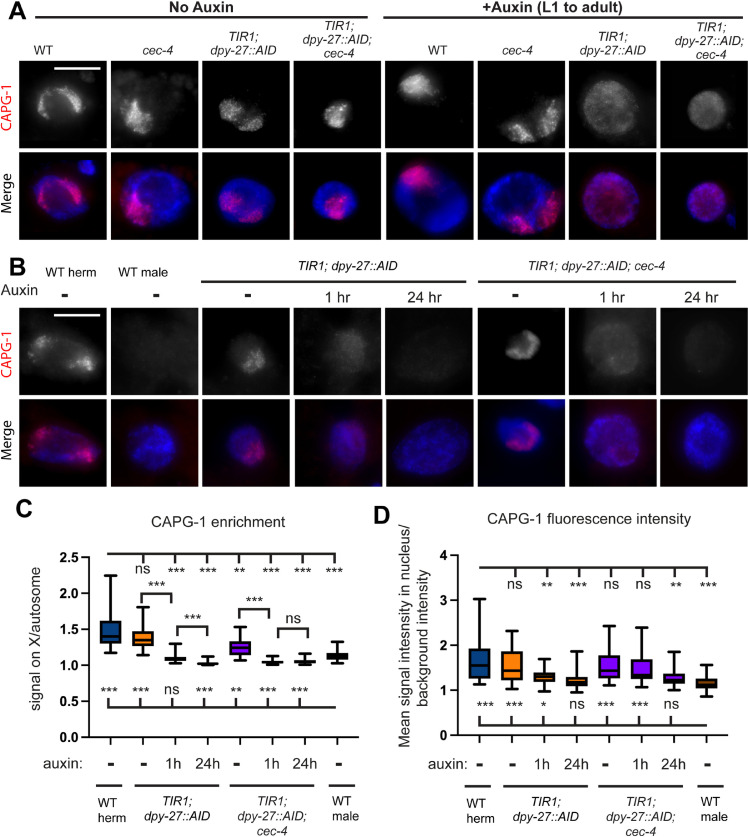
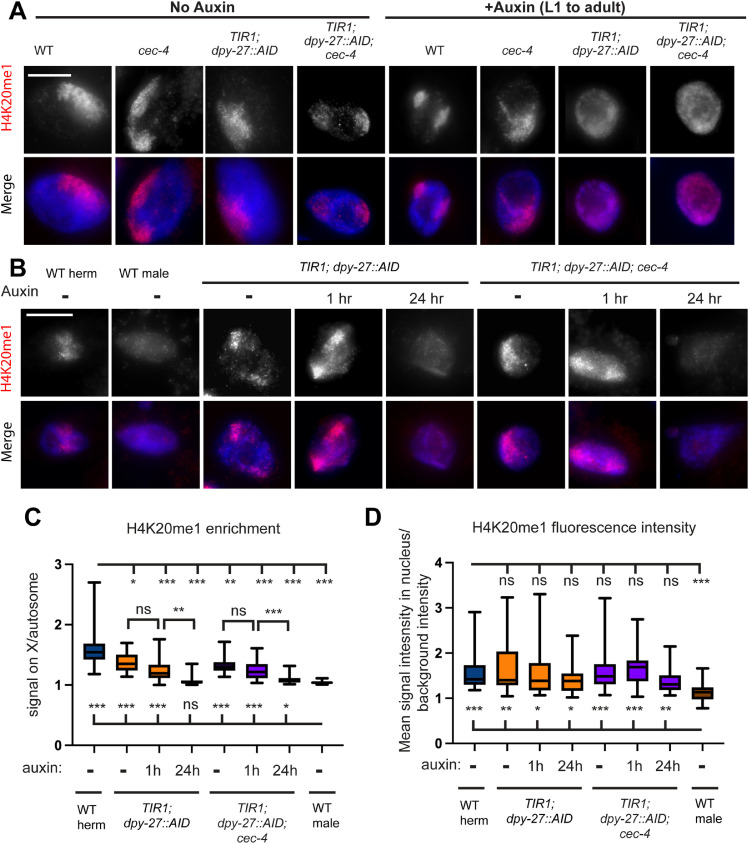
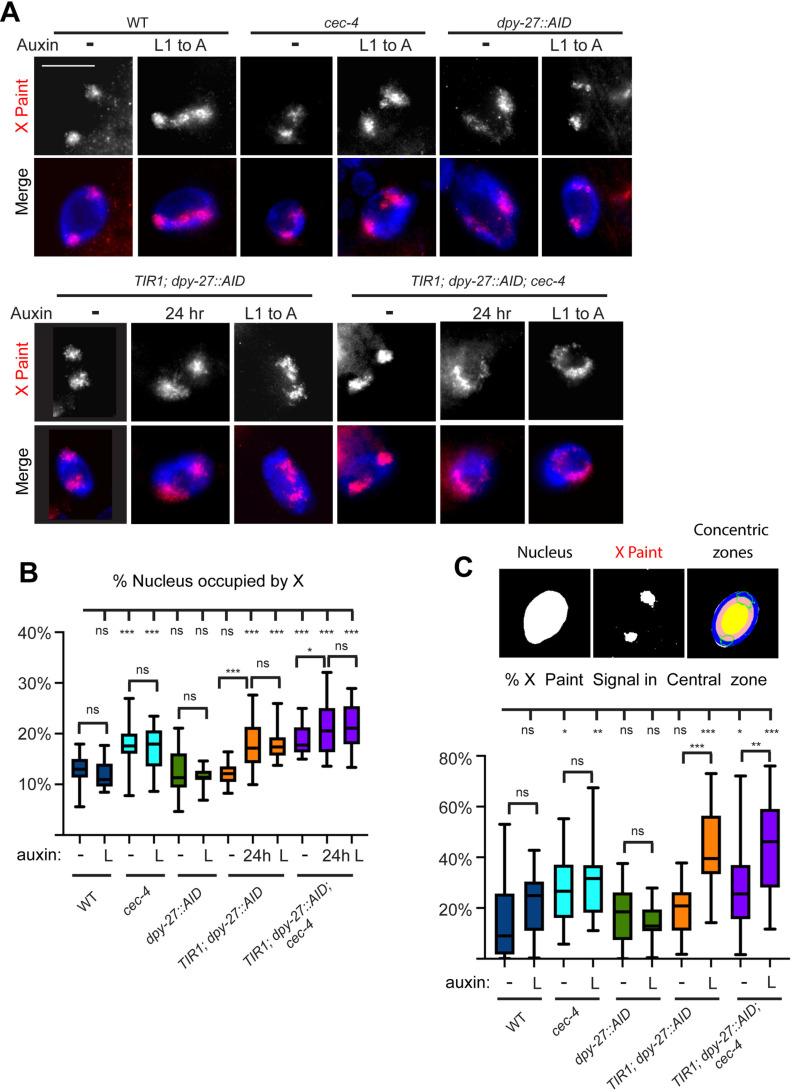
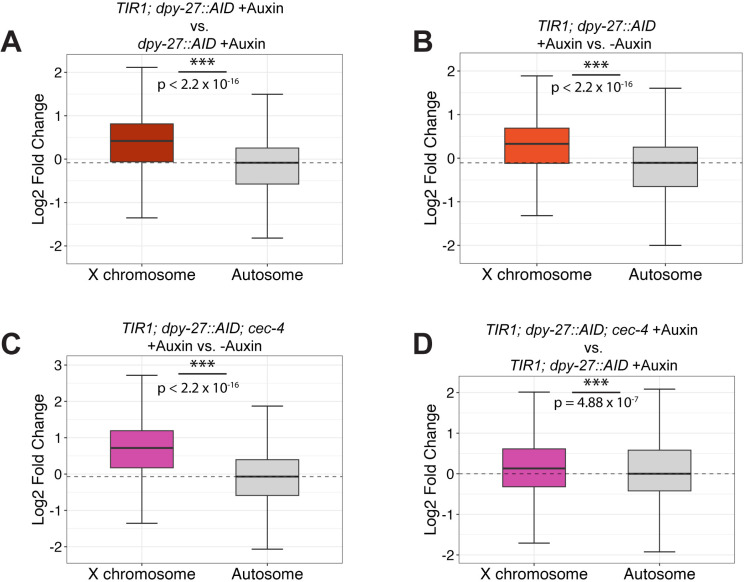
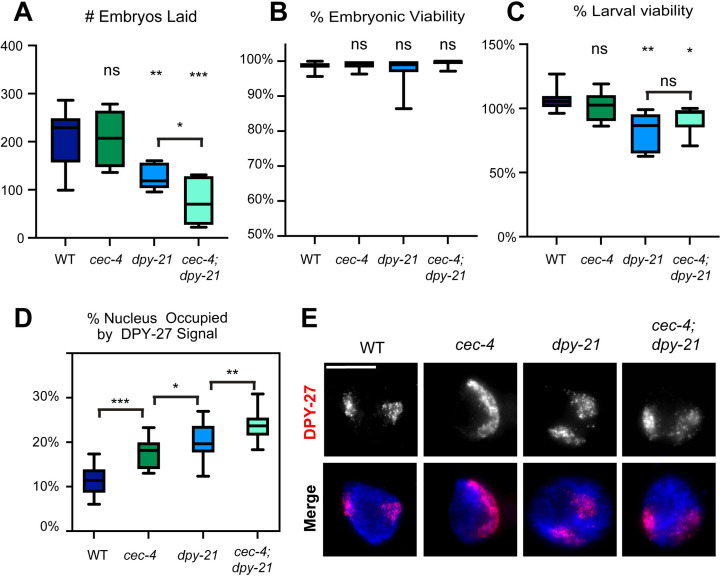
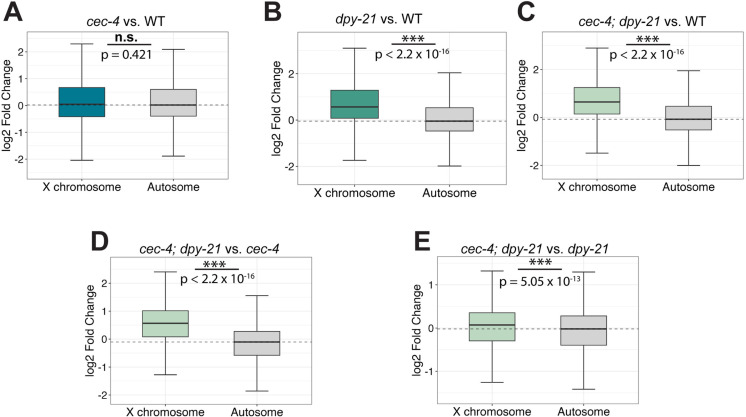
Dosage compensation in Caenorhabditis elegans equalizes X-linked gene expression between XX hermaphrodites and XO males. The process depends on a condensin-containing dosage compensation complex (DCC), which binds the X chromosomes in hermaphrodites to repress gene expression by a factor of 2. Condensin IDC and an additional five DCC components must be present on the X during early embryogenesis in hermaphrodites to establish dosage compensation. However, whether the DCC's continued presence is required to maintain the repressed state once established is unknown. Beyond the role of condensin IDC in X chromosome compaction, additional mechanisms contribute to X-linked gene repression. DPY-21, a non-condensin IDC DCC component, is an H4K20me2/3 demethylase whose activity enriches the repressive histone mark, H4 lysine 20 monomethylation, on the X chromosomes. In addition, CEC-4, a protein that tethers H3K9me3-rich chromosomal regions to the nuclear lamina, also contributes to X-linked gene repression. To investigate the necessity of condensin IDC during the larval and adult stages of hermaphrodites, we used the auxin-inducible degradation system to deplete the condensin IDC subunit DPY-27. While DPY-27 depletion in the embryonic stages resulted in lethality, DPY-27 depleted larvae and adults survive. In these DPY-27 depleted strains, condensin IDC was no longer associated with the X chromosome, the X became decondensed, and the H4K20me1 mark was gradually lost, leading to X-linked gene derepression (about 1.4-fold). These results suggest that the stable maintenance of dosage compensation requires the continued presence of condensin IDC. A loss-of-function mutation in cec-4, in addition to the depletion of DPY-27 or the genetic mutation of dpy-21, led to even more significant increases in X-linked gene expression (about 1.7-fold), suggesting that CEC-4 helps stabilize repression mediated by condensin IDC and H4K20me1.


Conflict of interest statement

The authors have declared that no competing interests exist.

Figures

Fig 1
Fig 1. DPY-27 depletion leads to lethality and developmental defects.
(A) Overview of the timeline of auxin exposure initiated from parental age L4 through F1 development. (B) Auxin exposure throughout embryogenesis results in compromised viability in TIR1; dpy-27::AID and TIR1; dpy-27::AID; cec-4 strains. Total counts from three independent replicates are shown. N>600.Significance was determined by Fisher’s exact test relative to wild-type values. Dead embryos and dead larvae were summed as one value for statistical analyses. Complete statistical analysis can be found in S1 File. (C) Overview of the timeline of auxin exposure from the L1 stage for three days. N2 worms in this time frame grow to young adults. (D) Phenotypic images of hermaphrodites exposed to auxin from the L1 stage for three days. Scale bar, 0.5 mm. (E) Larval survival on auxin relative to survival off auxin. Total counts from three independent experiments are shown. N>600. Statistical significance was determined by Chi square tests. Complete statistical analyses can be found in S2 File. n.s. = not significant, * = p < 0.05, ** = p<0.01, *** = p < 0.001.
Fig 2
Fig 2. Auxin treatment leads to depletion of DPY-27.
(A) Immunofluorescence staining of DPY-27 within the intestinal nuclei of young adult hermaphrodites. Maximum intensity projections of DAPI staining of DNA (blue) and DPY-27 signal (red) are shown. DPY-27 is present within the nuclei in strains not exposed to auxin, but exposure to auxin for 3 days starting at L1 results in a significant depletion of DPY-27 signal in strains that contain TIR1 and dpy-27::AID. Original unaltered images are shown on S1 Fig. (B) Maximum intensity projections of nuclei stained with anti-DPY-27 antibodies after auxin exposure for various lengths of times (L1 to adult, 1 hour, or 24 hours). Images were acquired with identical exposure times. Original unaltered images, with HTZ-1 costain, are shown on S1 Fig. Scale bars, 10 µm. (C) Quantification of DPY-27 fluorescence signal in experiments shown in (B). Quantification is based on measuring mean DPY-27 fluorescence in the nucleus, normalized to background level fluorescence, from between 38 and 50 nuclei total collected in three independent experiments. Worms were not exposed to auxin (-), exposed to auxin from L1 stage for three days (L), or exposed to auxin from day 1 of adulthood for 1h or 24 hours. Whiskers indicate min-max values. Statistical analysis was done using Brown-Forsythe and Welch ANOVA tests with multiple comparisons. Comparisons to WT hermaphrodites are shown above and comparisons to WT males are shown below the box plots. For p values and all pairwise comparisons see S3 File. n.s. = not significant, * = p < 0.05, ** = p<0.01, *** = p < 0.001.
Fig 3
Fig 3. In the absence of DPY-27, condensin IDC subunits become unstable.
(A) Maximum intensity projections of CAPG-1-stained intestinal nuclei of young adult hermaphrodites. DAPI staining of DNA (blue) merged with CAPG-1 signal (red) is also shown. DPY-27 is present within the nuclei in strains not exposed to auxin, but exposure to auxin for 3 days starting at L1 leads to lack of X enrichment of CAPG-1 signal in strains that contain TIR1 and dpy-27::AID. Original unaltered images are shown on S4 Fig. (B) CAPG-1 staining after exposing young adults to auxin for 1 hour or 24 hours. Images were acquired with identical exposure times. Maximum intensity projections are shown. Original unaltered images (with HTZ-1 staining control) are shown on S4 Fig. Scale bars, 10 µm. (C) Quantification of CAPG-1 fluorescence signal in the enriched region over non-enriched regions of the nucleus. Quantification is based on line-intensity scan analysis of 30-33 nuclei total collected in three independent experiments. Whiskers indicate min-max values. Statistical analysis was done using Brown-Forsythe and Welch ANOVA tests with multiple comparisons. Comparisons to WT hermaphrodites are shown above and comparisons to WT males are shown below the box plots. For p values and all pairwise comparisons see S4 File. (D) Quantification of mean CAPG-1 fluorescence intensity in the nucleus, normalized to background level fluorescence, from the same nuclei as in (C). Statistical analysis was done using Brown-Forsythe and Welch ANOVA tests with multiple comparisons. Comparisons to WT hermaphrodites are shown above and comparisons to WT males are shown below the box plots. For p values and all pairwise comparisons see S4 File. n.s. = not significant, * = p < 0.05, ** = p<0.01, *** = p < 0.001.
Fig 4
Fig 4. In the absence of DPY-27, H4K20me1 enrichment is lost.
(A) Immunofluorescence staining of H4K20me1 within the intestinal nuclei of young adult hermaphrodites. Maximum intensity projections of DAPI staining of DNA (blue) and H4K20me1 signal (red) are shown. H4K20me1 is clearly enriched in a region within nuclei (assumed to be the X) in strains not exposed to auxin. Auxin exposure for 3 days starting at L1 led to lack of X enrichment of H4K20me1 signal in strains that contain TIR1 and dpy-27::AID. Original unaltered images are shown on S5 Fig. (B) Maximum intensity projections of H4K20me1-stained nuclei after auxin exposure for 1hr or 24 hours. Images were acquired with identical exposure times. Original unaltered images (with HTZ-1 staining control) are shown on S5 Fig. Scale bars, 10 µm. (C) Quantification of H4K20me1 fluorescence signal in the enriched region over non-enriched regions. Quantification is based on line-intensity scan analysis of 29-30 nuclei total collected in three independent experiments. Whiskers indicate min-max values. Statistical analysis was done using Brown-Forsythe and Welch ANOVA tests with multiple comparisons. Comparisons to WT hermaphrodites are shown above and comparisons to WT males are shown below the box plots. For p values and all pairwise comparisons see S5 File. (D) Quantification of mean H4K20me1 fluorescence intensity in the nucleus, normalized to background level fluorescence, from the same nuclei as in (C). Statistical analysis was done using Brown-Forsythe and Welch ANOVA tests with multiple comparisons. Comparisons to WT hermaphrodites are shown above and comparisons to WT males are shown below the box plots. For p values and all pairwise comparisons see S5 File. n.s. = not significant, * = p < 0.05, ** = p<0.01, *** = p < 0.001.
Fig 5
Fig 5. The continued presence of DPY-27 is required for X compaction and peripheral localization within the nucleus.
(A) Intestinal nuclei from adult hermaphrodites were stained with whole X chromosome paint FISH probe (top row, red), and DNA was labeled with DAPI (blue). Images are of young adults not exposed to auxin, worms treated with auxin from L1 to adulthood, or young adults treated with auxin for 24 hours. Scale bars, 10 µm. Original unmodified images are shown on S6 Fig. (B) Quantifications of the X chromosome volume normalized to nuclear size of worms grown auxin (-), worms treated with auxin from L1 stage for three days (L), and young adult worms treated with auxin for 24 hours (24h). Maximum intensity projections are shown in (A) and (B). (C) (top) Three-zone assay segmentation shown on a single slice from the middle of an intestinal nucleus. The amount of X signal (outlined in green) in each zone was quantified. (bottom) The proportion of the X paint signal seen in the central zone of the nucleus. In (C) and (D) 20-24 nuclei total from 3-4 independent experiments were quantified. Differences between samples were evaluated using unpaired Student’s t-test. For complete statistical analysis see S6 and S7 Files. Analyses in all concentric rings can be found in S7 Fig. n.s. = not significant, * = p < 0.05, ** = p<0.01, *** = p < 0.001.
Fig 6
Fig 6. The X-linked genes are derepressed in strains depleted of DPY-27.
(A-D) Boxplots depicting the distribution of the log2 fold change of X-linked genes and autosomal genes in strains being compared. A Wilcoxon rank-sum test was used to determine the statistical significance of the differential gene expression between the X and autosomes. (n.s. = not significant, * = p < 0.05, ** = p<0.01, *** = p < 0.001) (A) The log2 fold change in gene expression of the autosomes and the X chromosomes of TIR1; dpy-27::AID relative to the dpy-27::AID after both strains were exposed to auxin. (B)TIR1; dpy-27::AID treated with auxin compared to the same genotype grown in the absence of auxin. (C) TIR1; dpy-27::AID; cec-4 treated with auxin was compared to no auxin treatment. (D) TIR1; dpy-27::AID; cec-4 compared to TIR1; dpy-27::AID, both treated with auxin. P values for all comparisons are listed in S8 File.
Fig 7
Fig 7. Loss of CEC-4 exacerbates dosage phenotypes caused by mutations in dpy-21.
(A) The average of total number of eggs laid per worm in WT, cec-4, dpy-21, and cec-4; dpy-21 backgrounds. (B) The average percentage of embryos that hatched after 24 hours. (C) The average percentage of larvae that survived to adulthood. (A-C) Progeny from 6-8 individual worms were scored per experiment for each genotype. Results shown are the combined averages from three independent experiments (18<n<24). Statistical significance was determined using Student’s t-test. For statistical analysis and p values see S9 File. (D) The extent of X chromosome decompaction in WT, cec-4, dpy-21, and cec-4; dpy-21 hermaphrodites. A total of 20 nuclei were analyzed from 3-5 independent experiments, no more than 2 nuclei per individual worm. Statistical significance was determined using Student’s t-test. For statistical analysis and p values, see S10 File. (E) Representative images of adult hermaphrodite intestinal nuclei stained for DPY-27 (top) and merged images of DPY-27 (red) and DNA (DAPI, blue). Maximum intensity projections are shown. Unmodified images are shown on S14 Fig. Scale bar, 10 µm. n.s. = not significant, * = p < 0.05, ** = p<0.01, *** = p < 0.001.
Fig 8
Fig 8. Loss of CEC-4 exacerbates gene expression defects caused by mutations in dpy-21.
(A-E) Boxplots depicting the distribution of the expression change in X-linked genes and expression change in genes on autosomes is plotted as the log2 fold change of the strains being compared. Statistical significance is determined by the differences in gene expression between the X and autosomes by a Wilcoxon rank-sum test. (n.s. = not significant, * = p < 0.05, ** = p<0.01, *** = p < 0.001) (A) The log2 fold change in gene expression of the autosomes and the X chromosomes in cec-4 mutant relative to the wild type (N2). (B) The log2 fold change in gene expression of the autosomes and the X chromosomes in dpy-21 mutants relative to wild type (N2). (C) The log2 fold change in gene expression in cec-4; dpy-21 relative to wild type (N2). (D) The log2 fold change in gene expression in cec-4; dpy-21 compared to cec-4. (E) The log2 fold change in gene expression in cec-4; dpy-21 compared to dpy-21. The derepression of the X chromosome genes is significantly higher in the double mutant than in single mutants.

Similar articles

References

    1. Ohno S. Sex chromosomes and sex-linked genes. Monographs Endocrinol. 1967. doi: 10.1007/978-3-642-88178-7 - DOI
    1. Lau AC, Csankovszki G. Balancing up and downregulation of the C. elegans X chromosomes. Curr Opin Genet Dev. 2015;31:50–6. doi: 10.1016/j.gde.2015.04.001 - DOI - PMC - PubMed
    1. Madl JE, Herman RK. Polyploids and sex determination in Caenorhabditis elegans. Genetics. 1979;93(2):393–402. doi: 10.1093/genetics/93.2.393 - DOI - PMC - PubMed
    1. Nusbaum C, Meyer BJ. The Caenorhabditis elegans gene sdc-2 controls sex determination and dosage compensation in XX animals. Genetics. 1989;122(3):579–93. doi: 10.1093/genetics/122.3.579 - DOI - PMC - PubMed
    1. Hodgkin J. X chromosome dosage and gene expression in caenorhabditis elegans: two unusual dumpy genes. Mol Gen Genet. 1983;192(3):452–8. doi: 10.1007/bf00392190 - DOI

MeSH terms

LinkOut - more resources