. 2025 Apr 9;21(4):e1013080.
doi: 10.1371/journal.ppat.1013080. eCollection 2025 Apr.

Genome-wide analysis of fitness determinants of Staphylococcus aureus during growth in milk

Affiliations

Genome-wide analysis of fitness determinants of Staphylococcus aureus during growth in milk

Marita Torrissen Mårli et al. PLoS Pathog. .

Abstract

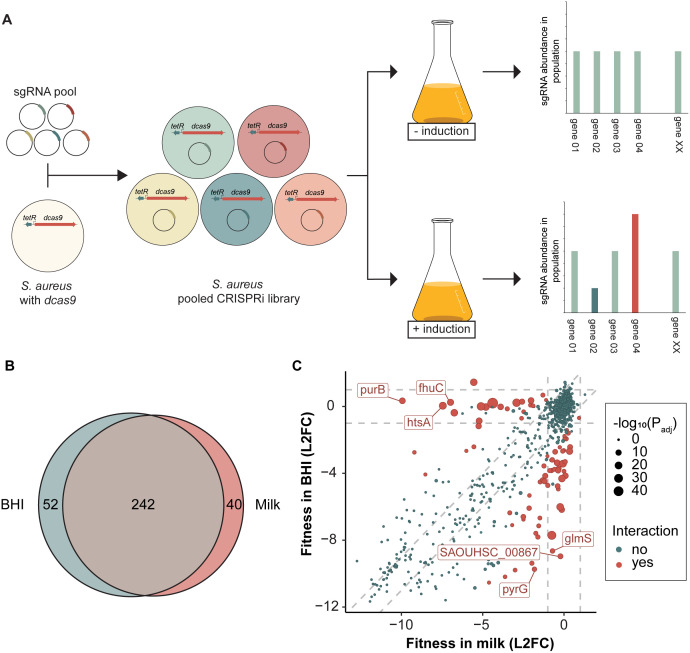
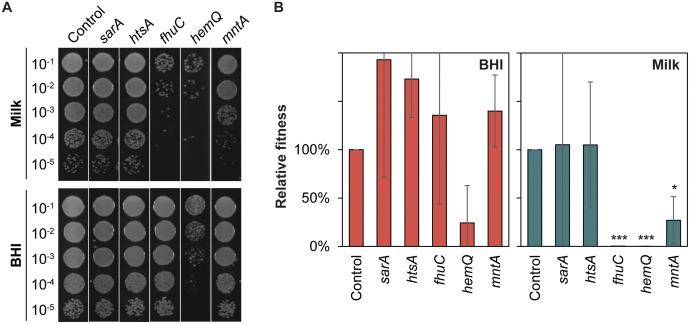
Staphylococcus aureus is a major concern in the dairy industry due to its significance as a pathogen causing bovine mastitis as well as a source of food poisoning. The nutrient-rich milk environment supports bacterial growth, but the specific genetic determinants that facilitate S. aureus proliferation and persistence in milk are poorly understood. In this study, we conducted a genome-wide CRISPR interference sequencing (CRISPRi-seq) screen with the laboratory strain S. aureus NCTC8325-4, to identify fitness determinants essential for S. aureus growth and survival in milk. We identified 282 milk-essential genes, including those with key roles in DNA replication, protein synthesis, and metabolism. Comparative analysis with brain heart infusion (BHI) as growth medium, revealed 79 genes with differential fitness, highlighting specific adaptations required for growth in milk. Notably, we found that purine biosynthesis, folate cycle pathways, and metal acquisition were particularly important in this environment. Based on this, we further demonstrate that S. aureus is more sensitive to the folate inhibitors trimethoprim-sulfamethoxazole (TMP-SMX) in milk and identify several genes whose knockdown results in hypersensitivity to TMP-SMX in milk. Additionally, our analysis showed a relatively reduced importance of cell wall components, such as teichoic acids, for S. aureus fitness in milk, which is also reflected in reduced efficiency of antimicrobials targeting teichoic acids. Together, these findings provide new insights into the genetic basis of S. aureus fitness and antibiotic susceptibility in milk, offering directions for novel treatment strategies against bovine mastitis.


Conflict of interest statement

The authors have declared that no competing interests exist.

Figures

Fig 1
Fig 1. (A) Schematic representation of Ptet-dcas9 on the S. aureus NCTC8325-4 chromosome, and the pVL2336-sgRNA(target) plasmid. (B) Verification of the tetracycline-inducible CRISPRi system in BHI. Growth curves of CRISPRi strains targeting pbp1 (MM269) and a control strain harboring a non-targeting sgRNA (MM268) in BHI in the presence of varying concentrations of aTc, using a 4-fold dilution series from 7.5 ng/mL to 120 ng/mL. Optical density (OD600) was measured at 10-min intervals. Data represent the averages of three independent experiments, each consisting of three technical replicates. Error bars represent the standard error based on these three independent experiments. (C) Verification of the tetracycline-inducible CRISPRi system in UHT milk. CRISPRi strains targeting pbp1 (MM269) and a control strain harboring a non-targeting sgRNA (MM268) were grown in UHT milk with or without induction with 30 ng/ml aTc for 24 hours, and CFU/ml was calculated at 0, 2, 4, 6 and 24 hours. The data represent the average of two independent experiments, with error bars indicating standard error.
Fig 2
Fig 2. (A) Schematic overview of the construction of a CRISPRi pooled library and the subsequent CRISPRi-seq screen. (B) Venn-diagram showing the comparison of essential genes in BHI versus UHT milk identified by CRISPRi-seq. The Venn diagram was created using eulerr.co (C) Fitness effects upon dcas9 induction in BHI versus milk. Genes with significant differential fitness effects (|ΔL2FC| > 1, Padj < 0.05) are depicted in red, with larger points indicating more statistically significant effects. The top three genes with the largest differential L2FC in both directions are marked with labels. Vertical and horizontal dashed grey lines indicate the |L2FC| ≥ 1 threshold. Diagonal dashed grey lines represent the threshold where the difference in L2FC between BHI and UHT milk is greater than 1. Genes that fall far from these diagonal lines exhibit a larger differential fitness effect, highlighting conditionally essential genes. L2FC: log2 fold change.
Fig 3
Fig 3. (A) Spotting assay of CRISPRi strains grown in UHT milk and BHI for ~ 20 generations in the presence of 30 ng/ml aTc. A 10-fold dilution series of each strain was prepared, and 5 µl of each dilution was spotted on BHI agar plates. The control strain harbors a non-targeting sgRNA. The assay was repeated twice with similar results. (B) CRISPRi strains grown in BHI (red) and UHT milk (green) for ~ 20 generations in the presence of 30 ng/ml aTc. The relative fitness is defined as the percentage of CFU/ml of each strain relative to the control strain harboring a non-targeting sgRNA. Data represent the average and standard error based on three independent spotting assays. Statistical significance was determined using two-tailed t-tests comparing each strain against the control within each condition. Significance levels are indicated as follows: * p < 0.05, ** p < 0.01, *** p < 0.001. (C) CRISPRi strains grown in milk with (orange) or without (yellow) 10 µg/ml adenine. Data represent the average and standard error based on four independent spotting assays. Statistical significance was determined using two-tailed t-test. Significance levels are indicated as follows: * p < 0.05, ** p < 0.01, *** p < 0.001. (D). Overview of purine synthesis, folate synthesis, and the folate cycle in S. aureus. The figure depicts key metabolic pathways involved in the synthesis of purines and folate, and the interconnection of these pathways. Genes with differential log2 fold change (L2FC) in milk compared to BHI from the CRISPRi-seq screen are indicated in blue (L2FC ≥ 1, p < 0.05) or red (L2FC ≤ -1, p < 0.05). The purine biosynthetic pathway (highlighted in pink) details sequential conversion of phosphoribosyl pyrophosphate (PRPP) to inosine monophosphate (IMP) and subsequent generation of adenosine triphosphate (ATP) and guanosine triphosphate (GTP). GTP is connected to de novo folate biosynthesis, where it serves as a substrate in the production of 7,8-dihydroneopterin triphosphate (DHN-3P), an early precursor in the folate pathway. In the de novo folate biosynthesis pathway (highlighted in yellow), para-aminobenzoic acid (PABA) is synthesized through the Shikimate and Chorismate pathways and combines with 6-hydroxymethyldihydropterin pyrophosphate (HMDHP-2P) to generate dihydropteroate (DHP), which is converted to dihydrofolate (DHF). DHF is further processed within the folate cycle (highlighted in green), where it is reduced to tetrahydrofolate (THF), which then participates in the one-carbon pool essential for the biosynthesis of nucleotides, amino acids, and other key metabolites. The figure also highlights the inhibition points of trimethoprim (TMP) and sulfamethoxazole (SMX), which targets dihydrofolate reductase (DfrA) and dihydropteroate synthase (FolP), respectively. Abbreviations: PRPP: phosphoribosyl pyrophosphate; PRA: 5-phosphoribosylamine; GAR: 5’- phosphoribosylglycinamide; FGAR: 5’-phosphoribosyl-N-formylglycinamide; FGAM: 2-(formamido)-N1-(5’-phosphoribosyl)acetamidine; AIR: aminoimidazole ribotide; CAIR: 1-(5’-phosphoribosyl)-5-amino-4-imidazolecarboxylate; SAICAR: 1-(5’-phosphoribosyl)-5-amino-4-(N-succinocarboxamide)-imidazole; AICAR: 1-(5’-phosphoribosyl)-5-amino-4-imidazolecarboxamide; FAICAR: 1-(5’-phosphoribosyl)-5-formamido-4-imidazolecarboxamide; IMP: inosine monophosphate; AMP: adenosine monophosphate; ADP: adenosine diphosphate; dADP: deoxyadenosine diphosphate; ATP: adenosine triphosphate; XMP: xanthosine monophosphate; GMP: guanosine monophosphate; GDP: guanosine diphosphate; dGDP: deoxyguanosine diphosphate; GTP: guanosine triphosphate; DHN-3P: 7,8-dihydroneopterin triphosphate; DHN: 7,8-dihydroneopterin; HMDHP: 6-hydroxymethyl-7,8-dihydropterin; HMDHP-2P: 6-hydroxymethyldihydropterin pyrophosphate; DHP: dihydropteroate; DHF: dihydrofolate; THF: tetrahydrofolate; MTHF: 5,10-methylene tetrahydrofolate; dUMP: deoxyuridine monophosphate; dTMP: deoxythymidine monophosphate; TMP: trimethoprim; SMX: sulfamethoxazole; PABA: para-aminobenzoic acid.
Fig 4
Fig 4. (A) Increased sensitivity of S. aureus to trimethoprim-sulfamethoxazole (TMP-SMX) in milk compared to brain heart infusion (BHI) medium. Cultures of S. aureus NCTC8325-4 were diluted 1/1000 in BHI and milk containing a 2-fold dilution of TMP-SMX starting from 0.8 µg/ml TMP and 4.0 µg/ml SMX and subsequently incubated at 37°C for 6 hours. CFU/ml was calculated from 5 µl aliquots spotted on BHI agar plates for each condition, and percentage survival was calculated compared to untreated cultures. Data represent the mean of three independent experiments, with error bars indicating standard errors. (B) Fitness effects upon dcas9 induction in milk with TMP-SMX versus without TMP-SMX. Genes with significant differential fitness effects (|L2FC| ≥ 1, Padj < 0.05) are depicted in red, with larger points indicating more statistically significant effects. Conditionally essential genes selected for follow-up experiments are marked with labels. Vertical and horizontal dashed grey lines indicate the |L2FC| ≥ 1 threshold. Diagonal dashed grey lines represent the threshold where the absolute difference in L2FC between +/- TMP-SMX is greater than 1. Genes that fall far from these diagonal lines exhibit a larger differential fitness effect, highlighting conditionally essential genes. L2FC: log2 fold change. (C) Spotting assay of CRISPRi strains grown in UHT milk (top) or BHI (bottom) for ~ 20 generations in the presence of 0.1 µg/ml TMP and 0.5 µg/ml SMX. 30 ng/ml aTc was added for induction of dCas9 expression. A 10-fold dilution series of each strain was prepared, and 5 µl of each dilution was spotted on BHI agar plates. The control strain harbors a non-targeting sgRNA. (D) CRISPRi strains grown in UHT milk (green) and BHI (red). Relative fitness is defined as the percentage of CFU/ml of each strain relative to the control strain harboring a non-targeting sgRNA. Data represent the average and standard deviation based on three independent experiments. Statistical significance was determined using two-tailed t-tests comparing each strain against the control within the same condition. Significance levels are indicated as follows: * p < 0.05, ** p < 0.01, *** p < 0.001. (E) Schematic illustration of the folate pathway, illustrating the role of NupC in the process. See also legend to Fig 3 for abbreviations.
Fig 5.
Fig 5.. (A) Spotting assay of CRISPRi strains grown in UHT milk (top) and BHI (bottom) for ~20 generations in the presence of 30 ng/ml aTc. A 10-fold dilution series of each strain was prepared, and 5 µl of each dilution was spotted on BHI agar plates. The control strain harbors a non-targeting sgRNA. (B) CRISPRi strains grown in BHI (red) and UHT milk (green) for ~ 20 generations in the presence of 30 ng/ml aTc. The relative fitness is presented as the percentage of CFU/ml of each strain relative to the control strain harboring a non-targeting sgRNA. Data represent the average and standard errors based on three independent experiments. Statistical significance was determined using two-tailed t-tests comparing each strain against the control within each condition. Significance levels are indicated as follows: * p < 0.05, ** p < 0.01, *** p < 0.001.
Fig 6
Fig 6. Survival of S. aureus in response to tunicamycin (A) and targocil (B) treatment in BHI and milk.
Overnight cultures of S. aureus were diluted 1:1000 in BHI and milk, exposed to tunicamycin or targocil in a 2-fold dilution series, starting at 16 µg/ml and 4 µg/ml, respectively. Cultures were incubated at 37 °C for 6 hours before 10-fold dilutions were spotted onto BHI agar. S. aureus survival was calculated as the percentage of CFU/ml relative to untreated cultures. Data represent the average and standard errors based on three independent experiments.

Similar articles

Cited by

References

    1. Sharun K, Dhama K, Tiwari R, Gugjoo MB, Iqbal Yatoo M, Patel SK, et al.. Advances in therapeutic and managemental approaches of bovine mastitis: a comprehensive review. Vet Q. 2021;41(1):107–36. doi: 10.1080/01652176.2021.1882713 - DOI - PMC - PubMed
    1. Cieza MYR, Bonsaglia ECR, Rall VLM, Santos MVD, Silva NCC. Staphylococcal enterotoxins: description and importance in food. Pathogens. 2024;13(8):676. doi: 10.3390/pathogens13080676 - DOI - PMC - PubMed
    1. Riva A, Borghi E, Cirasola D, Colmegna S, Borgo F, Amato E, et al.. Methicillin-resistant Staphylococcus aureus in raw milk: prevalence, SCCmec typing, enterotoxin characterization, and antimicrobial resistance patterns. J Food Prot. 2015;78(6):1142–6. doi: 10.4315/0362-028X.JFP-14-531 - DOI - PubMed
    1. Sutra L, Poutrel B. Virulence factors involved in the pathogenesis of bovine intramammary infections due to Staphylococcus aureus. J Med Microbiol. 1994;40(2):79–89. doi: 10.1099/00222615-40-2-79 - DOI - PubMed
    1. Marshall VM, Tamime AY. Starter cultures employed in the manufacture of biofermented milks. Int J of Dairy Tech. 1997;50(1):35–41. doi: 10.1111/j.1471-0307.1997.tb01733.x - DOI

MeSH terms

Substances