. 2025 Apr 11;11(15):eadq4297.
doi: 10.1126/sciadv.adq4297. Epub 2025 Apr 9.

CD22 TCR-engineered T cells exert antileukemia cytotoxicity without causing inflammatory responses

Affiliations

CD22 TCR-engineered T cells exert antileukemia cytotoxicity without causing inflammatory responses

Kilyna A Nguyen et al. Sci Adv. .

Abstract

Chimeric antigen receptor (CAR) T cells effectively treat B cell malignancies. However, CAR-T cells cause inflammatory toxicities such as cytokine release syndrome (CRS), which is in contrast to T cell receptor (TCR)-engineered T cells against various antigens that historically have rarely been associated with CRS. To study whether and how differences in receptor types affect the propensity for eliciting inflammatory responses in a model system wherein TCR and CAR target equalized sources of clinically relevant antigen, we discovered a CD22-specific TCR and compared it to CD22 CAR. Both CD22 TCR-T and CD22 CAR-T cells eradicated leukemia in xenografts, but only CD22 CAR-T cells induced dose-dependent systemic inflammation. Compared to TCR-T cells, CAR-T cells disproportionately upregulated inflammatory pathways without concordant augmentation in pathways involved in direct cytotoxicity upon antigen engagement. These differences in antileukemia responses comparing TCR-T and CAR-T cells highlight the potential opportunity to improve therapeutic safety by using TCRs.


Figures

Fig. 1.
Fig. 1.. Identification of HLA-A*02:01–restricted TCRs against CD22 from HLA-A*02:01–negative donors.
(A) HLA-A*02:01 CD8+ T cells were isolated from PBMC by magnetic negative selection. CD8+ T cells were incubated with CD22 peptide–HLA-A*02:01 tetramers for 1 hour, and the tetramer-bound population was positively enriched. Tetramer-bound CD8+ T cells were stimulated with HLA-A*02:01+ DC loaded with the CD22p228–236 peptide. Second stimulation was provided with irradiated K562A2 (K562 expressing only HLA-A*02:01 allele) in the presence of irradiated PBMC autologous to the CD8+ T cells. Illustrations were made with BioRender.com. (B) HLA-A2 peptide-binding assay (Supplementary Methods). Cell-surface HLA-A2 expression on a TAP-deficient cell line (T2) was assessed by flow cytometry after overnight incubation with indicated peptides in serum-free media. HPV-16 E7p11–19: HLA-A*02:01–restricted (42). KKLC1p52–60: HLA-A*01:01–restricted (108). (C) Cells from the in vitro stimulation wells were assessed for binding to CD22 tetramers and E7 tetramers by flow cytometry. Representative dot plots are shown. (D) Cells in in vitro stimulation plate were cocultured for 4 hours with the indicated cell lines (E:T = 1:1, 1 × 105 cells each), and tetramer binding and IFN-γ production were assessed by flow cytometry. Representative dot plots of donor 22-well #11 and donor 146-wells #6 and #8 are shown. Among the CD22 tetramer+ population, the presence and absence of IFN-γ responses are highlighted in pink and blue, respectively.
Fig. 2.
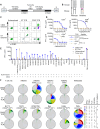
Fig. 2.. The CD22 TCR recognizes B cell leukemia and lymphoma cells in an HLA-A*02:01– and CD22-dependent manner.
(A) Schematic of the gammaretroviral vector encoding the CD22 TCR alpha and beta chains. (B) Design of the TCR composed of human variable regions and mouse constant regions with modifications as previously described (–44) (Supplementary Methods). (C) CD22 TCR– and E7 TCR–transduced T cells were stained with CD22 or E7 tetramers: green (CD8+) and purple (CD4+). Murine TCR beta constant region (mTRBC) is a marker of transduction efficiency. (D) Bulk (CD3+), CD8+, and CD4+ enriched T cells transduced to express either the CD22 TCR or E7 TCR were cocultured with K562A2 loaded with the indicated peptides (E:T = 1:1). IFN-γ levels in the overnight coculture were measured by ELISA. (E) CD22 TCR-T and E7 TCR-T (bulk, CD3+) were cocultured overnight with the indicated cell lines (E:T = 1:1). IFN-γ levels were measured by ELISA. The CD22 and HLA-A*02:01 expression of each cell line is indicated as + or –. (F) CD22 TCR-T and E7 TCR-T were cocultured with the indicated cell lines for 4 hours (E:T = 2:1). CD107a and intracellular IFN-γ, TNFα, and IL-2 were assessed by flow cytometry. Pie charts show the percentages of TCR-T expressing each combination of markers. Representative figure from three independent experiments, each performed with two biological replicates (independent PBMC donors). Technical replicates: n = 3 (D) and n = 2 [(E) and (F)]. Illustrations [(A) and (B)] were made with BioRender.com.
Fig. 3.
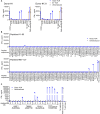
Fig. 3.. The CD22 TCR does not cross-react with other peptides from human proteome at physiological concentrations.
(A) TCR-transduced T cells were cocultured with K562A2 loaded with 1 μM of the CD22 epitope peptide (CD22p228–236) or altered-ligand peptides with alanine substitution of each residue. IFN-γ levels in the overnight coculture supernatant were measured by ELISA. (B) CD22 TCR-T were cocultured with K562A2 loaded with cross-reactive screening candidate peptides #1 to 127 (1 μM). IFN-γ levels in the overnight coculture supernatant were measured by ELISA. (C) CD22 TCR-T were cocultured with K562A2 loaded with the indicated concentrations of peptides. IFN-γ levels in the overnight coculture supernatant were measured by ELISA. Coculture assays were set up at an E:T = 1:1. Representative figures from three independent experiments, each performed with two biological replicates (independent PBMC donors). Technical replicates: n = 2.
Fig. 4.
Fig. 4.. The CD22 TCR-T mediates in vivo antileukemia/lymphoma activity.
(A) NSG mice were intravenously injected with human lymphoma cell line DG-75 expressing firefly luciferase (DG-75-ffLuc) 1 × 106 cells per mouse on day −7, and T cells were intravenously administered on day 0 at doses described in subsequent figure legends. (B) Survival of treated mice are shown. MART1 TCR (clone DMF5) is specific to an HLA-A*02:01–restricted epitope MART-1p26–35, an antigen not expressed by the target cell line. (C and D) Bioluminescent signals (tumor burden) were measured by IVIS (Perkin Elmer). Color scale is shown in fig. S21. (C) IVIS images and (D) average radiance of bioluminescent signals are shown. (E) NSG mice were intravenously injected with human leukemia cell line BV173 expressing firefly luciferase (BV173-ffLuc) 1 × 106 cells per mouse on day −7, and T cells were intravenously administered on day 0. (F and G) Bioluminescent signals were measured by IVIS, and images (F) and average radiance (G) are shown. Biological replicates: n = 4 (n = 5 in CD22 TCR 3 × 107 group) (B), n = 4 (n = 3 in PBS group) [(C) and (D)], and n = 5 [(F) and (G)]. Representative figure from three independent experiments. *P < 0.05, **P < 0.01, and ****P < 0.0001 by log-rank Mantel-Cox method (B), one-way ANOVA with Holm-Sidak correction (D), and Kruskal-Wallis test with Dunn’s correction (G). n.s., not significant. Illustrations [mouse in (A) and (E)] were made with BioRender.com.
Fig. 5.
Fig. 5.. Exogenous addition of CD8αβ heterodimers augments antileukemia activity of the CD22 TCR-T.
(A) CD8+ or CD4+ T cells were co-transduced with TCR and either CD8α or CD8α + CD8β chains. Schematic illustration and representative flow cytometry dot plots show the cell-surface coreceptor expression patterns. (B) CD22 TCR-T were cocultured overnight with peptide-loaded K562A2, and IFN-γ levels were measured (ELISA). Exogenously added CD8αα and CD8αβ; exCD8αα and exCD8αβ, respectively. (C) CD8+ CD22 TCR-T with or without exCD8αα or exCD8αβ were cocultured with peptide-loaded K562A2. WHAL1 peptide is weakly cross-reactive with the CD22 TCR (Fig. 3). (D and E) Using the experimental schema in Fig. 4E, mice were treated with bulk T cells (CD3+) expressing either CD22 TCR or MART1 TCR with or without exCD8αβ (1 × 107 cells per mouse). Bioluminescent signals measured by IVIS are shown as images (D) and average radiance (E). (F to H) Using the experimental schema in Fig. 4E, mice were treated with CD8+, CD4+, or 1:1 mixture of CD8+ and CD4+ T cells transduced with CD22 TCR or MART1 TCR, each with and without exCD8αβ. IVIS images (G) and average radiance (H) are shown. [(B to (E), (G), and (H)] Representative of three independent experiments. Technical replicates: n = 3 (B) and n = 2 (C). Biological replicates: n = 4 to 5 [(D) to (H)] (except PBS in G; n = 3). *P < 0.05, ***P < 0.001, and ****P < 0.0001, by Kruskal-Wallis test with Dunn’s correction [(B), (E), and (H)]. Illustrations [(A), mouse in (F)] were made with BioRender.com.
Fig. 6.
Fig. 6.. Pro-inflammatory responses are overrepresented in CAR-activated T cells compared to TCR-activated T cells.
(A) CD22 and CD19 cell-surface expression on B cell leukemia and lymphoma lines. MOLT4 is a T-acute lymphoblastic leukemia line (negative control). Mean fluorescence intensity (MFI). (B) In vitro cytotoxicity of CD8+ and CD4+ CD22 CAR-T and CD22 TCR-T with or without exCD8αβ against indicated cell lines after 4 hours of coculture. (C) Levels of indicated cytokines in overnight coculture supernatant (E:T = 1:1) are shown (ELISA). (D to G) Transcriptional profiling of CD22 CAR-T and CD22 TCR-T with or without exCD8αβ at baseline and 6 hours following stimulation with BV173 (fig. S11). (D) The 2D plots of top three principal components (PCs). (E) GSEA of RNA-seq data for contrasts between CD8 CAR and CD8 TCR + exCD8αβ post-stimulation. Gene sets (hallmark) that were enriched in either direction with FDR q-value <0.25 and adjusted P value <0.05 are shown. (F) Unsupervised clustering analysis of RNA normalized counts of genes identified in the leading edge subset of inflammatory response gene sets. (G) RNA normalized counts of select genes are shown for CD8+ (8) and CD4+ (4) cell products pre- and post-stimulation. ExCD8αβ is abbreviated as +ex8 (C). Representative figure from three independent experiments [(B) and (C)]. Technical replicates: n = 3 (B) and n = 2 (C). Biological replicates: n = 3 [(D) to (G)].
Fig. 7.
Fig. 7.. CD22 TCR-T eradicate leukemia without causing systemic inflammation, while CD22 CAR-T induce cell dose–dependent inflammation.
(A to E) Using the experimental schema in Fig. 4E, mice were treated with indicated type and doses of T cells. CAR-T dose that mediates equivalent cytotoxicity as CD22 TCR-T 3 × 107 [(A) and (B)] and CD22 TCR-T + exCD8αβ (+ex8) 1 × 107 (C, D) were identified. Bioluminescent signals measured by IVIS are shown as images [(A) and (C)] and average radiances [(B) and (D)]. (E) Serum IFN-γ levels on day 2 measured by MSD assay. (F) Leukemia-bearing mice were injected on day −1 with bulk PBMC (3.5 × 107) from the HLA-A*02:01+ donor autologous to the T cells. On day 0, CAR-T (5 × 106) or TCR-T with or without exCD8αβ (2 × 107) were injected. (G) Serum cytokine levels on day 2 measured with MSD assay. All experiments in this figure are with bulk T cells. Representative from three (A to E) and two (G) independent experiments. Biological replicates: [(A) and (B)] n = 5 (CAR 1 × 105 and CAR 5 × 105), n = 4 (all other); [(C) and (D)] n = 5 (CAR groups), n = 4 (all other). (E) n = 5 (CAR 1 × 104, CAR 1 × 105, CAR 5 × 105, and CD22TCR 5 × 106), n = 9 (CAR 5 × 106, MART1TCR 3 × 107, CD22TCR 3 × 107, and PBS). (G) Pooled data from two independent experiments with total biological replicates: n = 10 (CAR and CAR + PBMC), n = 9 (CD22TCR, CD22TCR + PBMC, CD22TCR + exCD8αβ, and CD22TCR + exCD8αβ + PBMC), n = 6 (MART1TCR + exCD8αβ + PBMC), n = 5 (MART1 + exCD8αβ), n = 4 (PBS + PBMC), and n = 3 (PBS). *P < 0.05, **P < 0.01, ***P < 0.001, and ****P < 0.0001, by one-way ANOVA with Holm-Sidak correction (B), Mann-Whitney test (E), and Kruskal-Wallis test with Dunn’s correction [(D) and (G)]. Illustration [mouse in (F)] was made with BioRender.com.

References

    1. Kochenderfer J. N., Dudley M. E., Carpenter R. O., Kassim S. H., Rose J. J., Telford W. G., Hakim F. T., Halverson D. C., Fowler D. H., Hardy N. M., Mato A. R., Hickstein D. D., Gea-Banacloche J. C., Pavletic S. Z., Sportes C., Maric I., Feldman S. A., Hansen B. G., Wilder J. S., Blacklock-Schuver B., Jena B., Bishop M. R., Gress R. E., Rosenberg S. A., Donor-derived CD19-targeted T cells cause regression of malignancy persisting after allogeneic hematopoietic stem cell transplantation. Blood 122, 4129–4139 (2013). - PMC - PubMed
    1. Maude S. L., Frey N., Shaw P. A., Aplenc R., Barrett D. M., Bunin N. J., Chew A., Gonzalez V. E., Zheng Z., Lacey S. F., Mahnke Y. D., Melenhorst J. J., Rheingold S. R., Shen A., Teachey D. T., Levine B. L., June C. H., Porter D. L., Grupp S. A., Chimeric antigen receptor T cells for sustained remissions in leukemia. N. Engl. J. Med. 371, 1507–1517 (2014). - PMC - PubMed
    1. Lee D. W., Kochenderfer J. N., Stetler-Stevenson M., Cui Y. K., Delbrook C., Feldman S. A., Fry T. J., Orentas R., Sabatino M., Shah N. N., Steinberg S. M., Stroncek D., Tschernia N., Yuan C., Zhang H., Zhang L., Rosenberg S. A., Wayne A. S., Mackall C. L., T cells expressing CD19 chimeric antigen receptors for acute lymphoblastic leukaemia in children and young adults: A phase 1 dose-escalation trial. Lancet 385, 517–528 (2015). - PMC - PubMed
    1. Turtle C. J., Hanafi L. A., Berger C., Gooley T. A., Cherian S., Hudecek M., Sommermeyer D., Melville K., Pender B., Budiarto T. M., Robinson E., Steevens N. N., Chaney C., Soma L., Chen X., Yeung C., Wood B., Li D., Cao J., Heimfeld S., Jensen M. C., Riddell S. R., Maloney D. G., CD19 CAR-T cells of defined CD4+:CD8+ composition in adult B cell ALL patients. J. Clin. Invest. 126, 2123–2138 (2016). - PMC - PubMed
    1. Gardner R. A., Finney O., Annesley C., Brakke H., Summers C., Leger K., Bleakley M., Brown C., Mgebroff S., Kelly-Spratt K. S., Hoglund V., Lindgren C., Oron A. P., Li D., Riddell S. R., Park J. R., Jensen M. C., Intent-to-treat leukemia remission by CD19 CAR T cells of defined formulation and dose in children and young adults. Blood 129, 3322–3331 (2017). - PMC - PubMed

MeSH terms

Substances