. 2025 Apr 11;11(15):eads3506.
doi: 10.1126/sciadv.ads3506. Epub 2025 Apr 9.

Asparagine transporter supports macrophage inflammation via histone phosphorylation

Affiliations

Asparagine transporter supports macrophage inflammation via histone phosphorylation

Chuanlong Wang et al. Sci Adv. .

Abstract

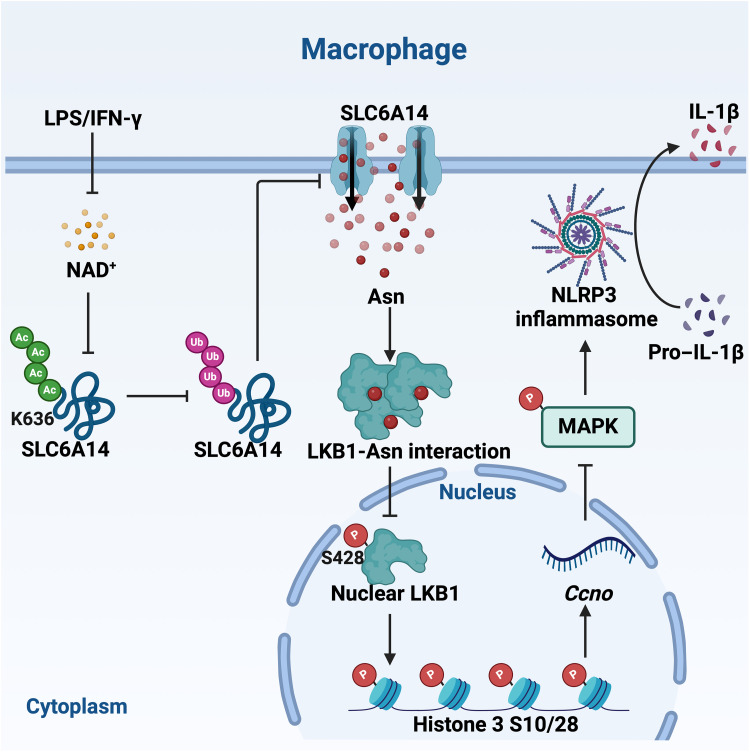
Solute carrier (SLC) family is essential for immune responses; nevertheless, whether and how SLCs regulate macrophage inflammation remains unclear. Here, we demonstrate that K636 acetylation mediates high abundance of SLC6A14 in inflammatory macrophages. Notably, the pharmacological inhibition or genetic modulation of SLC6A14 reduces macrophage interleukin-1β (IL-1β) secretion dependently of lower asparagine uptake and subsequently enhanced nuclear LKB1. Mechanistically, nuclear LKB1 lessens MAPK pathway-mediated NLRP3 inflammasome activation by increased histone 3 S10/28 phosphorylation-dependent cyclin O transcription. Moreover, myeloid Slc6a14 deficiency alleviates pulmonary inflammation via suppressing inflammatory macrophage responses. Overall, these results uncover a network by which SLC6A14-mediated asparagine uptake orchestrates macrophage inflammation through histone phosphorylation, providing a crucial target for modulation of inflammatory diseases.


Figures

Fig. 1.
Fig. 1.. NAD+-mediated acetylation promotes SLC6A14 expression.
(A and B) Relative mRNA expression and protein abundance of Slc6a14 in AMs from PBS-treated and LPS-treated mice (n = 6). The bands in Western blots were from the parallel membranes, the same below. LPS: 10 mg/kg. (C to E) Protein abundance of SLC6A14 in PEMs, BMDMs, 3D4/21, or ANA-1 cells treated with or without LPS/IFN-γ (n = 4). LPS: 1 μg/ml; IFN-γ: 20 ng/ml. (F) Protein abundance of SLC6A14 in PEMs treated as indicated (n = 3). NH4CL: 10 mM; MG132: 10 μM. (G) NAD+ level in PEMs treated with or without LPS/IFN-γ (n = 6). The levels of NAD+ were analyzed by liquid chromatography–mass spectrometry and normalized before statistics. (H) Abundance of Ub and Ac conjugation to endogenous SLC6A14 in PEMs treated as indicated. Data were analyzed by unpaired t test [(A) to (G)]. Panels [(A) and (G)] represented as means ± SEM; panels [(B) to (F)] represented as means ± SD. *P < 0.05, **P < 0.01, ***P < 0.001, and ****P < 0.0001. IP, immunoprecipitation; IgG, immunoglobulin.
Fig. 2.
Fig. 2.. SLC6A14 inhibition limits IL-1β secretion.
(A to C) Secretion of IL-1β and TNF-α from inflammatory PEMs, BMDMs, or ANA-1 cells treated with or without α-MT (n = 4 or 5). α-MT: 2 mM. (D) Protein abundance of p65, p-p65, NLRP3, ASC, Caspase-1, IL-1β in inflammatory macrophages treated as indicated (n = 4). (E) Ratio of p65/DAPI in inflammatory macrophages treated with or without α-MT (with cell as replicate, n = 54 or 61). (F) Protein abundance of nuclear p65 in inflammatory macrophages treated with or without α-MT (n = 4). (G) Confocal microscopy of NLRP3 (red), ASC (purple) and Caspase-1 (green) in inflammatory macrophages treated with or without α-MT. Scale bar, 5 μm. (H) Protein abundance of MFN1, MFN2, and OPA1 in inflammatory macrophages treated as indicated (n = 4). (I) Transmission electron microscopy observation of mitochondrial number (with vision as replicate; n = 7) and area (with mitochondria as replicate; n = 146 or 115) in inflammatory macrophages treated with or without α-MT. Scale bar, 5 or 0.5 μm. (J) Oxygen consumption rates (OCRs) in inflammatory macrophages treated with or without α-MT (n = 5). Data were analyzed by unpaired t test [(A to D), (F), (H), (I) (left), and (J)] or Mann-Whitney U test [(E) and (I), right]. Panels [(A) to (J)] represented as means ± SD; panel (I) (left) represented as means ± SEM. *P < 0.05, **P < 0.01, ***P < 0.001, and ****P < 0.0001. ATP, adenosine 5′-triphosphate. ns, not significant.
Fig. 3.
Fig. 3.. SLC6A14 inhibition reduces NLRP3 inflammasome activation via asparagine.
(A) Amino acid level in inflammatory macrophages treated with or without α-MT for 1 hour (n = 8 or 9). The amino acid concentrations were adjusted by protein. (B) Relative mRNA expression of Slc38a1, Slc38a3, Slc38a5, Slc2a6, Slc7a1 Slc7a7, Nlrp3, Asc, Caspase-1, Il1b, Tnfa, and Il18 in inflammatory macrophages treated with or without α-MT (n = 5 to 7). (C to E) Protein abundance of GCN2, p-GCN2, ATF4, eIF2α, p- eIF2α, S6K, and p-S6K in macrophages treated as indicated (n = 4). (F) Amino acid level in inflammatory macrophages treated with or without α-MT for 12 hours (n = 8 or 9). The amino acid concentrations were measured value. (G) Secretion of IL-1β from inflammatory macrophages treated as indicated (n = 5 or 6). (H) Confocal microscopy of NLRP3 (pink), ASC (red), and Caspase-1 (green) in inflammatory macrophages treated as indicated (with vision as replicate). Scale bars, 10 μm. n = 7. Data were analyzed by unpaired t test [(A) to (E) and (G) and (H)] or Mann-Whitney U test (F). Panels [(A) to (D)] and [(F) to (H)] represented as means ± SEM; panel (E) represented as means ± SD. *P < 0.05, **P < 0.01, ***P < 0.001, and ****P < 0.0001. h, hours.
Fig. 4.
Fig. 4.. SLC6A14 inhibition suppresses MAPK signaling pathway via CCNO.
(A and B) Common pathways and genes between quiescent macrophages versus inflammatory macrophages and inflammatory macrophages versus inflammatory macrophages with α-MT treatment at 1 and 6 hours (n = 4). (C to E) Protein abundance of p38, p-p38, JNK, p-JNK, ERK1/2, and p-ERK1/2 in macrophages treated as indicated (n = 3 or 4). (F) Secretion of IL-1β from inflammatory macrophages treated as indicated (n = 5). JNK inhibitor (SP600125): 10 μM. (G) Protein abundance of Caspase-1 and IL-1β in inflammatory macrophages treated as indicated (n = 4). (H to J) Relative mRNA expression of Ereg, Gm46404, Pdzrn3, Gpr174, Ccno, Nlrp3, Asc, Caspase1, Il1b, and Il18 in inflammatory macrophages treated with or without α-MT (n = 5 to 7). (K) Secretion of IL-1β from inflammatory macrophages treated as indicated (n = 3). (L) The protein abundance of JNK, p-JNK, p38, p-p38, Caspase-1, and IL-1β in inflammatory macrophages treated as indicated (n = 3). Data were analyzed by unpaired t test [(E) to (G) and (I) to (L)]. Panels [(F) to (G) and (I) to (L)] represented as means ± SEM; panel (E) represented as means ± SD. *P < 0.05, **P < 0.01, ***P < 0.001, and ****P < 0.0001. h, hours.
Fig. 5.
Fig. 5.. SLC6A14 inhibition promotes CCNO transcription via nuclear LKB1.
(A and D) Protein abundance of p-LKB1 in inflammatory macrophages treated as indicated (n = 4). (B) Confocal microscopy of LKB1 (red) in inflammatory macrophages treated with or without α-MT (with vision as replicate. Scale bars, 5 μm. n = 4. (C) Protein abundance of nuclear LKB1 in inflammatory macrophages treated with or without α-MT (n = 4). (E) Ratio of LKB1/DAPI in inflammatory macrophages treated with or without α-MT (with cell as replicate, the scale bars are 5 μm, n = 11 or 16). (F) Protein abundance of nuclear LKB1 in inflammatory macrophages treated as indicated (n = 4). (G) Protein abundance of Histone 3 pS10/28 in inflammatory macrophages treated as indicated (n = 4). (H and I) Relative mRNA expression (n = 10) and protein abundance (n = 4) of Ccno in inflammatory macrophages treated as indicated. (J and N) Secretion of IL-1β from inflammatory macrophages treated as indicated (n = 3 or 4). (K and M) Protein abundance of nuclear LKB1, Histone 3 (pS10/28), and CCNO in inflammatory macrophages treated as indicated (n = 4). (O) ChIP-qPCR analysis of the Histone 3 (pS10/28) occupancy at the promoter of Ccno in inflammatory macrophages treated as indicated (n = 6). Data were analyzed by unpaired t test [(A) to (O)]. Panels [(A), (C) and (D)], [(F) to (G)], and [(I) to (O)] represented as means ± SD; panels [(B), (E), and (H)] represented as means ± SEM. *P < 0.05, **P < 0.01, ***P < 0.001, and ****P < 0.0001.
Fig. 6.
Fig. 6.. SLC6A14 deficiency lessens IL-1β secretion in inflammatory macrophages.
(A and D to G) Protein abundance of SLC6A14, Histone 3 (pS10/28), CCNO, JNK, p-JNK, NLRP3, ASC, and Caspase-1 in inflammatory macrophages from Slc6a14fl/fl or Slc6a14fl/flLyz2Cre mice (n = 4). (B) Asparagine level in inflammatory macrophages from Slc6a14fl/fl or Slc6a14fl/flLyz2Cre mice (n = 3). The amino acid concentrations were measured value. (C) Confocal microscopy of LKB1 (red) in inflammatory macrophages from Slc6a14fl/fl or Slc6a14fl/flLyz2Cre mice (with vision as replicate, the scale bars are 5 μm, n = 5). (H, K, and M) Secretion of IL-1β in inflammatory macrophages from Slc6a14fl/fl or Slc6a14fl/flLyz2Cre mice treated as indicated (n = 4 or 6). (I, J, and L) Protein abundance of nuclear LKB1, Histone 3 (pS10/28), CCNO, JNK, p-JNK, NLRP3, ASC, Caspase-1, and IL-1β in inflammatory macrophages from Slc6a14fl/fl or Slc6a14fl/flLyz2Cre mice treated as indicated (n = 3 or 4). Data were analyzed by unpaired t test [(A) to (L)]. Panels [(A) to (M)] represented as means ± SD. *P < 0.05, **P < 0.01, ***P < 0.001, and ****P < 0.0001.
Fig. 7.
Fig. 7.. Myeloid depletion of Slc6a14 alleviates LPS-induced lung inflammation.
(A) Experimental scheme diagram. (B) Confocal microscopy of SLC6A14 (red) and F4/80 (green) in AMs treated as indicated. Scale bars, 50 μm. n = 6. (C) Confocal microscopy of F4/80 (red) and CCNO (green) in AMs treated as indicated. Scale bars, 50 μm. n = 6. (D) Relative mRNA expression of Ccno in AMs treated as indicated (n = 6). (E) Survival rate of mice stimulated by LPS (n = 8). (F to H) mRNA expression and the secretion of IL-1β in the serum, lung, and spleen from Slc6a14fl/fl or Slc6a14fl/flLyz2Cre mice (n = 8). (I) H&E staining analysis of lung from Slc6a14fl/fl or Slc6a14fl/flLyz2Cre mice. Scale bars, 100 μm. n = 8. (J) Confocal microscopy of iNOS (red) and F4/80 (green) in the lung from Slc6a14fl/fl or Slc6a14fl/flLyz2Cre mice. Scale bars, 50 μm. n = 8. (K) Confocal microscopy of CCNO (red) and F4/80 (green) in the lung from Slc6a14fl/fl or Slc6a14fl/flLyz2Cre mice. Scale bars, 50 μm. n = 8. Data were analyzed by unpaired t test [(B) to (D), (F) to (H), and (J) and (K)]. [(B) to (D), (F) to (H), and (J) and (K)] represented as means ± SEM. *P < 0.05, **P < 0.01, ***P < 0.001, and ***P < 0.0001.
Fig. 8.
Fig. 8.. SLC6A14-mediated asparagine uptake maintains macrophage inflammatory responses via histone phosphorylation.

References

    1. Locati M., Curtale G., Mantovani A., Diversity, mechanisms, and significance of macrophage plasticity. Annu. Rev. Pathol. 15, 123–147 (2020). - PMC - PubMed
    1. Wynn T. A., Vannella K. M., Macrophages in tissue repair, regeneration, and fibrosis. Immunity 44, 450–462 (2016). - PMC - PubMed
    1. Lazarov T., Juarez-Carreno S., Cox N., Geissmann F., Physiology and diseases of tissue-resident macrophages. Nature 618, 698–707 (2023). - PMC - PubMed
    1. Zhang J., Muri J., Fitzgerald G., Gorski T., Gianni-Barrera R., Masschelein E., D’Hulst G., Gilardoni P., Turiel G., Fan Z., Wang T., Planque M., Carmeliet P., Pellerin L., Wolfrum C., Fendt S. M., Banfi A., Stockmann C., Soro-Arnaiz I., Kopf M., De Bock K., Endothelial lactate controls muscle regeneration from ischemia by inducing M2-like macrophage polarization. Cell Metab. 31, 1136–1153.e7 (2020). - PMC - PubMed
    1. Sheu K. M., Hoffmann A., Functional hallmarks of healthy macrophage responses: Their regulatory basis and disease relevance. Annu. Rev. Immunol. 40, 295–321 (2022). - PMC - PubMed

MeSH terms

LinkOut - more resources