. 2025 Apr 11;11(15):eadu1727.
doi: 10.1126/sciadv.adu1727. Epub 2025 Apr 9.

Intratumoral mycobiome heterogeneity influences the tumor microenvironment and immunotherapy outcomes in renal cell carcinoma

Affiliations

Intratumoral mycobiome heterogeneity influences the tumor microenvironment and immunotherapy outcomes in renal cell carcinoma

Weiming Mou et al. Sci Adv. .

Abstract

The intratumoral mycobiome plays a crucial role in the tumor microenvironment, but its impact on renal cell carcinoma (RCC) remains unclear. We collected and quantitatively profiled the intratumoral mycobiome data from 1044 patients with RCC across four international cohorts, of which 466 patients received immunotherapy. Patients were stratified into mycobiota ecology-depauperate and mycobiota ecology-flourishing (MEF) groups based on fungal abundance. The MEF group had worse prognosis, higher fungal diversity, down-regulated lipid catabolism, and exhausted CD8+ T cells. We developed the intratumoral mycobiota signature and intratumoral mycobiota-related genes expression signature, which robustly predicted prognosis and immunotherapy outcomes in RCC and other cancers. Aspergillus tanneri was identified as a potential key fungal species influencing RCC prognosis. Our findings suggest that the intratumoral mycobiome suppresses lipid catabolism and induces T cell exhaustion in RCC.


Figures
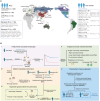
Fig. 1.
Fig. 1.. Overall study design.
(A) Basic information of all cohorts included in this study. The world map showed the countries or regions of origin for the RCC cohorts included in the relevant studies. (B) Study flowchart. NSCLC, non–small cell lung cancer; mUC, metastatic urothelial cancer; CRC, colorectal cancer; RCC, renal cell carcinoma; PDAC, pancreatic ductal adenocarcinoma.
Fig. 2.
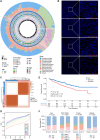
Fig. 2.. Intratumoral mycobiota landscape in RCC and group construction.
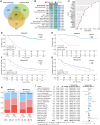
(A) Composition of intratumoral fungi (class level) and clinical information of TCGA-KIRC patients. From inner to outer, the mapped information includes OS, gender, age, AJCC stage, T stage, N stage, M stage, and the relative abundance of intratumoral fungi at the class level in each sample. (B) Fluorescence in situ hybridization (FISH) showing the presence of fungi in tumor tissues of patients with RCC. Scale bar, 100 μm (10×) and 20 μm (40×). (C and D) Consensus clustering based on the intratumoral mycobiota abundance in TCGA-KIRC. (C) Consensus score matrix for all samples when k = 2. (D) Consensus matrix CDF curves for different k values. (E) Kaplan-Meier curves of OS for the two groups (named group A and group B) obtained based on consensus clustering [P = 2.1 × 10−4, HR (95% CI) =1.78 (1.31 to 2.42)]. (F) Differences in various clinical characteristics between group A and group B, with significance tested using the chi-square test.
Fig. 3.
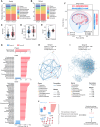
Fig. 3.. Heterogeneity of fungal communities between groups.
(A and B) Relative abundance of fungi at different taxonomic levels in group A and group B, showing only the top eight taxa. (A) Family level; (B) genus level. (C to E) Comparison of fungal alpha diversity between group A and group B using three indices: Shannon, Simpson, and Chao 1. (F) Comparison of fungal community differences between group A and group B based on beta diversity using principal coordinate analysis (PCoA) with Bray-Curtis distance, statistically tested using PERMANOVA. (G) Identification of fungi with the abundance differences between group A and group B using LEfSe analysis. The bar plot showed the results at the phylum, class, and order levels (LDA score > 2, FDR <0.05). (H and I) Fungal community co-occurrence networks and network topology parameters for group A and group B. The nodes implied individual fungi, and edges represented significant Spearman correlations between fungi (|ρ| > 0.80, FDR < 0.05). The nodes and edges of the networks were colored according to fungi (genus level), with the top eight most abundant fungi assigned different colors and the remaining fungi colored gray. The blue edges of the network represented the positive correlations between fungi. The thickness of the edges was the weight of the correlation. (H) Interaction network for group A (node: 21, edges: 46, modularity: 0.23, average degree: 4.38). (I) Interaction network for group B (node: 120, edges: 1396, modularity: 0.28, average degree: 23.27). (J) Group definition based on the features of fungal communities. LEfSe, linear discriminant analysis effect size; LDA, linear discriminant analysis; PERMANOVA, permutational multivariate analysis of variance. ***P < 0.001.
Fig. 4.
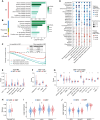
Fig. 4.. Unique metabolic characteristics and immune microenvironment between different groups.
(A and B) Metabolic and immune-related pathways obtained by ORA based on DEGs between groups (different ribbons represented different sources of gene sets). Pink, GO database; light blue, KEGG database; lime green, Reactome database; orange, WikiPathways; purple, Hallmark database. (C) Lipid catabolism pathways significantly down-regulated in the MEF group compared to the MED group in GSEA. (D) Spearman correlation between lipid catabolism pathways and differentially abundant fungi (genus level) between MED and MEF groups. Lipid catabolism pathways were obtained from GSEA results (FDR < 0.05), and differentially abundant fungi were obtained from LEfSe results (LDA score > 2, FDR < 0.05). The size of the bubbles represented the level of correlation. The color of the bubbles indicated the FDR level: blue, negative correlation; red, positive correlation. (E) Proportions of major cells in the immune microenvironment of MED and MEF groups obtained using the xCell. (F) Proportions of CD8+ T cells in MED and MEF groups based on CIBERSORT, EPIC, TIMER, and quanTIseq. (G) Proportions of CD8+ T cell subtypes within MED and MEF groups obtained using gene sets provided by Zheng et al. (59). Tn, naïve T cells; Tem, effector memory T cells; Temra, terminally differentiated effector memory or effector; KIR, killer cell immunoglobulin-like receptors; Trm, tissue-resident memory T cells; Tex, exhausted T cells; ISG, interferon-stimulated genes. (H) Scores of terminal Tex in MED and MEF groups. (I) Expression levels of exhausted CD8+ T cell–related markers (CTLA-4, LAG-3, and PDCD1) in MED and MEF groups. (J) Expression levels of immunosuppressive genes IDO1, SLAMF7, and VEGFA in MED and MEF groups. ORA, overrepresentation analysis; DEGs, differentially expressed genes; GSEA, gene set enrichment analysis; NES: normalized enrichment score; TME: tumor microenvironment. *P < 0.05, **P < 0.01.
Fig. 5.
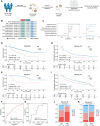
Fig. 5.. Construction of IMS to predict prognosis and immunotherapy response in patients with RCC through integrated machine learning.
(A) Screening process for selecting fungi as input for machine learning model training. (B) Machine learning based on 40 fungi, establishing 100 predictive models and calculating the C-index of each model in all datasets (only the first 10 models were shown here; the complete result can be found in fig. S4A). (C) Information on the seven fungi in IMS. The left side showed the model coefficients of the fungi; the right side showed the HR and 95% CI of each fungus in TCGA-KIRC. (D) KM curve of OS obtained by applying IMS scores in TCGA-KIRC [P = 1.6 × 10−10; HR (95% CI) = 2.73 (1.98 to 3.76)]. (E) KM curve of OS obtained by applying IMS scores in WCH-RCC [P = 0.016; HR (95% CI) =4.25 (1.18 to 15.3)]. (F) ROC curve for OS prediction based on IMS scores in TCGA-KIRC (AUC = 0.682, 95% CI: 0.633 to 0.731). (G) ROC curve for OS prediction based on IMS scores in WCH-RCC (AUC = 0.671, 95% CI: 0.500 to 0.842). (H) PFS curve obtained by applying IMS scores in the IMmotion150 cohort of patients receiving immunotherapy [P = 0.0095, HR (95% CI) =1.96 (1.17 to 3.29)]. (I) PFS curve obtained by applying IMS scores in the IMmotion151 cohort of patients receiving immunotherapy [P = 0.018, HR (95% CI) =1.42 (1.06 to 1.90)]. (J) Clinical response rates to immunotherapy [complete response (CR)/partial response (PR) and stable disease (SD)/progressive disease (PD)] in the high and low IMS score groups of the IMmotion150 cohort, with significance tested using the chi-square test. (K) Clinical response rates to immunotherapy (CR/PR/SD/PD) in the high and low IMS score groups of the IMmotion151 cohort, with significance tested using the chi-square test.
Fig. 6.
Fig. 6.. A. tanneri as a key fungus influencing prognosis in patients with RCC.
(A) KM curve of OS obtained by grouping TCGA-KIRC patients into high- and low-abundance groups based on A. tanneri abundance [P = 2.2 × 10−8, HR (95% CI) = 2.31 (1.71 to 3.13)]. (B) Sankey diagram showed the distribution of samples in TCGA-KIRC from consensus clustering groups based on mycobiota abundance to high and low IMS score groups obtained from machine learning, and then to high and low A. tanneri abundance groups. MED and MEF groups obtained from consensus clustering; IMS: High and low score groups obtained based on IMS from machine learning; A. tanneri abundance: Groups obtained based on high and low A. tanneri abundance. (C) Spearman correlation between the seven fungi in IMS and lipid catabolism pathways. Lipid catabolism pathways were selected from GSEA results (FDR < 0.05). The size of the bubbles represented the level of correlation. The color of the bubbles indicated the FDR level: blue, negative correlation; red, positive correlation. (D) Proportions of CD8+ T cells between high and low A. tanneri abundance groups obtained from five algorithms (TCGA-KIRC). (E) Expression levels of exhausted CD8+ T cell–related markers (CTLA-4, LAG-3, and PDCD1) in high and low A. tanneri abundance groups. (F and G) Representative images of A. tanneri FISH staining and multiplex immunofluorescence in the CHH-RCC cohort. FISH: A. tanneri (red); DAPI (blue). Scale bar, 80 μm (10×) and 20 μm (40×). Multiplex immunofluorescence: positive cells detected, CD8 (red), PD-1 (green), LAG-3 (purple), CTLA-4 (orange), and DAPI (blue). Scale bar, 80 μm (10×) and 20 μm (40×). (H to J) Spearman correlation scatter plot between A. tanneri and PD-1+ CD8+ T cells (H), LAG-3+ CD8+ T cells (I), and CTLA-4+ CD8+ T cells (J) in the CHH-RCC cohort. *P < 0.05; **P < 0.01.
Fig. 7.
Fig. 7.. Construction of IMRGES through integrated machine learning based on intratumoral fungi-related gene sets.
(A) Venn diagram showing the intersection of three conditional gene sets (n = 69). Fungi-related genes: genes correlated with at least one fungal species that had differential abundance between the MEF and MED groups (FDR < 0.05); prognostic genes: genes that can independently predict patient prognosis (Cox proportional hazards test P < 0.05); DEGs: differentially expressed genes between MED and MEF groups (|logFC| > 1, FDR < 0.05). (B) Machine learning based on 69 fungi-related genes, establishing 92 predictive models and calculating the C-index of each model in all datasets (only the first 15 models were shown here; the complete result can be found in fig. S7A). (C) Importance index of the 23 genes in the selected IMRGES. (D) KM curve of OS for IMRGES scores in the TCGA-KIRC cohort [P = 2.4 × 10−120; HR (95% CI) =52 (31 to 86)]. (E) KM curve of OS for IMRGES scores in the WCH-RCC cohort [P = 2.8 × 10−7; HR (95% CI) =16 (4 to 66)]. (F) KM curve of PFS for IMRGES scores in the IMmotion150 cohort of patients receiving immunotherapy [P = 0.039, HR (95% CI) =1.55 (1.02 to 2.34)]. (G) KM curve of PFS for IMRGES scores in the IMmotion151 cohort of patients receiving immunotherapy [P = 0.012, HR (95% CI) =1.52 (1.10 to 2.11)]. (H) Clinical response rates to immunotherapy (CR/PR/SD/PD) in the high and low IMRGES score groups of the IMmotion150 and IMmotion151 cohorts, with significance tested using the chi-square test. (I) Forest plot showing the results of a meta-analysis of the impact of IMRGES on OS in patients with different cancers at the pan-cancer level. The squares represented the study-specific HRs. The horizontal lines implied the 95% CI. The diamond indicated the summary HR and its corresponding 95% CI. The dashed vertical line represented the summary HR.

References

    1. Siegel R. L., Miller K. D., Wagle N. S., Jemal A., Cancer statistics, 2023. CA Cancer J. Clin. 73, 17–48 (2023). - PubMed
    1. Bui T. O., Dao V. T., Nguyen V. T., Feugeas J.-P., Pamoukdjian F., Bousquet G., Genomics of clear-cell renal cell carcinoma: A systematic review and meta-analysis. Eur. Urol. 81, 349–361 (2022). - PubMed
    1. EAU Guidelines. Edn. presented at the EAU Annual Congress Paris 2024. ISBN 978-94-92671-23-3.
    1. Qayyum T., Oades G., Horgan P., Aitchison M., Edwards J., The epidemiology and risk factors for renal cancer. Curr. Urol. 6, 169–174 (2013). - PMC - PubMed
    1. Nejman D., Livyatan I., Fuks G., Gavert N., Zwang Y., Geller L. T., Rotter-Maskowitz A., Weiser R., Mallel G., Gigi E., Meltser A., Douglas G. M., Kamer I., Gopalakrishnan V., Dadosh T., Levin-Zaidman S., Avnet S., Atlan T., Cooper Z. A., Arora R., Cogdill A. P., Khan M. A. W., Ologun G., Bussi Y., Weinberger A., Lotan-Pompan M., Golani O., Perry G., Rokah M., Bahar-Shany K., Rozeman E. A., Blank C. U., Ronai A., Shaoul R., Amit A., Dorfman T., Kremer R., Cohen Z. R., Harnof S., Siegal T., Yehuda-Shnaidman E., Gal-Yam E. N., Shapira H., Baldini N., Langille M. G. I., Ben-Nun A., Kaufman B., Nissan A., Golan T., Dadiani M., Levanon K., Bar J., Yust-Katz S., Barshack I., Peeper D. S., Raz D. J., Segal E., Wargo J. A., Sandbank J., Shental N., Straussman R., The human tumor microbiome is composed of tumor type-specific intracellular bacteria. Science 368, 973–980 (2020). - PMC - PubMed

MeSH terms